A&A 457, 1081-1093 (2006)
DOI: 10.1051/0004-6361:20065062
R. Kothes1,2 - K. Fedotov1,3 - T. J. Foster1 - B. Uyaniker4,1
1 - National Research Council of Canada,
Herzberg Institute of Astrophysics,
Dominion Radio Astrophysical Observatory,
PO Box 248, Penticton, British Columbia,
V2A 6J9, Canada
2 -
Department of Physics and Astronomy, University of
Calgary, 2500 University Drive N.W., Calgary, AB,
Canada
3 -
Department of Physics and Astronomy, University of
Victoria, PO Box 3055, STN CSC, Victoria, BC, V8W 1A1,
Canada
4 -
Max-Planck-Institut für Radioastronomie,
Auf dem Hügel 69, 53121 Bonn, Germany
Received 21 February 2006 / Accepted 23 May 2006
Abstract
We present a new catalogue containing all known Galactic supernova
remnants observed in phase I and II of the Canadian Galactic Plane Survey
(
![]() ,
,
![]() ).
Stokes I images at 1420 MHz of 34 SNRs and at 408 MHz of 36 SNRs
are displayed. From these
).
Stokes I images at 1420 MHz of 34 SNRs and at 408 MHz of 36 SNRs
are displayed. From these
![]() and
and
![]() -resolution data (respectively) we determine accurate centre
positions and angular dimensions. The flux densities at 1420 and 408 MHz are
integrated and combined with values from the literature to define more
accurate radio spectra. The CGPS polarization data at 1420 MHz were examined
and significant linear polarization from 18 SNRs is found, with a modest
signal from 6 others.
-resolution data (respectively) we determine accurate centre
positions and angular dimensions. The flux densities at 1420 and 408 MHz are
integrated and combined with values from the literature to define more
accurate radio spectra. The CGPS polarization data at 1420 MHz were examined
and significant linear polarization from 18 SNRs is found, with a modest
signal from 6 others.
Key words: atlases - catalogs - polarization - ISM: supernova remnants
As the most significant source of chemical enrichment, energy
input, and cosmic ray production in the interstellar medium (ISM),
supernovae play an important role in the evolution of our Galaxy.
According to a simple calculation by Padmanabhan (2001) about 55% of the
material in the Milky Way would have been processed by supernova explosions
and their remnants. Detailed understanding of the properties of Galactic
supernova remnants (SNRs) - sizes, energies, statistics, etc. - is thus
of great importance in understanding the physical structure of the interstellar
medium (ISM). Ultimately, such understanding rests on estimation of accurate
unbiased characteristics of SNRs. However, characteristics of identified SNRs
are often poorly known (for example, spectral and polarization properties and
even
total angular extent), and in particular distances to these objects are quite
ill-defined. A problem significant at low radio frequencies and low resolution
is the contribution of galactic/extragalactic point sources to the total flux,
which results in overestimated flux values. Additionally the total dimension of
a given SNR may not be easily found due to diffuse extended emission
that cannot be detected by telescopes with low sensitivity or interferometers
due to missing single antenna data. This would lead to an underestimate of the
real fluxes. These effects contribute to conflicting flux density measurements
for the same source at similar frequencies, which are indeed very often found
throughout the literature.
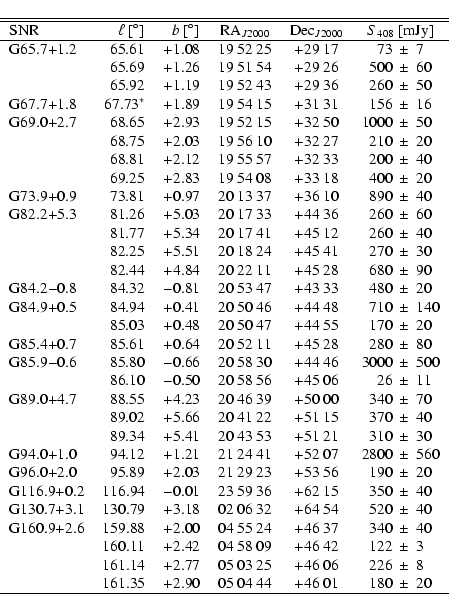
| Source | b [
|
RAJ2000 | DecJ2000 |
|
|
Mosaic Codes | |
| G65.1+0.6 | 65.14 | +0.41 | 19 53 57 | +28 32 | 1.17 | 1.13 | MR1 + C7 |
| G65.7+1.2 | 65.72 | +1.20 | 19 52 13 | +29 26 | 0.38 | 0.35 | MR1 + C7 |
| G67.7+1.8 | 67.74 | +1.80 | 19 54 38 | +31 28 | 0.25 | 0.20 | MQ2 + C7 |
| G68.6-1.2 | 68.59 | -1.21 | 20 08 40 | +30 36 | 0.38 | 0.38 | MQ1 + C7 |
| G69.0+2.7 | 68.81 | +2.57 | 19 54 07 | +32 47 | 1.88 | 1.48 | MQ2 + C7 |
| G69.7+1.0 | 69.69 | +1.01 | 20 02 38 | +32 43 | 0.27 | 0.23 | MQ2 + C7 |
| G73.9+0.9 | 73.83 | +0.90 | 20 13 57 | +36 08 | 0.47 | 0.43 | MP2 + C6 |
| G74.9+1.2 | 74.96 | +1.15 | 20 16 03 | +37 13 | 0.17 | 0.13 | MP2 + C6 |
| G76.9+1.0 | 76.89 | +0.97 | 20 22 20 | +38 43 | 0.15 | 0.13 | MO2 + C6 |
| G78.2+2.1 | 78.18 | +2.12 | 20 21 14 | +40 26 | 1.13 | 1.13 | MO2 + C6 |
| G82.2+5.3 | 82.17 | +5.29 | 20 19 11 | +45 30 | 2.05 | 1.47 | MN2 + C6 |
| G83.0-0.3 | 83.02 | -0.27 | 20 46 54 | +42 52 | 0.15 | 0.12 | MM1 + C6 |
| G84.2-0.8 | 84.20 | -0.81 | 20 53 22 | +43 27 | 0.40 | 0.32 | MM1 + C6 |
| G84.9+0.5 | 84.99 | +0.50 | 20 50 33 | +44 54 | 0.13 | 0.13 | MM1 + C6 |
| G85.4+0.7 | 85.38 | +0.73 | 20 50 57 | +45 21 | 0.70 | 0.65 | MM1 + C6 |
| G85.9-0.6 | 85.96 | -0.63 | 20 58 58 | +45 44 | 0.50 | 0.50 | MM1 + C6 |
| G89.0+4.7 | 89.05 | +4.67 | 21 27 31 | +57 20 | 2.50 | 2.27 | ML2 + C5 |
| G93.3+6.9* | 93.26 | +6.91 | 20 52 19 | +55 20 | 0.48 | 0.43 | C5 |
| G93.7-0.2 | 93.75 | -0.36 | 21 29 56 | +50 44 | 2.00 | 1.73 | MK1 + C5 |
| G94.0+1.0 | 94.00 | +1.03 | 21 24 56 | +51 54 | 0.63 | 0.55 | MK1 + C5 |
| G96.0+2.0 | 96.06 | +1.96 | 21 30 33 | +54 00 | 0.45 | 0.43 | MIJ2 + C5 |
| G106.3+2.7 | 106.35 | +2.79 | 22 27 40 | +60 57 | 1.07 | 0.70 | MG2 + C4 |
| G107.5-1.5 | 107.26 | -1.68 | 22 50 51 | +57 29 | 0.16 | 0.14 | MF1 + C4 |
| G109.1-1.0 | 109.15 | -1.02 | 23 01 39 | +58 53 | 0.58 | 0.52 | MF1 + C4 |
| G113.0+0.1 | 112.98 | +0.13 | 23 26 54 | +61 21 | 0.76 | 0.60 | ME1 + C3 |
| G114.3+0.3 | 114.32 | +0.34 | 23 37 08 | +61 58 | 1.48 | 1.27 | ME1 + C3 |
| G116.5+1.1 | 116.43 | +1.10 | 23 53 12 | +63 14 | 1.32 | 1.22 | MD2 + C3 |
| G116.9+0.2 | 116.94 | +0.19 | 23 59 16 | +62 27 | 0.62 | 0.62 | MD1 + C3 |
| G120.1+1.4 | 120.09 | +1.41 | 00 25 20 | +64 08 | 0.18 | 0.18 | MC2 + C3 |
| G126.2+1.6 | 126.23 | +1.76 | 01 22 04 | +64 26 | 1.48 | 1.42 | MB2 + C2 |
| G127.1+0.5 | 127.11 | +0.56 | 01 28 33 | +63 08 | 0.98 | 0.88 | MA1 + C2 |
| G130.7+3.1 | 130.73 | +3.08 | 02 05 43 | +64 49 | 0.18 | 0.10 | MA2 + C2 |
| G132.7+1.3 | 132.65 | +1.56 | 02 18 03 | +62 47 | 2.07 | 1.78 | MY2 + C2 |
| G156.2+5.7* | 156.17 | +5.61 | 04 58 37 | +51 45 | 1.82 | 1.59 | C0 |
| G160.9+2.6 | 160.38 | +2.74 | 05 00 35 | +46 41 | 2.48 | 2.32 | MEY2 + C0 |
| G166.0+4.3 | 166.14 | +4.25 | 05 26 27 | +42 54 | 1.60 | 0.83 | MEX2 + CM1 |
Unbiased, high resolution, wide-field images of all major constituents of the Galactic ISM in the Outer Galaxy are now becoming available in the Canadian Galactic Plane Survey (CGPS, Taylor et al. 2003). The CGPS data probe the ionized, neutral, particulate, and magneto-ionic media over unprecedented spatial dynamic range, and are allowing new insights into the SNR population in our Galaxy. The synthesis telescope at the Dominion Radio Astrophysical Observatory (DRAO, Landecker et al. 2000) has been used to undertake simultaneous observations at two radio frequencies providing data for Stokes I at 408 MHz and full linear polarization information at 1420 MHz. This spectacular dataset has already been used to discover five low surface brightness SNRs (Kothes et al. 2005; Kothes 2003; Kothes et al. 2001).
In this, the first part of the CGPS SNR catalogue, we present images, newly determined flux densities at 408 MHz and 1420 MHz in Stokes I, and fractional linear polarization at 1420 MHz, for a total of 36 supernova remnants in the first and second quadrants of the Milky Way. We also include all flux densities we could find published in the literature to determine more accurate radio spectra for these SNRs.
In the second part of the catalogue (in prep.) distances, dimensions, and the spatial distribution of the SNR population will be discussed. A planned third part will contain a statistical analysis of the newly determined SNR properties.
The radio continuum data were obtained using the synthesis telescope (ST) of the Dominion Radio Astrophysical Observatory (DRAO, Landecker et al. 2000) as part of the Canadian Galactic Plane Survey (Taylor et al. 2003). Single antenna data are incorporated into the Stokes I synthesis maps to ensure accurate representation of all structures from the largest scales down to the resolution limit. The short spacing data and the DRAO ST observations are merged in Fourier space using a normalized tapering function in the overlap region. The low spatial frequency continuum data for the 408 MHz observations were derived from the Haslam All-Sky survey (Haslam et al. 1982). For the 1420 MHz Stokes I data, the 1.4 GHz Effelsberg survey (Reich et al. 1997) is used to augment the DRAO interferometer data. Where these data are not available, the missing spatial frequencies are derived from the 1.4 GHz Stockert 25 m Northern Sky Survey (Reich & Reich 1986; Reich 1982).
Low spatial frequency data for our linear polarization
observations at 1420 MHz are currently not available. The low spatial
frequency limit is determined by our shortest antenna spacing,
about 13 m. This corresponds to angular dimensions of about
![]() cosec (
cosec (![]() )
(
)
(![]() :
Declination of the
observation).
Hence, for SNRs larger than this in angular size we miss some of the
diffuse polarized emission. The angular resolution of
the final I, Q, and U data products varies slightly across the maps as
:
Declination of the
observation).
Hence, for SNRs larger than this in angular size we miss some of the
diffuse polarized emission. The angular resolution of
the final I, Q, and U data products varies slightly across the maps as
![]() cosec (
cosec (![]() )
and
)
and
![]() cosec (
cosec (![]() )
at 1420 MHz and 408 MHz,
respectively.
)
at 1420 MHz and 408 MHz,
respectively.
The CGPS data are released in the form of
![]() mosaics
(called "M'' mosaics), at all frequencies. The larger primary beam at 408 MHz provides a much larger sky coverage; hence at this frequency
mosaics
(called "M'' mosaics), at all frequencies. The larger primary beam at 408 MHz provides a much larger sky coverage; hence at this frequency
![]() mosaics ("C'' mosaics) are created in addition to
the M-mosaics. The CGPS is available to the community through the Canadian Astronomy
Data Centre (CADC
mosaics ("C'' mosaics) are created in addition to
the M-mosaics. The CGPS is available to the community through the Canadian Astronomy
Data Centre (CADC![]() ).
To make it easier to find each SNR in the CGPS data base we list
the designation code of the mosaics in which each SNR can be found in
Table 1. At the time of writing the low longitude mosaics
(
).
To make it easier to find each SNR in the CGPS data base we list
the designation code of the mosaics in which each SNR can be found in
Table 1. At the time of writing the low longitude mosaics
(
![]() )
are not yet available at 408 MHz. They will be released
before the end of May, 2006.
)
are not yet available at 408 MHz. They will be released
before the end of May, 2006.
Our sample of Galactic SNRs is mainly based on Green's Catalogue of
Galactic Supernova Remnants (Green 2004). We discuss all
SNRs that are covered by phase I and phase II of the CGPS
(
![]() and
and
![]() ).
This includes 35 Galactic supernova remnants and 11 possible SNRs.
).
This includes 35 Galactic supernova remnants and 11 possible SNRs.
Three of the 35 SNRs are excluded from the catalogue. Cas A is excluded from
CGPS observations for reasons of dynamic range, as discussed in Taylor et al. (2003).
The observations containing Cas A are exceptionally difficult to calibrate due
to the extreme brightness of this SNR. It is included in Green's catalogues of
Galactic supernova remnants (Green 2004), but its emission properties
will not be discussed further in this work. We will, however, include Cas A
in the forthcoming papers based on this SNR catalogue, which will focus on
distances and SNR statistics. The "Galactic SNR'' OA 184
(G166.2+2.5) has rather conclusively
been shown by Foster et al. (2006) to be a misidentified H II region, as it
lacks polarized emission and shines in recombination lines H103-110![]() ,
both observed at
,
both observed at ![]() 6 cm. It is hereafter to be excluded from this and
future catalogues of SNRs. G65.3+5.7 is a rather faint high latitude object
which is covered by CGPS 408 MHz measurements, but due to its low surface
brightness and the high noise in its vicinity, we were not able to detect this
source in our data.
6 cm. It is hereafter to be excluded from this and
future catalogues of SNRs. G65.3+5.7 is a rather faint high latitude object
which is covered by CGPS 408 MHz measurements, but due to its low surface
brightness and the high noise in its vicinity, we were not able to detect this
source in our data.
Additionally we investigated the nature of the 11 "possible'' SNRs listed in
Green (2004). For the following seven, results were inconclusive.
G71.6-0.5, G72.2-0.3, and G85.2-1.2 (Taylor et al. 1992) are confused with
background emission to an extent that a distinct flux density measurement
is difficult. G75.5+2.4 is suggested to be an SNR by Nichols-Bohlin & Fesen (1993) and is
quite visible in the 1420 MHz data, but is missing in our 408 MHz measurements.
This could be caused by a flat, thermal radio spectrum and/or confusion
with artifacts from nearby Cygnus A. At the positions of the candidates
G69.4+1.2 (Yoshita et al. 1999), G117.7+0.6 (Hailey & Craig 1995) and a possible remnant
at
![]() and
and
![]() (suggested by Mavromatakis et al. 2002) we find no
significant radio continuum emission at either 408 or 1420 MHz.
(suggested by Mavromatakis et al. 2002) we find no
significant radio continuum emission at either 408 or 1420 MHz.
Two of the 11 possible remnants are clearly thermal in origin. These are the SNR candidates G74.8+0.63 (Zhang 2003) and G104.7+2.8, published by Green & Joncas (1994). They have flat radio spectra between 408 and 1420 MHz and are also very bright infrared sources.
The following two "possible'' SNRs listed in Green's catalogue (Green 2004) were added to our SNR catalogue. G83.0-0.3, discovered by Taylor et al. (1992) has a distinctly non-thermal radio spectrum and no infrared counterpart. G107.5-1.5, discovered by Kothes (2003) in CGPS data is highly polarized at 1420 MHz (see Sect. 4 for more discussion on these sources).
We also made a literature search to find other SNRs in the CGPS area that might have been discovered since Green (2004) was published. We added two new SNRs discovered in the data of the CGPS (Kothes et al. 2005) to our sample. The only other SNR candidate we found in the literature was a possible remnant north-east of the SNR G116.5+1.1, suggested by Mavromatakis et al. (2005). However, this source was not detected in CGPS radio continuum data at either frequency, and is not included in the new SNR catalogue.
The final count in the CGPS SNR catalogue is 36 SNRs.
|
|
Before integrating the flux density of each SNR, point sources are removed by fitting elliptical gaussians to their radio continuum emission. At 408 MHz, where the beam area is more than 10 times larger than at 1420 MHz, the fitting procedure fails for some sources due to confusion with emission from the supernova remnant. In these cases we use the catalogue of Vollmer et al. (2005) to estimate the point source flux density at 408 MHz. All sources for which 408 MHz flux densities are determined this way are listed in Table 2. After the subtraction of the point source contribution, each SNR flux density is integrated by defining a polygon around the emission region. A twisted plane is fitted to this polygon's perimeter to determine the background contribution, which is then subtracted. The final flux density of each supernova remnant is tabulated in Table 3. This procedure was double checked by estimating a constant background from the area around the SNR. The errors in the listed flux densities consist mainly of the background uncertainty, with a contribution from a calibration error (3% and 6% at 1420 MHz and 408 MHz, respectively). The background uncertainty can be very high in areas of varying background emission like the Cygnus X region or for very faint supernova remnants where the fluctuations of the source are comparable to those in the background.
Since we merge the data observed with the DRAO ST together with
the low spatial
frequency observations in Fourier space it is usefull to
estimate the percentage of the SNR flux density that is actually derived
from the new DRAO ST observations. At 408 MHz the uv-data is merged using
a normalized tapering function between spatial dimensions of
![]() (
(
![]() cosec (
cosec (![]() )) and
)) and
![]() (
(
![]() cosec (
cosec (![]() )). Hence for at least 29 SNRs out of
our sample
the flux density is entirely based on the new DRAO ST observations.
For HB 9, the largest SNR in our sample (
)). Hence for at least 29 SNRs out of
our sample
the flux density is entirely based on the new DRAO ST observations.
For HB 9, the largest SNR in our sample (
![]() ),
the contribution to the flux from the Haslam
survey data is less than 30%. At 1420 MHz we apply the normalized tapering
function between
),
the contribution to the flux from the Haslam
survey data is less than 30%. At 1420 MHz we apply the normalized tapering
function between
![]() (
(
![]() cosec (
cosec (![]() )) and
)) and
![]() (
(
![]() cosec (
cosec (![]() )) for the Effelsberg survey and between
)) for the Effelsberg survey and between
![]() (
(
![]() cosec (
cosec (![]() )) and
)) and
![]() (
(
![]() cosec (
cosec (![]() )) for the Stockert survey. Hence, for
at least 15 SNRs the flux density is entirely derived from the
new DRAO ST observation.
For HB 9 the contribution of the Effelsberg survey is about 70%, for
VRO 42.01.05 (
)) for the Stockert survey. Hence, for
at least 15 SNRs the flux density is entirely derived from the
new DRAO ST observation.
For HB 9 the contribution of the Effelsberg survey is about 70%, for
VRO 42.01.05 (
![]() )
this number drops to less than 30%.
)
this number drops to less than 30%.
In Figs. 1 and 2-6 we display Stokes I images of all SNRs
within the bounds of the CGPS at 1420 MHz (
![]() ,
,
![]() )
and 408 MHz (
)
and 408 MHz (
![]() ,
,
![]() ). For G89.0+4.7 (HB 21) and G82.2+5.3 (W 63), two large high
latitude SNRs not fully covered by the CGPS at the higher frequency,
we include data from the archive
of the DRAO synthesis telescope to augment the 1420 MHz measurements.
For the SNRs
G93.3+6.9 (DA 530) and G156.2+5.7 (not observed in the CGPS
at 1420 MHz due to their
high latitude) we only provide 408 MHz images and flux density values. As the
field of view is more than ten times larger at 408 MHz than at 1420 MHz,
these two SNRs are covered at the lower frequency. The newly
determined centres of the emission regions
and the total angular dimensions of all the SNRs are listed in
Table 1, and flux densities at 408 and 1420 MHz
appear in Table 3. The values specified for the dimensions
are not the actual major and minor axes of the emission region, but
their maximum extents in
). For G89.0+4.7 (HB 21) and G82.2+5.3 (W 63), two large high
latitude SNRs not fully covered by the CGPS at the higher frequency,
we include data from the archive
of the DRAO synthesis telescope to augment the 1420 MHz measurements.
For the SNRs
G93.3+6.9 (DA 530) and G156.2+5.7 (not observed in the CGPS
at 1420 MHz due to their
high latitude) we only provide 408 MHz images and flux density values. As the
field of view is more than ten times larger at 408 MHz than at 1420 MHz,
these two SNRs are covered at the lower frequency. The newly
determined centres of the emission regions
and the total angular dimensions of all the SNRs are listed in
Table 1, and flux densities at 408 and 1420 MHz
appear in Table 3. The values specified for the dimensions
are not the actual major and minor axes of the emission region, but
their maximum extents in ![]() and b, which may include outbreaks,
etc. The centres of the SNRs were derived from these dimensions. Hence,
these are not the actual positions of the supernova explosions that lead
to the SNRs, but the centres of the currently observed emission. The error
in dimensions and positions for most SNRs is about
and b, which may include outbreaks,
etc. The centres of the SNRs were derived from these dimensions. Hence,
these are not the actual positions of the supernova explosions that lead
to the SNRs, but the centres of the currently observed emission. The error
in dimensions and positions for most SNRs is about
![]() .
.
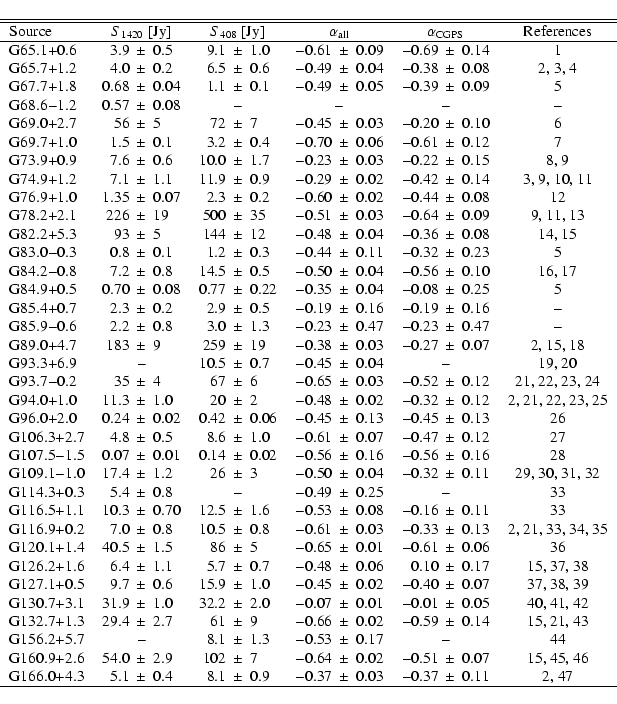
In Figs. 7 and 8 to 10 we display the radio continuum spectra
of 34 of our 36 SNRs. For the SNR G113.0+0.1 no reliable flux density
value is available, and for SNR G68.6-1.2 only a 1420 MHz measurement
can be determined. To more accurately define the spectra we searched the
literature for flux densities (which we judge to be reliable)
for many frequencies. It is to be noted that we did not add any other
flux densities determined with CGPS data by other authors to be
consistent with the method of flux determination. An error weighted
linear function is fitted to each log
![]() plot, and the final spectral
index
plot, and the final spectral
index
![]() is thus calculated. We also determine
is thus calculated. We also determine
![]() ,
calculated between the two CGPS flux densities only (listed in
Table 3). A number-frequency distribution of spectral index
values
,
calculated between the two CGPS flux densities only (listed in
Table 3). A number-frequency distribution of spectral index
values
![]() is displayed in Fig. 11.
is displayed in Fig. 11.
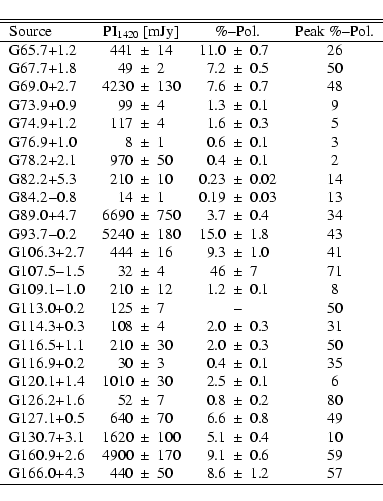
Out of the 36 supernova remnants in our catalogue 24 appear to
be polarized at 1420 MHz in the CGPS data. Polarized intensity
images of 18 of these SNRs are displayed in
Figs. 12 to 13. For the others, polarized emission
is too ill-defined to display in a figure. The polarized intensity PI
was calculated from the Stokes Q and U emission
via:
![]() .
The third term is a first order correction for noise bias
(Wardle & Kronberg 1974) and
.
The third term is a first order correction for noise bias
(Wardle & Kronberg 1974) and
![]() K is the rms noise in the Stokes Q and U images.
Integrated polarized intensities, percentage polarization, and
peak polarization for all SNRs that show significant related
polarized emission are listed in Table 4. All supernova
remnants should be intrinsically polarized up to 70%. However, at 1420 MHz polarized emission suffers significantly from beam
depolarization (caused by Faraday rotation). A rotation measure RM of only
K is the rms noise in the Stokes Q and U images.
Integrated polarized intensities, percentage polarization, and
peak polarization for all SNRs that show significant related
polarized emission are listed in Table 4. All supernova
remnants should be intrinsically polarized up to 70%. However, at 1420 MHz polarized emission suffers significantly from beam
depolarization (caused by Faraday rotation). A rotation measure RM of only ![]() 36 rad/m2 is required to rotate the polarization angle by
36 rad/m2 is required to rotate the polarization angle by ![]()
![]() ,
and two polarization angles perpendicular to
each other within one beam would cancel. It is quite remarkable
that we still detect linearly polarized emission from so many
supernova remnants even as far away as G67.7+1.8 (see individual
notes).
,
and two polarization angles perpendicular to
each other within one beam would cancel. It is quite remarkable
that we still detect linearly polarized emission from so many
supernova remnants even as far away as G67.7+1.8 (see individual
notes).
Supernova remnants are divided into three groups based on their
appearance and spectral properties. Shell-type supernova remnants are the
actual remains of the explosion and appear as highly linearly polarized limb
brightened shells of radio continuum emission. An adiabatically
expanding pure shell-type remnant is expected to have a non-thermal
radio spectrum with a spectral index ![]() of about
of about ![]() -0.5
(
-0.5
(
![]() ). Younger, freely expanding shell-type remnants, like
Tycho in our sample, have slightly steeper spectra, and when the remnant
becomes older and radiative, the spectrum might flatten. Pulsar wind nebulae,
also known as filled-centre, crab-like, or plerion-type SNRs, are produced
by a rapidly spinning pulsar in their centre that releases a wind of particles and
magnetic field in its surroundings. They
have flat radio spectra
with indices between 0.0 and -0.3, which is similar to optically
thin thermal emission like that observed from H II regions.
The non-thermal emission coming from pulsar wind nebulae
can be identified because this emission is highly
linearly polarized. The third group are the so-called combined
type SNRs which contain both, a shell-type remnant and a pulsar
wind nebula.
). Younger, freely expanding shell-type remnants, like
Tycho in our sample, have slightly steeper spectra, and when the remnant
becomes older and radiative, the spectrum might flatten. Pulsar wind nebulae,
also known as filled-centre, crab-like, or plerion-type SNRs, are produced
by a rapidly spinning pulsar in their centre that releases a wind of particles and
magnetic field in its surroundings. They
have flat radio spectra
with indices between 0.0 and -0.3, which is similar to optically
thin thermal emission like that observed from H II regions.
The non-thermal emission coming from pulsar wind nebulae
can be identified because this emission is highly
linearly polarized. The third group are the so-called combined
type SNRs which contain both, a shell-type remnant and a pulsar
wind nebula.
There are 36 supernova remnants listed in our catalogue. Out of these 28 objects are considered to be pure shell-type remnants, 4 are believed to be pure pulsar wind nebulae (PWNe), 2 objects contain both, and another 2 are unknown (see Green 2004). These numbers are reflected in the histogram displayed in Fig. 11, which shows a peak at a spectral index of -0.5 indicating that most of the remnants discussed in our catalogue are adiabatically expanding shell-type SNRs. This is not to say that most SNRs in the first and second quadrant are in this intermediate phase of their evolution; rather, we believe that a Malmquist-type bias is at work. The adiabatic phase marks where the shock is most efficiently interacting with swept-up material, and where emission of synchrotron radiation is significant. This causes a predilection whereby more mature adiabatic remnants are detected in radio emission than very old ones.
G65.1+0.6 is a very faint object of large angular extent (see Fig. 1). It consists of two shells on top of diffuse emission, with the southern shell more pronounced than the northern. Its steep radio spectrum (Fig. 7) would indicate a rather young shell-type remnant. Since it appears to be very diffuse without a sharp outer edge it is possible that the remnant is expanding inside a void in the H I, probably a stellar wind bubble, or just a very low density environment. This way it could be of high age, still showing the characteristics of a young almost freely expanding shell-type SNR. We did not detect any polarized emission from this object, which is likely the result of its low signal-to-noise ratio.
DA 495 is believed to be a pulsar wind nebula (Landecker & Caswell 1983) even though its spectrum is unusually steep for such an object (see Figs. 1 and 7). We found this supernova remnant to be a bit larger than the first impression would predict. While the area of detectable radio continuum emission in shell-type supernova remnants is known to have a very sharp edge outside the shock wave, PWNe fade away slowly with larger radii. This is certainly the case for DA 495 since it seems to sit on a diffuse emission plateau which is a bit larger than its bright radio continuum emission listed in Table 1. Since this diffuse emission is most likely included in published flux densities (especially those observed with low resolution) we included it in our measurements listed in Table 3 as well. Point source contribution to the total flux density could be significant for this object especially at the lower frequencies, so that our spectral index should be a lower limit. DA 495 is highly polarized (see Fig. 12), probably the result of a short distance and low internal depolarization.
G67.7+1.8 has a typical double shell structure and belongs to the class of
the so-called barrel-shaped SNRs (see Fig. 1).
As already noted by Taylor et al. (1992) the bright point source located on
the northern shell of G67.7+1.8 is most likely of extragalactic origin.
We used catalogued flux densities of this source to calculate its flux
at 408 MHz and subtracted it from our integrated flux value for the
SNR (see Table 2). We also calculate its flux at 327 MHz to subtract
it from the
SNR's integrated flux density published by Taylor et al. (1992) before calculating
the spectrum in Fig. 7. Our two new flux density values confirm
G67.7+1.8's nature as a shell-type supernova remnant. A spectral index
of
![]() (Fig. 7) indicates a mature adiabatically
expanding SNR. We detect a high degree of linear polarization
from the southern shell of this object, while the northern shell seems
to be unpolarized (see Fig. 12).
(Fig. 7) indicates a mature adiabatically
expanding SNR. We detect a high degree of linear polarization
from the southern shell of this object, while the northern shell seems
to be unpolarized (see Fig. 12).
G68.6-1.2 was identified as a supernova remnant by Reich et al. (1988) because of its linearly polarized radio continuum emission at 2695 MHz. The image displayed in Fig. 1 is the first one to be published of this illusive object. It is a very diffuse almost circular SNR with a smooth shell-like feature to the west. Unfortunately, we are not able to determine any spectral information, since our 1420 MHz value is the only reliable flux density available. With this information alone we cannot tell whether this object is a pulsar wind nebula or a shell-type SNR; however, its appearance would certainly point to the latter. At 408 MHz the signal-to-noise ratio of this object is too low for a clear detection and we did not detect any significant polarized emission at 1420 MHz, probably the result of the low signal-to-noise ratio.
CTB 80 is a very complex object of large angular size (see Fig. 1). It is rather difficult to determine a reliable value for its dimensions. Especially to the south it contains many diffuse filaments, which may not be included in all published flux density values especially those with low sensitivity and/or low resolution. To the south the remnant also seems to slowly fade away overlapping with diffuse thermal emission which makes it virtually impossible to determine its edge in that direction. The difficulty in determining its true extent is also reflected in the large scatter in its radio continuum spectrum (see Fig. 7). The overall spectrum is typical of an adiabatic shell-type remnant. CTB 80 is believed to be a combined type supernova remnant consisting of (a) shell-type remnant(s) and a pulsar wind nebula. CTB 80 is highly polarized at 1420 MHz (see Fig. 12). Prominent in the north-east is linearly polarized emission that seems to extend beyond the total power emission, indicating that the actual SNR is even larger than it appears in the continuum.
The supernova remnant G69.7+1.0 heretofore has had
only poorly determined characteristics.
Our 1420 MHz observation is the first detailed image available for
this SNR (see Fig. 1). The remnant is almost circular and of small
angular size,
with a bright shell to the north-west. The spectral index of
![]() (see Fig. 7) is rather steep and indicates
a relatively young object. G69.7+1.0 is unpolarized in our 1420 MHz
data, indicating
a large distance resulting in high beam depolarization and/or strong
internal effects.
(see Fig. 7) is rather steep and indicates
a relatively young object. G69.7+1.0 is unpolarized in our 1420 MHz
data, indicating
a large distance resulting in high beam depolarization and/or strong
internal effects.
The supernova remnant G73.9+0.9 is a rather diffuse object in our
1420 MHz maps (see Fig. 2). It is considered to be
a shell-type remnant and consists of a shell-like feature
to the west with a sharp outer boundary and a centrally peaked
nebula to the east of it. The spectrum is very flat with
![]() (see Fig. 7). A possible explanation is that the
feature in the
centre of the source is a pulsar wind nebula. In this case G73.9+0.9
would be a combined-type SNR. A comparison of our 1420 MHz data
with the 408 MHz observations does not reveal any new information,
because the resolution at 408 MHz is not sufficient. The bright
unresolved source at the northern edge of the remnant and the bright
source on top of the northern tip of the shell were considered
unrelated background sources and were subtracted. There seems to be
faint polarization in our data at the position of this SNR
(see Fig. 12), but
a correlation is difficult to confirm.
(see Fig. 7). A possible explanation is that the
feature in the
centre of the source is a pulsar wind nebula. In this case G73.9+0.9
would be a combined-type SNR. A comparison of our 1420 MHz data
with the 408 MHz observations does not reveal any new information,
because the resolution at 408 MHz is not sufficient. The bright
unresolved source at the northern edge of the remnant and the bright
source on top of the northern tip of the shell were considered
unrelated background sources and were subtracted. There seems to be
faint polarization in our data at the position of this SNR
(see Fig. 12), but
a correlation is difficult to confirm.
![\begin{figure}
\includegraphics[bb = 55 45 540 510,width=8.5cm,clip]{histo.ps} \end{figure}](/articles/aa/full/2006/39/aa5062-06/img55.gif) |
Figure 11:
Distribution of the spectral index
|
CTB 87 consists of a bright kidney shaped central part sitting on diffuse
extended emission (see Fig. 2) and is considered to be a pulsar
wind nebula. Our flux
measurements confirm the flat radio spectrum of this source
with a spectral index of
![]() (see Fig. 7).
We do detect faint linear polarization from this
object (see Fig. 12).
The integrated percentage polarization of 1.7% and the peak
polarization of 5% are rather low and likely only detectable because
CTB 87 is extremely bright. The detected polarization
cannot be instrumental, since there is a
depolarization canal going right through the centre of it, indicating
a beam depolarization effect while instrumental polarization would be
very smooth, showing the same structure as the total power emission.
(see Fig. 7).
We do detect faint linear polarization from this
object (see Fig. 12).
The integrated percentage polarization of 1.7% and the peak
polarization of 5% are rather low and likely only detectable because
CTB 87 is extremely bright. The detected polarization
cannot be instrumental, since there is a
depolarization canal going right through the centre of it, indicating
a beam depolarization effect while instrumental polarization would be
very smooth, showing the same structure as the total power emission.
G76.9+1.0 (see Fig. 2) is believed to be a pure pulsar wind nebula even though its radio spectrum (see Fig. 7) is rather steep for such an object (Landecker et al. 1993). This makes it very similar to DA 495. Like this PWN it has no sharp outer boundary, but the emission seems to fade away slowly with larger radius. In our 1420 MHz data this source is only weakly polarized (see Fig. 12), probably the result of a large distance and/or confusion with the complex and very bright Cygnus X region.
![]() Cygni is a very bright almost circular supernova remnant
with a rather complex substructure (see Fig. 2). Its overall
radio spectrum with a spectral index of
Cygni is a very bright almost circular supernova remnant
with a rather complex substructure (see Fig. 2). Its overall
radio spectrum with a spectral index of
![]() (see Fig. 7) and the shell-like - almost barrel-shape -
appearance classifies it as a typical adiabatically expanding
shell-type SNR. We
do detect faint polarized emission from the SNR but most of it seems to be
instrumental, since the total power emission is very bright. But
there might be some faint genuine emission coming from the
southern shell with a peak polarization of about 2%
(see Table 4).
(see Fig. 7) and the shell-like - almost barrel-shape -
appearance classifies it as a typical adiabatically expanding
shell-type SNR. We
do detect faint polarized emission from the SNR but most of it seems to be
instrumental, since the total power emission is very bright. But
there might be some faint genuine emission coming from the
southern shell with a peak polarization of about 2%
(see Table 4).
W 63 is a very large nearby high latitude supernova remnant, which is
considered to be of shell-type (Fig. 2). It is difficult to
determine its true extent, because it is not clear which of the
filaments surrounding the main source actually belongs to the SNR.
This fact is reflected in the large scatter in its overall radio
spectrum (Fig. 8). The spectral index of -0.48 and its nicely
limb-brightened structure indicate that it is
a pure shell-type remnant. There is almost
no significant linearly polarized emission detected in the CGPS
(see Table 4). However,
since this SNR is located at a high Galactic Latitude, with an
angular extent of almost
![]() it is reasonable to assume that it does
not suffer much from foreground beam depolarization. Thus the polarized
emission might be rather smooth, which could be impossible to detect with
our synthesis telescope due to missing low spatial frequency data.
it is reasonable to assume that it does
not suffer much from foreground beam depolarization. Thus the polarized
emission might be rather smooth, which could be impossible to detect with
our synthesis telescope due to missing low spatial frequency data.
|
G83.0-0.3 is listed by Green (2004) as a possible SNR originally reported by Taylor et al. (1992). No study since then has confirmed its non-thermal nature. It has the structure of a shell of small angular size (Fig. 2). It lies within the confusing and highly structured background of Cygnus X, and sits atop a filament of thermal continuum emission. A single, flat-spectrum point source is within the remnant's boundary, and after removing its flux, we integrated 408, 1420, and 2695 MHz (11 cm Effelsberg Survey, Fürst et al. 1990) data and used the point source corrected 327 MHz value from Taylor et al. (1992) to confirm a non-thermal spectrum for G83.0-0.3 (Fig. 8). Taylor et al. (1992) measured a flux at 4850 MHz from the Green Bank survey (Condon et al. 1989). However, in these data we find that the aforementioned thermal background dominates, and one cannot extract a reasonable flux for the SNR alone due to the low resolution of the data.
G84.2-0.8 appears to be a compact, elliptical shell-type structure, with the
elongated axis (
![]() )
aligned with Galactic longitude (Fig. 3).
No significant polarized emission is detected (see Table 4)
indicating that W 80 is likely acting as a foreground screen.
Its spectrum with a spectral index of
)
aligned with Galactic longitude (Fig. 3).
No significant polarized emission is detected (see Table 4)
indicating that W 80 is likely acting as a foreground screen.
Its spectrum with a spectral index of
![]() (Fig. 8)
confirms its nature as an adiabatically expanding shell-type SNR.
(Fig. 8)
confirms its nature as an adiabatically expanding shell-type SNR.
G85.4+0.7 is a supernova remnant that was discovered in the data of the CGPS (Kothes et al. 2001). It is an unusually looking shell-type SNR with two distinctly visible shells on one side and maybe some diffuse emission patches on the other (Fig. 3). The inner shell is believed to be non-thermal and the outer thermal (Kothes et al. 2001), which might be reflected in its rather flat radio spectrum (Fig. 8). The CGPS data do not reveal any detected polarized emission, likely due to confusion with emission from the radio source W 80.
G85.9-0.6 (Fig. 3) like G85.4+0.7 was discovered in the
data of the CGPS (Kothes et al. 2001).
It is considered to be a pure shell-type
remnant, consisting of a faint arc of diameter ![]()
![]() centered
at
centered
at
![]() and
and
![]() to the west. The SNR's
emission is confused by a bright extragalactic point source in the middle
of the arc and diffuse
emission from the W 80 region. It is quite difficult
to separate its emission from the bright background which is
reflected in the high uncertainty in its radio spectrum
(Fig. 8). We did not detect any significant polarized emission
in the CGPS data, perhaps due to confusion with the radio source W 80.
to the west. The SNR's
emission is confused by a bright extragalactic point source in the middle
of the arc and diffuse
emission from the W 80 region. It is quite difficult
to separate its emission from the bright background which is
reflected in the high uncertainty in its radio spectrum
(Fig. 8). We did not detect any significant polarized emission
in the CGPS data, perhaps due to confusion with the radio source W 80.
HB 21 is a nearby, large (
![]() )
intricately detailed
SNR in CGPS images (Fig. 3). With all background sources removed, the
spectrum is somewhat flat (Fig. 8), suggesting that much of the
radio remnant shows portions evolving through the later stages of the Sedov
phase, or early into the radiative (where a significant amount
of the shock energy is being
radiated away). The SNR shell has sharp boundaries as seen in the 1420 MHz
image (Fig. 3), and shows bright polarized emission (Fig. 12)
with an average 4% percentage polarization (peak of 34%, see Table 4).
We likely underestimate the total polarized emission due to missing
short spacings.
)
intricately detailed
SNR in CGPS images (Fig. 3). With all background sources removed, the
spectrum is somewhat flat (Fig. 8), suggesting that much of the
radio remnant shows portions evolving through the later stages of the Sedov
phase, or early into the radiative (where a significant amount
of the shock energy is being
radiated away). The SNR shell has sharp boundaries as seen in the 1420 MHz
image (Fig. 3), and shows bright polarized emission (Fig. 12)
with an average 4% percentage polarization (peak of 34%, see Table 4).
We likely underestimate the total polarized emission due to missing
short spacings.
DA 530 is considered to be the picture book example of a typical
adiabatically expanding shell-type
supernova remnant. In the CGPS this is reflected in its nice double shell structure
(Fig. 3) and its radio spectrum with a spectral index of
![]() (Fig. 8). Since the 1420 MHz data
only covers the Galactic plane up to a latitude of
(Fig. 8). Since the 1420 MHz data
only covers the Galactic plane up to a latitude of
![]() we have no 1420 MHz observations. The position of its centre
and its dimension (Table 1)
were determined from our 408 MHz data.
we have no 1420 MHz observations. The position of its centre
and its dimension (Table 1)
were determined from our 408 MHz data.
CTB 104A is considered to be a pure shell-type SNR. This SNR has already been studied based on CGPS radio continuum and H I data by Uyaniker et al. (2002). It has a rather thick shell (Fig. 4) with no sharp outer boundary and a few smooth extensions to the north and to the south. This might explain the large scatter in its radio continuum spectrum (Fig. 8). CTB 104A is highly polarized in the CGPS data (Fig. 12). Because of its large angular size the total polarized emission listed in Table 4 is likely a lower limit due to missing short spacings.
This Perseus arm object has already been studied extensively
based on CGPS radio continuum (Foster 2005) data, and is a
textbook example of an SNR evolving within a stellar
wind bubble. The SNR is expanding freely in a westerly direction into the
bubble's interior, but the shock's energy is being thermalized where it
has impacted the inside wall of the SWB (eastern half of 3C 434.1,
see Fig. 4). Its overall radio spectrum has an index
![]() (Fig. 9), typical of an mature shell-type remnant.
No 1420 MHz polarized emission is observed in the CGPS.
(Fig. 9), typical of an mature shell-type remnant.
No 1420 MHz polarized emission is observed in the CGPS.
G96.0+2.0 was discovered in the data of the Canadian
Galactic Plane Survey (Kothes et al. 2005) and is believed to be
a pure shell-type remnant expanding inside a stellar
wind bubble. It consists of a shell to the west and
diffuse emission slowly fading away to the east (Fig. 4).
The SNR has a typical radio spectrum with an index
of
![]() (Fig. 9) indicating an adiabatically
expanding shell-type
SNR. Like 3C 434.1, it is unpolarized in the CGPS data, likely the result of a
large distance, and perhaps internal effects.
(Fig. 9) indicating an adiabatically
expanding shell-type
SNR. Like 3C 434.1, it is unpolarized in the CGPS data, likely the result of a
large distance, and perhaps internal effects.
A previous study based on CGPS data (Kothes et al. 2001) found that the
combined type supernova remnant G106.3+2.7 consists
of a diffuse shell-type remnant breaking out to the west into the
interior of a stellar wind bubble and a small pulsar wind nebula
sitting at the top of a somewhat brighter head structure to
the east (Fig. 4). Its radio spectrum with
![]() (Fig. 9) is somewhat steep, especially considering that
this remnant contains a PWN, which have flatter spectra; however,
the shell-type remnant is certainly the dominating source of the
radio continuum emission and the breakout into the interior of
the stellar wind bubble might give the remnant characteristics of
an early stage of evolution. G106.3+2.7 is highly polarized in
the 1420 MHz CGPS data (Fig. 12).
(Fig. 9) is somewhat steep, especially considering that
this remnant contains a PWN, which have flatter spectra; however,
the shell-type remnant is certainly the dominating source of the
radio continuum emission and the breakout into the interior of
the stellar wind bubble might give the remnant characteristics of
an early stage of evolution. G106.3+2.7 is highly polarized in
the 1420 MHz CGPS data (Fig. 12).
G107.5-1.5 was discovered with data from the Canadian Galactic Plane
Survey (Kothes 2003). It consists of a short narrow shell-like feature
(Fig. 4). Its shape and radio spectrum with an
index of
![]() (Fig. 9) suggest an adiabatically
expanding shell-type SNR. G107.5-1.5 is with 50% integrated polarization
the source with the highest percentage polarization in the whole CGPS
(Fig. 13). This is likely the result of low foreground depolarization.
(Fig. 9) suggest an adiabatically
expanding shell-type SNR. G107.5-1.5 is with 50% integrated polarization
the source with the highest percentage polarization in the whole CGPS
(Fig. 13). This is likely the result of low foreground depolarization.
The SNR CTB 109 was identified as an SNR by Gregory & Fahlman (1980) on the basis
of X-ray data observed with the
Einstein Satellite. In the CGPS the SNR has a peculiar semi-circular
shape (Fig. 4) and its
radio spectrum has an index of
![]() (Fig. 9), typical
for a mature shell-type SNR. There is weak
polarization coming from this SNR (Fig. 13), but curiously it is
confined to the area below about
(Fig. 9), typical
for a mature shell-type SNR. There is weak
polarization coming from this SNR (Fig. 13), but curiously it is
confined to the area below about
![]() of Galactic Latitude, probably
the result of depolarization by a foreground cloud of ionized gas that is
partly overlapping with the SNR.
of Galactic Latitude, probably
the result of depolarization by a foreground cloud of ionized gas that is
partly overlapping with the SNR.
G113.0+0.2 was discovered as an SNR with data from the CGPS (Kothes et al. 2005). It is highly linearly polarized at 1420 MHz (see Fig. 13), and has an unusual elongated appearance consisting of a long polarized filament and a complex head structure (Fig. 5), that is interacting with a small molecular cloud. Due to confusion with background emission no reliable flux density can be extracted at 1420 MHz. At 408 MHz, image artifacts from nearby SNR Cas A cause additional problems.
The SNR G114.3+0.3 consists of a thin shell to the west with a
sharp outer boundary sitting on top of diffuse emission (Fig. 5).
The image quality at 408 MHz is very poor due to artifacts from
nearby SNR Cas A so that we could not publish a reliable flux density
at that frequency.
This SNR has been studied in detail with data from the CGPS by Yar-Uyaniker et al. (2004)
and Tian & Leahy (2006b). Its shell-like appearance and radio
spectrum (
![]() ,
Fig. 9) suggests it is an adiabatically
expanding shell-type SNR. The SNR is only weakly polarized in our data
(Table 4), which
could be the result of its very low surface brightness in total power.
,
Fig. 9) suggests it is an adiabatically
expanding shell-type SNR. The SNR is only weakly polarized in our data
(Table 4), which
could be the result of its very low surface brightness in total power.
The SNR G116.5+1.1 appears as a thick shelled SNR in our 1420 MHz
data (Fig. 5). It has the typical radio spectrum of an
adiabatically expanding shell-type SNR, with
![]() (Fig. 9). This SNR has been studied in detail with data from the
CGPS by Yar-Uyaniker et al. (2004) and Tian & Leahy (2006b). The
SNR is weakly polarized in our 1420 MHz data (Fig. 13).
(Fig. 9). This SNR has been studied in detail with data from the
CGPS by Yar-Uyaniker et al. (2004) and Tian & Leahy (2006b). The
SNR is weakly polarized in our 1420 MHz data (Fig. 13).
CTB 1 is a well studied shell-type supernova remnant.
In our 1420 MHz image (Fig. 5) it consists of two well defined
shells to the
west and the south-east and an opening to the north-east.
The radio spectrum with
a spectral index of
![]() (Fig. 9)
is somewhat steep for a typical
adiabatically expanding shell-type SNR. The integrated percentage
polarization is with 0.5% extremely low (Table 4). The
reason for this is still unclear, but could be the result of strong
internal effects. This SNR has been studied with data from the
CGPS by Yar-Uyaniker et al. (2004) and Tian & Leahy (2006b).
(Fig. 9)
is somewhat steep for a typical
adiabatically expanding shell-type SNR. The integrated percentage
polarization is with 0.5% extremely low (Table 4). The
reason for this is still unclear, but could be the result of strong
internal effects. This SNR has been studied with data from the
CGPS by Yar-Uyaniker et al. (2004) and Tian & Leahy (2006b).
The remnant of Tycho's SN
is a circular ring of 10.8
![]() diameter in the CGPS 1420 MHz images (Fig. 5), of total flux density
diameter in the CGPS 1420 MHz images (Fig. 5), of total flux density
![]() Jy. It is the only proven remnant of a
type Ia SN in the CGPS area. Its spectrum (Fig. 9)
declines very constantly at higher
frequencies, with
Jy. It is the only proven remnant of a
type Ia SN in the CGPS area. Its spectrum (Fig. 9)
declines very constantly at higher
frequencies, with
![]() (-0.61 between CGPS flux points),
typical for a young shell-type SNR in the pre-adiabatic expansion phase.
Tycho is 2.5% polarized at 1420 MHz
(Fig. 13, Table 4).
(-0.61 between CGPS flux points),
typical for a young shell-type SNR in the pre-adiabatic expansion phase.
Tycho is 2.5% polarized at 1420 MHz
(Fig. 13, Table 4).
G126.2+1.6 has been studied with radio continuum data from the
CGPS by Tian & Leahy (2006a).
It is a large (
![]() )
very diffuse remnant in the
CGPS, resolved into fragmented filaments at 1420 MHz (Fig. 5), and nearly
impossible to determine
a reliable 408 MHz flux density for. This is likely the reason why our 408 MHz flux density differs significantly from the one published by
Tian & Leahy (2006a), which is based on the same data. The continuum appearance
has a sharp shell
boundary, especially in the West. A brightened (0.4 K above the mean background
in the remnant's interior), diffuse circular patch of emission about 7
)
very diffuse remnant in the
CGPS, resolved into fragmented filaments at 1420 MHz (Fig. 5), and nearly
impossible to determine
a reliable 408 MHz flux density for. This is likely the reason why our 408 MHz flux density differs significantly from the one published by
Tian & Leahy (2006a), which is based on the same data. The continuum appearance
has a sharp shell
boundary, especially in the West. A brightened (0.4 K above the mean background
in the remnant's interior), diffuse circular patch of emission about 7
![]() in radius is found at the remnant's centre. It may suggest the presence of a
pulsar-wind nebula, but clearly more observations are needed to confirm this
speculation. Over the entire SNR, emission is weakly polarized (0.8%), but one
dim continuum filament in the west (
in radius is found at the remnant's centre. It may suggest the presence of a
pulsar-wind nebula, but clearly more observations are needed to confirm this
speculation. Over the entire SNR, emission is weakly polarized (0.8%), but one
dim continuum filament in the west (
![]() ,
,
![]() )
is
remarkably 80% polarized (Table 4).
)
is
remarkably 80% polarized (Table 4).
G127.1+0.5 is a very apparent shell-type SNR at 1420 MHz, much like G116.9+0.2 in
appearance (Fig. 6). A bright (80 K peak at 1420 MHz) extra-galactic source also
sits in the bull's-eye of the SNR. The SNR's spectrum is fairly well defined by 10 flux density points (see Fig. 10), and the gradient
![]() is typical of shell-type supernova remnants. The 1420 MHz emission
from G127.1+0.5 is 6.6% polarized, peaking at 49% (Fig. 13).
is typical of shell-type supernova remnants. The 1420 MHz emission
from G127.1+0.5 is 6.6% polarized, peaking at 49% (Fig. 13).
This remnant originates with SN 1181, and is a flat-spectrum (
![]() ,
see Fig. 10) and strongly polarized (5.1% integrated) pulsar
wind nebula
(Fig. 13). In 1420 MHz CGPS data,
3C 58 is a rather featureless, filled-centre source elongated along Galactic
longitude (
,
see Fig. 10) and strongly polarized (5.1% integrated) pulsar
wind nebula
(Fig. 13). In 1420 MHz CGPS data,
3C 58 is a rather featureless, filled-centre source elongated along Galactic
longitude (
![]() )
(Fig. 6).
)
(Fig. 6).
HB 3 has been studied with radio continuum data from the
CGPS by Tian & Leahy (2005). Although this shell-type SNR is partially
confused by thermal emission from W3 (Fig. 6), it has a
quite straight and steep spectrum with
![]() (Fig. 10).
It is not visible in polarized emission probably the result of the
confusion with W 3. The dimensions determined here (Table 1)
show that HB 3 is one of the largest SNRs in our sample and thus presumably
of quite an advanced age. The steepness of
its radio spectrum (Fig. 10) is remarkable for an advanced remnant.
(Fig. 10).
It is not visible in polarized emission probably the result of the
confusion with W 3. The dimensions determined here (Table 1)
show that HB 3 is one of the largest SNRs in our sample and thus presumably
of quite an advanced age. The steepness of
its radio spectrum (Fig. 10) is remarkable for an advanced remnant.
G156.2+5.7 is a quite unique object since it is in X-rays one of
the brightest SNRs known; it was discovered in the ROSAT all-sky
survey (Pfeffermann et al. 1991). However, it is the SNR with the lowest
radio surface brightness observed to date (Reich et al. 1992).
This is the reason why we had to remove the point sources and then
convolve the 408 MHz image to
![]() to make the remnant apparent
(Fig. 6). Our 408 MHz flux density nicely confirms its non-thermal radio
spectrum with a spectral index of
to make the remnant apparent
(Fig. 6). Our 408 MHz flux density nicely confirms its non-thermal radio
spectrum with a spectral index of
![]() (Fig. 10),
typical for
an adiabatically expanding shell-type SNR. Since the 1420 MHz data
only covers the Galactic plane up to a latitude of
(Fig. 10),
typical for
an adiabatically expanding shell-type SNR. Since the 1420 MHz data
only covers the Galactic plane up to a latitude of
![]() we have no 1420 MHz observations. The position of its centre
and its dimension (Table 1) were determined
from our 408 MHz data.
we have no 1420 MHz observations. The position of its centre
and its dimension (Table 1) were determined
from our 408 MHz data.
This anticentre SNR joins HB 3 as enigmatic, with its large extent on the sky
(
![]() )
and steep radio spectrum (
)
and steep radio spectrum (
![]() ). By excluding point sources, we obtain
). By excluding point sources, we obtain
![]() between 408 and 1420 MHz, somewhat flatter than the multi-wavelength spectrum in Fig. 10 (where most fluxes include background sources). The continuum
appearance is that of a multitude of fragmented shells overlapping one another
(Fig. 6). It does
seem clear that this is a very large, evolved remnant, which is
probably cooling rapidly due to radiative losses
(e.g. the optical emission). A high degree of linear polarization
(9% at 1420 MHz) is seen
for the whole remnant, peaking at 59% (Fig. 13).
The polarized emission is mainly
confined to the outer filaments where continuum emission is strongest.
between 408 and 1420 MHz, somewhat flatter than the multi-wavelength spectrum in Fig. 10 (where most fluxes include background sources). The continuum
appearance is that of a multitude of fragmented shells overlapping one another
(Fig. 6). It does
seem clear that this is a very large, evolved remnant, which is
probably cooling rapidly due to radiative losses
(e.g. the optical emission). A high degree of linear polarization
(9% at 1420 MHz) is seen
for the whole remnant, peaking at 59% (Fig. 13).
The polarized emission is mainly
confined to the outer filaments where continuum emission is strongest.
VRO 42.05.01 is an unusually-shaped SNR, showing two shells of strikingly
different radii. The
1420 MHz image (see Fig. 6) gives the appearance of a remnant evolving
into two media of unequal density. We find the entire remnant has an integrated
spectral index of
![]() (Fig. 10). Leahy & Tian (2005)
find based on CGPS data that the northern "shell region'' has
(Fig. 10). Leahy & Tian (2005)
find based on CGPS data that the northern "shell region'' has
![]() ,
while the
southern "wing region'' has
,
while the
southern "wing region'' has
![]()
![]() , also suggestive that two different media are
modifying the shock. This SNR is quite polarized, showing 8.6% linearly
polarized emission (more so in the "wing''region), peaking at 57%
(Fig. 13).
, also suggestive that two different media are
modifying the shock. This SNR is quite polarized, showing 8.6% linearly
polarized emission (more so in the "wing''region), peaking at 57%
(Fig. 13).
This catalogue presents radio continuum and polarization properties of all
known supernova remnants observed in the CGPS (65
![]() ,
-5
,
-5
![]() ). Our sample was initially taken
from the SNR catalogue of Green (2004). We have amended this sample somewhat
to include two new confirmed SNRs (G83.0-0.3, G107.5-1.5). Additionally,
nine other SNRs listed by Green (2004) as "possible'' were investigated.
G71.6-0.5, G72.2-0.3, and G85.2-1.2 (Taylor et al. 1992), as well as
G75.5+2.4 are inconclusive with the current observations. G104.7+2.8 and
G74.8+0.63 have measured thermal radio spectra, and are most likely H II regions. Three possibilities (G69.4+1.2, G70.0+2.0 and G117.7+0.6)
simply do not appear in CGPS images. Finally, the newly discovered H II region OA 184 (Foster et al. 2006) is not included in our list.
). Our sample was initially taken
from the SNR catalogue of Green (2004). We have amended this sample somewhat
to include two new confirmed SNRs (G83.0-0.3, G107.5-1.5). Additionally,
nine other SNRs listed by Green (2004) as "possible'' were investigated.
G71.6-0.5, G72.2-0.3, and G85.2-1.2 (Taylor et al. 1992), as well as
G75.5+2.4 are inconclusive with the current observations. G104.7+2.8 and
G74.8+0.63 have measured thermal radio spectra, and are most likely H II regions. Three possibilities (G69.4+1.2, G70.0+2.0 and G117.7+0.6)
simply do not appear in CGPS images. Finally, the newly discovered H II region OA 184 (Foster et al. 2006) is not included in our list.
Flux densities, spectral indices and fractional polarization are measured for all SNRs that remained. The current list consists of 36 SNRs, and is reasonably "complete'' in the sense that all SNRs known and discovered at the time of this writing (February 2006) and within the bounds of the CGPS are presented. Certainly, the current sample does not represent the total population of remnants in the CGPS region, due to limitations in the survey's sensitivity. As well, at least three unconfirmed new candidates remain in the CGPS (as suspected by the authors), but are not yet presentable at the time of this writing.
This catalogue is useful as a reference for SNRs, and will provide a comprehensive starting point for the researcher wishing to study individual or group statistics of SNRs within the CGPS region. To this end, we give mosaic designations for CGPS data (Table 1; FITS files for each can be obtained from the CADC at http://cadc-ccda.hia-iha.nrc-cnrc.gc.ca/cgps.
Acknowledgements
We wish to thank Dave Routledge (University of Alberta) for careful reading of the manuscript. We also wish to thank the anonymous referee for comments which improved this paper. The Dominion Radio Astrophysical Observatory is a National Facility operated by the National Research Council. The Canadian Galactic Plane Survey is a Canadian project with international partners, and is supported by the Natural Sciences and Engineering Research Council (NSERC).
![\begin{figure}
\mbox{ \includegraphics[bb = 40 150 560 600,width=5.5cm,clip]{g6...
...ludegraphics[bb = 42 52 565 507,width=5.5cm,clip]{g69.7.c74.ps} }
\end{figure}](/articles/aa/full/2006/39/aa5062-06/img41.gif)
![\begin{figure}
{\includegraphics[bb = 10 10 1635 1285,height=13cm,clip]{spec1.ps} }
\end{figure}](/articles/aa/full/2006/39/aa5062-06/img50.gif)
![\begin{figure}
\mbox{\includegraphics[bb = 42 55 575 510,width=5.5cm,clip]{pi65...
...\includegraphics[bb = 42 55 575 510,width=5.5cm,clip]{pi106.3.ps} }
\end{figure}](/articles/aa/full/2006/39/aa5062-06/img59.gif)
![\begin{figure}
\mbox{\includegraphics[bb = 42 55 575 510,width=5.5cm,clip]{pi10...
...\includegraphics[bb = 42 55 575 510,width=5.5cm,clip]{pi166.0.ps} }
\end{figure}](/articles/aa/full/2006/39/aa5062-06/img60.gif)
![\begin{figure}
\mbox{\includegraphics[bb = 40 150 560 600,width=5.5cm,clip]{g73...
...cludegraphics[bb = 42 52 565 507,width=5.5cm,clip]{g83.0.c74.ps} }
\end{figure}](/articles/aa/full/2006/39/aa5062-06/img97.gif)
![\begin{figure}
\mbox{\includegraphics[bb = 42 52 565 507,width=5.5cm,clip]{g84....
...cludegraphics[bb = 42 52 565 507,width=5.5cm,clip]{g93.3.c74.ps} }
\end{figure}](/articles/aa/full/2006/39/aa5062-06/img98.gif)
![\begin{figure}
\mbox{\includegraphics[bb = 40 150 560 600,width=5.5cm,clip]{g93...
...ludegraphics[bb = 42 52 565 507,width=5.5cm,clip]{g109.1.c74.ps} }
\end{figure}](/articles/aa/full/2006/39/aa5062-06/img99.gif)
![\begin{figure}
\mbox{\includegraphics[bb = 40 150 560 600,width=5.5cm,clip]{g11...
...ludegraphics[bb = 42 52 565 507,width=5.5cm,clip]{g126.2.c74.ps} }
\end{figure}](/articles/aa/full/2006/39/aa5062-06/img100.gif)
![\begin{figure}
\mbox{\includegraphics[bb = 40 150 560 600,width=5.5cm,clip]{g12...
...ludegraphics[bb = 42 52 565 507,width=5.5cm,clip]{g166.0.c74.ps} }
\end{figure}](/articles/aa/full/2006/39/aa5062-06/img101.gif)
![\begin{figure}
{\includegraphics[bb = 10 10 1658 1285,height=13cm,clip]{spec2.ps} }
\end{figure}](/articles/aa/full/2006/39/aa5062-06/img102.gif)
![\begin{figure}
{\includegraphics[bb = 10 10 1635 1285,height=13cm,clip]{spec3.ps} }
\end{figure}](/articles/aa/full/2006/39/aa5062-06/img103.gif)
![\begin{figure}
{\includegraphics[bb = 10 10 1635 1285,height=13cm,clip]{spec4.ps} }
\end{figure}](/articles/aa/full/2006/39/aa5062-06/img104.gif)