![[*]](/icons/foot_motif.gif) ,
,
A&A 457, 425-435 (2006)
DOI: 10.1051/0004-6361:20054444
, T. C. Couto da Silva1 - R. E. de Souza2
1 - Departamento de Física - ICET, UFMT,
Av. Fernando Correa s/n, Cuiabá, MT, Brazil
2 -
Instituto de Astronomia, Geofísica e Ciências Atmosféricas - USP
C.Postal 9638, 01065 - 970 São Paulo, Brazil
Received 30 October 2005 / Accepted 31 March 2006
Abstract
Aims. This work is part of a joint observational program aiming to get photometric and spectroscopic information on southern pairs of galaxies. We present optical long-slit spectroscopic data on 80 probable components of pairs, 61 of them collected with a spectral resolution of
 ,
and 19 with
,
and 19 with
 .
Nevertheless, our analysis takes into account 53 components of pairs with better spectral resolution, as 8 of these target galaxies actually belong to optical pairs. For the sample with better resolution, the covered wavelength range is
.
Nevertheless, our analysis takes into account 53 components of pairs with better spectral resolution, as 8 of these target galaxies actually belong to optical pairs. For the sample with better resolution, the covered wavelength range is
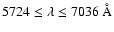 .
The spectroscopic and photometric information is gathered for an analysis relating galaxy morphologies to their spectra.
.
The spectroscopic and photometric information is gathered for an analysis relating galaxy morphologies to their spectra.
Methods. We use
![$\rm H_{\alpha} + [N_{II}]$](/articles/aa/full/2006/38/aa4444-05/img8.gif) and H
and H equivalent widths as star formation tracers for the central region of our sample galaxies, and we classify the spectra according to the emission lines' relative strength by looking at their behavior.
Results. Some of our sample galaxies exhibit high central star formation, most of them belonging to close pairs. However, not all galaxies' components of close pairs show this behavior. This may be a clue that besides interaction, other agents can stimulate central emission in binary galaxies. We suggest an enhancement in the number of galaxies with peculiar spectra (probably Seyferts) in our binary sample, when compared to isolated galaxies. Our data indicates that the morphological types of interacting galaxies are related to their spectral characteristics, as almost all early-type galaxies of our sample do not exhibit central optical emission. We note that the star formation activity is most likely to take place in both pairs' components, with a slightly higher mean strength for the less bright component of the pair. It is interesting to point out that most spirals exhibiting a strong HII emission line spectra present either a bar or a peculiarity, but on a general basis we do not find an enhancement of star formation in our interaction sample.
Key words: galaxies: interactions
There is much evidence that galaxy interactions are an important factor in enhancing energetic activities in the inner regions of individual galaxies. A broad review by Barnes & Hernquist (1992) suggests that tidal interactions and mergers could supply the gas fuel necessary either to trigger a starburst or to generate an active galactic nucleus (AGN) in galaxies. Other authors, such as Condon et al. (1982), and Smith & Kassim (1993), established the relationship between interactions and the enhancement emission in radio wavelengths; Joseph et al. (1984), Lonsdale et al. (1984), and Bushouse et al. (1988) the enhancement in the infrared emission; Keel et al. (1985), Kennicutt (1990), Sekiguchi & Wolstencroft (1992, 1993), and Donzelli & Pastoriza (1997) the enhancement in optical emission line; and de Souza et al. (1997) the enhancement in the blue continuum of interacting objects. While some authors reported an excess of Seyfert-type activity among interacting galaxies (Keel et al. 1985; Dahari 1985), others (Sekiguchi & Wolstencroft 1992, 1993; Donzelli & Pastoriza 1997) suggested that star formation is the dominant energy source of their activities.
However, not all binaries clearly exhibit this behavior. Bergvall & Johansson (1995) compared the broadband distribution of a sample of interacting galaxies with a sample of elliptical galaxies and did not find any sign of induced enhanced star formation in the central region of these galaxies. For these authors, it is unlikely that the effect of dust and the counteracting effect of star formation might make an observed distribution exactly like that of an old stellar population. Bergvall et al. (2003) also did not find evidence for a significant enhancement in star formation among interacting/merging galaxies, as compared to non-interacting galaxies, although they reported a moderate increase in the center region of interacting galaxies. Forbes et al. (1994) pointed out that the inner regions of a galaxy can be more sensitive to interactions than global measurements indicate. These authors found a slight trend for interacting galaxies to show bluer nuclear color than galaxies that are not in interaction. Nevertheless, Reduzzi & Rampazzo (1996) suggested that even a moderate interaction might be able to keep the gas within the nuclear region and enhance both star formation and nuclear activity in binary galaxies.
With the goal of studying details in galaxies belonging to pairs, we
began a study of galaxies selected from the list of southern binary galaxies in
Soares et al. (1995). The isolation criteria adopted by Soares et al.
(1995) is based on local density enhancement; thus, it includes a larger fraction
of wide pairs, but at the cost of a large contamination by false pairs.
Soares et al. (1995) suggested that 20-30% of their listed pairs are
optical. One aim of this work was to get homogeneous radial velocity
measurements for their list of probable pairs, mainly for
objects without radial velocities available at the beginning of this project.
Another goal was to check for a central star formation enhancement
in our sample of probable pairs. We used the equivalent widths (EW) of
and
 emission lines as star
formation tracers. These emissions are usually associated with a measurement
of the global photoionization rate provided by massive
stars (>10 solar mass) that are related to recent star formation.
emission lines as star
formation tracers. These emissions are usually associated with a measurement
of the global photoionization rate provided by massive
stars (>10 solar mass) that are related to recent star formation.
The list of probable pairs selected for this study covers a broad range of angular separation and different stages of interaction. For the majority of these pairs, we obtained photometric data as well (Couto da Silva & de Souza 2006). For all but two galaxies belonging to this sample, the morphological classification was obtained in a very accurate way in our photometric work, taking into account the inner structure of galaxies. This paper is organized as follows: Sect. 2 presents data acquisition; Sect. 3, radial velocities; Sect. 4, special spectra ; Sect. 5, central optical emission; Sect. 6, a discussion of our results; and Sect. 7, a summary of our main conclusions.
The optical long-slit spectroscopic data was collected at the 1.6 m telescope
located at the Observatório do Pico dos Dias, operated by the Laboratório Nacional de
Astrofísica (LNA-Brazil), using a Boller & Chivens
spectrograph mounted on Cassegrain focus and CCD detectors. Data was observed
in two different runs. In the first run (data 1), we used a CCD detector with
 pixels of
  m; however, the data was stored in a format of
 pixels. The galaxies were observed using a
  m slit, a grating
with 300 l/mm in first order. A focus conversion changed the
telescope focus ratio from f10.0 to f13.5.
The corresponding linear dispersion was settled in
m slit, a grating
with 300 l/mm in first order. A focus conversion changed the
telescope focus ratio from f10.0 to f13.5.
The corresponding linear dispersion was settled in
 mm, the spectral
resolution,
mm, the spectral
resolution,
 ,
and the wavelength range covered was
,
and the wavelength range covered was
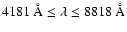 ,
centered on
,
centered on
 .
This range
includes
,
.
This range
includes
,
 ,
,
 ,
,
 ,
and
,
and
 lines,
appropriate to the analysis of emission spectra, and the doublet NaI and
lines,
appropriate to the analysis of emission spectra, and the doublet NaI and
 band, useful for studying the absorption spectra. Two expositions of
900 s were obtained for each target to remove cosmic rays. For the
second run (data 2), we used a CCD detector with
band, useful for studying the absorption spectra. Two expositions of
900 s were obtained for each target to remove cosmic rays. For the
second run (data 2), we used a CCD detector with
 pixels of m, a m slit, a 900 l/mm grating in first order, and the same focus
conversion previously described. The linear dispersion is
pixels of m, a m slit, a 900 l/mm grating in first order, and the same focus
conversion previously described. The linear dispersion is
 mm, and the
spectral resolution,
mm, and the
spectral resolution,
 .
The covered wavelength range is
,
centered in
.
The covered wavelength range is
,
centered in
 .
This range
includes
,
,
and
lines, and the
doublet NaI. We took two expositions of 1200 s for each target galaxy. A
sample of late-type stars was also observed for radial velocity calibration with
an exposition time of 10 s. Spectrophotometric stars were not observed, and our
data could not be flux calibrated. Standard techniques of data reduction were
applied to our data using IRAF. The extraction was done individually for each of the
spectra. The tracing and sky subtraction was interactively obtained
for each frame. After remotion of cosmic rays, the frames were combined to a single
one. Wavelength calibration was done with He-Ar comparison lamp; afterwards, the
spectra were normalized to the medium continuum.
.
This range
includes
,
,
and
lines, and the
doublet NaI. We took two expositions of 1200 s for each target galaxy. A
sample of late-type stars was also observed for radial velocity calibration with
an exposition time of 10 s. Spectrophotometric stars were not observed, and our
data could not be flux calibrated. Standard techniques of data reduction were
applied to our data using IRAF. The extraction was done individually for each of the
spectra. The tracing and sky subtraction was interactively obtained
for each frame. After remotion of cosmic rays, the frames were combined to a single
one. Wavelength calibration was done with He-Ar comparison lamp; afterwards, the
spectra were normalized to the medium continuum.
![\begin{figure}
\par\includegraphics[width=4.4cm,clip]{espsep.eps}\hspace*{2mm}
\includegraphics[width=4.3cm,clip]{espdvel.eps}
\end{figure}](/articles/aa/full/2006/38/aa4444-05/img27.gif) |
Figure 1:
Frequency of pair projected separation (Sep) and
frequency of radial velocity difference ( )
for our sample pairs. )
for our sample pairs. |
| Open with DEXTER | |
Table 1: Sample of binary galaxies.
Table 2: Sample of probable binary galaxies (2).
Whenever possible, we used both emission and absorption lines to determine our radial velocities. For that reason, we used rvidlines and cross IRAF tasks; the latter is based on Tonry & Davis' (1979) method. Our results for our second run, the one with better resolution, are shown in Table 1. We consider H0 = 100 km s-1 Mpc-1. In this table, the first column presents the object identification as it is described by Soares et al. (1995). A * symbol indicates that this galaxy was also studied in photometry (Couto da Silva & de Souza 2006). Columns 2 and 3 present the object identification and the radial velocity from ESO-LV catalogue (Lauberts & Valentijn 1989). Column 3 also exhibits other values for galaxy radial velocity when it was not available in the ESO-LV; in this column, BLA indicates data from Bergvall et al. (2003); dCa, da Costa et al. (1991); dCb, da Costa (1994; as published in Reduzzi & Rampazzo 1995); dCc, da Costa et al. (1998); dS, de Souza et al. (1997); F, Fisher et al. (1995); FJ, Fairall & Jones (1991); Lo, Loveday (1996); M, Mathewson et al. (1992); R., Ratcliffe et al. 1998; Sch., Schweizer (1987); and SWa, Sekiguchi & Wolstencroft (1992). Column 4 shows the radial velocity obtained using emission lines; Col. 5, the latter column value dispersion; Col. 6, the number of lines used to determine last column value; Col. 7, the radial velocity obtained using absorption lines; Col. 8, last column dispersion value; Col. 9, the number of lines used to get Col. 8; Col. 10, radial velocity obtained using cross-correlation method; Col. 11, last value dispersion; and Col. 12, the TDR value, which supplies the confidence degree of cross-correlation method used to get the radial velocity value (Tonry & Davis 1979). Larger TDR values indicate a best confidence for radial velocity determination.
Table 2 presents the radial velocities for the first run. Column representations are the same as for the previous table, but in Col. 3, di indicates di Nella et al. (1996) data. CS* indicates that this galaxy has a radial velocity determined in both runs; MF, Mathewson & Ford (1996); and SWb, Sekiguchi & Wolstencroft (1993). In fact, P221 is not a pair but a compact group; this group image and the galaxies associated with the letters a, b, c, and are shown in Couto da Silva & de Souza (2006). P268 is also a compact group (see more details in our previous work). It is interesting to point out that P280b was studied by Sekiguchi & Wolstencroft (1993), and that it is companion to another galaxy that is not P280a.
The distributions shown in Fig. 1 have a similar behavior of those obtained by de Souza et al. (1997) for a sample of binary galaxies from Soares et al. (1995).
For nearly  of our sample galaxies the projected separation is <100 kpc.
It means that our sample is mainly composed of close pairs, although there are some with
larger projected separations. For the majority (
of our sample galaxies the projected separation is <100 kpc.
It means that our sample is mainly composed of close pairs, although there are some with
larger projected separations. For the majority (
 )
of our pairs,
)
of our pairs,
 km s-1. A similar distribution was found by Sekiguchi & Wolstencroft
(1992), Chengalur et al. (1993), and de Souza et al. (1997). We
consider that pairs with
km s-1. A similar distribution was found by Sekiguchi & Wolstencroft
(1992), Chengalur et al. (1993), and de Souza et al. (1997). We
consider that pairs with
 km s-1 are optical.
We present data for 61 galaxies with spectral resolution
(data 2), and
20 galaxies with spectral resolution
.
However, P575a was
observed in both runs, and we were left with information for
80 galaxies. We noted that 53 of them belong to pairs, while 8 objects are
components of optical pairs.
In this section we present our data for galaxies with peculiar spectra, such as
Seyferts (Sys), LINERs, N galaxies, starbursts, or some galaxies previously
studied by other authors. Our spectra were classified according to the emission lines
relative strength recipe of Véron-Cetty & Véron (1986). However, our
better resolution data does not reach the
![$\rm [OIII] \lambda 5007$](/articles/aa/full/2006/38/aa4444-05/img39.gif) line, used for
spectral classification of a galaxy, such as an Sy2, for instance. Due to that fact,
we suggest the spectral classification of such galaxies as Sy2.
line, used for
spectral classification of a galaxy, such as an Sy2, for instance. Due to that fact,
we suggest the spectral classification of such galaxies as Sy2.
The Véron-Cetty & Véron (1986) spectral classification classifies the
galaxies with enlarged Balmer lines as Seyfert 1 (Sy1); those with
![$\rm H_\alpha < 1.2 [NII]\lambda 6583$](/articles/aa/full/2006/38/aa4444-05/img40.gif) and
and
![$\rm [OIII]\lambda 5007 \gg H_\beta$](/articles/aa/full/2006/38/aa4444-05/img41.gif) as
Seyfert 2 (Sy2); those with
and
as
Seyfert 2 (Sy2); those with
and
![$\rm [OI]\lambda 6300 > 0.3 H_\alpha$](/articles/aa/full/2006/38/aa4444-05/img42.gif) as LINERs ; those with
and no other line is showing
(except by
as LINERs ; those with
and no other line is showing
(except by
![$\rm [SII]\lambda\lambda 6717{-}6731$](/articles/aa/full/2006/38/aa4444-05/img43.gif) ), which do not allow us to discern
between Sy2 and LINER, as N; and those with
), which do not allow us to discern
between Sy2 and LINER, as N; and those with

![$\rm [NII]\lambda 6583$](/articles/aa/full/2006/38/aa4444-05/img45.gif) ,
as HII. It is important to emphasize that Filippenko & Terlevich (1992) claimed
that a classical definition of LINER does not indicate an AGN because
,
as HII. It is important to emphasize that Filippenko & Terlevich (1992) claimed
that a classical definition of LINER does not indicate an AGN because
![$\rm [OI]/H_{\alpha} < 1.6$](/articles/aa/full/2006/38/aa4444-05/img46.gif) relative strength might be explained by a
photoionization model.
relative strength might be explained by a
photoionization model.
![\begin{figure}
\par\includegraphics[width=4.3cm,clip]{espp117a.eps}\hspace*{2mm}...
...ps}\hspace*{2mm}
\includegraphics[width=4.3cm,clip]{espp437b.eps}
\end{figure}](/articles/aa/full/2006/38/aa4444-05/img47.gif) |
Figure 2: Peculiar spectra of galaxies. |
| Open with DEXTER | |
![\begin{figure}
\par\mbox{\includegraphics[width=4.3cm,clip]{espp422a.eps} \hspac...
...\hspace*{2mm}
\includegraphics[width=4.3cm,clip]{espp546a.eps} }
\end{figure}](/articles/aa/full/2006/38/aa4444-05/img48.gif) |
Figure 3: Spectra of some galaxies. |
| Open with DEXTER | |
and/or
![$\rm [OII]\lambda 3727$](/articles/aa/full/2006/38/aa4444-05/img49.gif) are detected. In
our data, the [NII] emission is deblended. According to the Véron-Cetty &
Véron (1986) spectra classification, this galaxy shows HII emission.
are detected. In
our data, the [NII] emission is deblended. According to the Véron-Cetty &
Véron (1986) spectra classification, this galaxy shows HII emission.
![\begin{figure}
\par\mbox{ \includegraphics[width=5.8cm,clip]{altaron.eps}\hspace*{2mm}
\includegraphics[width=5.8cm,clip]{halfa.eps} }
\end{figure}](/articles/aa/full/2006/38/aa4444-05/img51.gif) |
Figure 4:
In both figures, open triangles represent our data for galaxies with
non-peculiar morphologies; bold triangles, the data for galaxies with peculiar
morphology; and starry triangles, the ones for objects with peculiar spectra.
Figure 4a presents the variation of EW
![$\rm {(H_{\alpha } + [N_{II}])}$](/articles/aa/full/2006/38/aa4444-05/img2.gif) with
morphological type. In this figure open squares represent field
galaxies' integrated spectra data from Kennicutt (1992, hereafter K 92);
bold squares, K(92) data for strongly interacting galaxies; and starry squares,
K(92) data for Seyfert galaxies. The behavior of field galaxies with
with
morphological type. In this figure open squares represent field
galaxies' integrated spectra data from Kennicutt (1992, hereafter K 92);
bold squares, K(92) data for strongly interacting galaxies; and starry squares,
K(92) data for Seyfert galaxies. The behavior of field galaxies with
 resolution integrated spectra from Kennicutt (1992, hereafter K 92) is presented
with a broken line. The dotted line shows the behavior of EW
for the integrated spectra of field galaxies from Kennicutt & Kent (1983, hereafter KK 83). The solid line indicates a trial upper limit for our sample galaxies that may
not show emission line strength excess. This line is parallel and encompasses the one
which represents K92 data of integrated emission because the latter is
diluted over a larger region. Figure 4b presents the variation of EW (H)
with morphological type.
resolution integrated spectra from Kennicutt (1992, hereafter K 92) is presented
with a broken line. The dotted line shows the behavior of EW
for the integrated spectra of field galaxies from Kennicutt & Kent (1983, hereafter KK 83). The solid line indicates a trial upper limit for our sample galaxies that may
not show emission line strength excess. This line is parallel and encompasses the one
which represents K92 data of integrated emission because the latter is
diluted over a larger region. Figure 4b presents the variation of EW (H)
with morphological type. |
| Open with DEXTER | |
/
 and
and
![$\rm [OIII]]\lambda
5007$](/articles/aa/full/2006/38/aa4444-05/img53.gif) /
/
 .
We found the same relation for
/
relative strength, but we cannot confirm their findings for
/
because our spectra does not reach that
wavelength range. This galaxy shows strong emission lines. However,
Bergvall & Johansson (1995) obtained a spectra with no emission lines for
this object (ESO 228-G30) in the range
.
We found the same relation for
/
relative strength, but we cannot confirm their findings for
/
because our spectra does not reach that
wavelength range. This galaxy shows strong emission lines. However,
Bergvall & Johansson (1995) obtained a spectra with no emission lines for
this object (ESO 228-G30) in the range
 .
and
are detected.
Bergvall & Johansson (1995) also detected
and
emission lines in this galaxy (ESO288-G32).
.
and
are detected.
Bergvall & Johansson (1995) also detected
and
emission lines in this galaxy (ESO288-G32).
As was already mentioned, our analysis takes into account only the data obtained with spectral resolution
.
In this sample, we detected 8 out of 53 binary galaxies with peculiar spectra: P117a, P139b, P432a, P432b, P437a, P437b, P497b, and P546a. According to
the Véron-Cetty & Véron (1986) spectral classification, we can only classify
these galaxies as N spectral type.
However, we believe that 5 of them (P117a, P139b, P432a, P437a, and P437b) are Seyfert. If this suggestion is confirmed, the percentage of Seyfert galaxies in our sample is  .
We consider these galaxies as Seyferts instead of LINERs due to the broad emission lines in their spectra. Three of these galaxies, P432a, P437a, and P437b, are cited as Seyferts in the literature; however, we do not suggest that P432b is Sy, but that it is LINER, although it has
both citations in previous works. According to the literature, there are 4 Sys
in our sample, and according to our suggestion there are 5. We must remember that the field galaxies sample cited in the literature is only composed of disk galaxies. Excluding the 4 ellipticals from our binary sample, we are left with 49 disk galaxies. According to previous publications, there are 4/49, or an
.
We consider these galaxies as Seyferts instead of LINERs due to the broad emission lines in their spectra. Three of these galaxies, P432a, P437a, and P437b, are cited as Seyferts in the literature; however, we do not suggest that P432b is Sy, but that it is LINER, although it has
both citations in previous works. According to the literature, there are 4 Sys
in our sample, and according to our suggestion there are 5. We must remember that the field galaxies sample cited in the literature is only composed of disk galaxies. Excluding the 4 ellipticals from our binary sample, we are left with 49 disk galaxies. According to previous publications, there are 4/49, or an  fraction of Sys in our sample; and according
to our suggestion, that number is 5/49, or
fraction of Sys in our sample; and according
to our suggestion, that number is 5/49, or  .
These values are similar to the
fraction of Seyferts found by Keel et al. (1985) for pair components:
.
These values are similar to the
fraction of Seyferts found by Keel et al. (1985) for pair components:  for the complete sample and
for the Arp sample. Our values are slightly larger than the
for the complete sample and
for the Arp sample. Our values are slightly larger than the  number of Sys of the Keel (1983) disk field galaxies control sample. According to Keel et al. (1985) recipe the number of galaxies in our sample cited as Sys in the literature is significant at the
  ,
while those that we proposed are significant at the
,
while those that we proposed are significant at the  .
It is important to emphasize that if P432b is classified as Sy instead of LINER (as cited in the literature), our suggestion number of Seyferts becomes 6/49 (
.
It is important to emphasize that if P432b is classified as Sy instead of LINER (as cited in the literature), our suggestion number of Seyferts becomes 6/49 ( ), a more significant fraction. If we compare our fraction of probable Sys with the
  fraction for isolated field spirals from Dahari (1985), the results become still more significant. In spite of dealing with a small number of pair components we suggest that there is an enhancement in number of Seyferts in our binary sample, as was proposed by Keel et al. (1985) for their sample of paired galaxies. Barton et al. (2000) noted that
  of their close pairs sample have emission line ratios consistent with Sys or LINERs. In our sample, there are
  (8/53) Sys or LINERs, a fraction similar to the one obtained by Barton et al. (2000), but much less than the
  number of AGNs found by Veilleux et al. (1995) for their sample of luminous infrared galaxies (LIRGs). According to Barton et al., these differences may occur because infrared selection favors late-stage mergers, dusty mergers, and merger remnants, whereas blue selection favors younger star-forming systems. Only 2 (P139b and P437a) out of 8 AGNs from our sample show morphological distortion: P139b has tails and P437a is a warped spiral.
Our sample was randomly chosen from Soares et al. (1995) and was only limited by observing time and weather conditions. We may consider this sample as being mainly composed of pairs of relatively comparable sized galaxies, as was the Sekiguchi & Wolstencroft (1992) sample. Most (but not all) of our pairs are undergoing strong interaction. Nevertheless, Dahari (1985), SWa (1992), Donzelli & Pastoriza (1997), and Liu & Kennicutt (1995) found a deficiency of AGNs among interacting or merging systems compared to field spirals. Donzelli & Pastoriza (1997) suggested that the HII-region spectra may dilute the AGN spectra when the observations are performed with low spatial resolution and that high spatial resolution observations are needed to resolve the inner 1 kpc of galaxies.
Kennicutt & Kent (1983, forward KK 83) argued that the emission lines from
field galaxies integrated spectra increase smoothly with the Hubble sequence.
However, the dispersion of every morphological type is very large. The
dispersion may also be related to variations in morphological
classification. According to KK 83, there is not a clear correlation between
nuclear and integrated emission lines. For these authors, the large dispersion in
emission lines, represented by EW (
), is related to disk instead of nuclear formation that they believe is hardly significant.
As we have morphological classification of good quality for most of our sample
galaxies (all but these belonging to pairs P350 and P373) based on
structure analysis (Couto da Silva & de Souza 2006), we can use them to assess
how the Hubble sequence relates to central optical emission in our sample. As was
previously mentioned, only medium resolution spectra are used to obtain
the EW (
).
Main galaxy information is presented in Table 3. In this table,
Col. 1 indicates the Soares et al. (1995) pair number; Col. 2, galaxy identification;
Col. 3, radial velocity; Col. 4, total B apparent magnitude (ESO-LV catalogue);
Col. 5, morphological classification from Couto da Silva & de Souza (2006),
except for pairs P350 and P373 with a morphological type from the RC3
(de Vaucouleurs et al. 1992); Col. 6, projected separation (kpc); Col. 7,
EW (
)
(
 ); and Col. 8, EW (
) (
).
); and Col. 8, EW (
) (
).
Table 3: Central optical emission.
Figure 4 shows the behavior of our data after the exclusion of optical
pairs. We used the following numbers to represent morphological types on the
x-axis of Figs. 4a and b:
 ,
,
 ,
,
 ,
,
 ,
,
 ,
,
 ,
,
 ,
,
 ,
,
 ,
and
,
and
 .
Ellipticals are not represented in these
figures because we did not detect emission lines in their central region.
Figure 4a shows the behavior of EW
as a function
of morphological type. Few galaxies of our sample show a high
EW (
)
strength. It is interesting to note that
the S0 galaxies displaying central optical
emission lines are only these with peculiar spectra (Seyfert or LINER).
Figure 4b presents the variation of EW (
)
with morphological type.
There is a slight trend of Sb-Sbc galaxies presenting a larger EW (
)
strength. Sekiguchi & Wolstencroft (1992) data also shows a slight trend for a larger
central emission of Sb galaxies, but these authors did not note that. It is
important to enlarge the spectra sample of spiral galaxies with good
morphological classification to determine whether this trend is real.
If it is confirmed, then binary galaxies' central emission might be related to
bulge size and to intrisic gaseous amounts in galaxies.
.
Ellipticals are not represented in these
figures because we did not detect emission lines in their central region.
Figure 4a shows the behavior of EW
as a function
of morphological type. Few galaxies of our sample show a high
EW (
)
strength. It is interesting to note that
the S0 galaxies displaying central optical
emission lines are only these with peculiar spectra (Seyfert or LINER).
Figure 4b presents the variation of EW (
)
with morphological type.
There is a slight trend of Sb-Sbc galaxies presenting a larger EW (
)
strength. Sekiguchi & Wolstencroft (1992) data also shows a slight trend for a larger
central emission of Sb galaxies, but these authors did not note that. It is
important to enlarge the spectra sample of spiral galaxies with good
morphological classification to determine whether this trend is real.
If it is confirmed, then binary galaxies' central emission might be related to
bulge size and to intrisic gaseous amounts in galaxies.
![\begin{figure}
\par\mbox{\includegraphics[width=4.4cm,clip]{wekpc.eps}\hspace*{2mm}
\includegraphics[width=4.3cm,clip]{halfakpc.eps} }
\end{figure}](/articles/aa/full/2006/38/aa4444-05/img82.gif) |
Figure 5:
These figures relate EW
and EW (H)
with projected separation. As before, open triangles represent our data for galaxies
with non-peculiar morphologies; bold triangles, the data for galaxies with peculiar
morphology; and starry triangles, the ones for objects with peculiar spectra. |
| Open with DEXTER | |
Figure 5a presents EW
variation with pair
projected separation (kpc). For pair components with
 kpc,
EW (
)
strength does not reach
kpc,
EW (
)
strength does not reach
 .
However, not all
galaxies belonging to close pairs (
.
However, not all
galaxies belonging to close pairs (
 kpc) show
 .
It is noteworthy to emphasize that all but
one of our sample galaxies with EW
.
It is noteworthy to emphasize that all but
one of our sample galaxies with EW
![$\rm {(H_{\alpha} + [N_{II}])} > 50~\hbox{\rm\AA}$](/articles/aa/full/2006/38/aa4444-05/img87.gif) are
components of close pairs. The one belonging to a pair with
are
components of close pairs. The one belonging to a pair with
 kpc is
an Sy2 galaxy (P432a). KK83 proposed that galaxies with EW (
kpc is
an Sy2 galaxy (P432a). KK83 proposed that galaxies with EW ( )
for the
integrate spectra are undergoing episodes of strong star
formation. Figure 5b shows the same trend presented by Fig. 5a: components
of close pairs have more chances of exhibiting an excess in central optical
emission; however, not all of our sample galaxies present that trend. Lambas et al. (2003) verified that star formation in galaxy pairs with projected separation <25 kpc and velocity separation <100 km s-1 is significantly enhanced over
that of isolated galaxies with similar redshifts. However, they noted that
)
for the
integrate spectra are undergoing episodes of strong star
formation. Figure 5b shows the same trend presented by Fig. 5a: components
of close pairs have more chances of exhibiting an excess in central optical
emission; however, not all of our sample galaxies present that trend. Lambas et al. (2003) verified that star formation in galaxy pairs with projected separation <25 kpc and velocity separation <100 km s-1 is significantly enhanced over
that of isolated galaxies with similar redshifts. However, they noted that
 of galaxy pairs do not show signs of important star formation activity,
supporting the hypothesis that the internal properties of galaxies play a crucial role
in triggering star formation for galaxies in interaction. Our results may
be considered an extension of Lambas et al. (2003) findings. Our results also
corroborate the findings of Bushouse et al. (1988), who verified
that many interacting galaxies do not show central emission.
of galaxy pairs do not show signs of important star formation activity,
supporting the hypothesis that the internal properties of galaxies play a crucial role
in triggering star formation for galaxies in interaction. Our results may
be considered an extension of Lambas et al. (2003) findings. Our results also
corroborate the findings of Bushouse et al. (1988), who verified
that many interacting galaxies do not show central emission.
In spite of having a small sample, a statistical analysis of our binary galaxies sample
can be made, and we can assess their behavior concerning morphologies, frequency of bars, and mean emission lines. We obtained spectroscopic information for both components of each one
of the 24 pairs with better resolution data. For 7 pairs, we only obtained data for one component. Including morphological information for companions of these galaxies,
we were left with 60 binary galaxies that can be analyzed with respect to their morphological types, but only 53 galaxies can be analyzed using spectroscopic data. One of our sample galaxies, P437a, is a very edge-on spiral. The classification we adopted for this spiral is S(s)b; however, the presence of a bar within it cannot be excluded, although it was not clear either. A better classification for this galaxy should be SB?(s)b. For this analysis we considered P42a as SB(r)bc, P323b as SBb, P358a as SBcd, P363 as Sb, P416b as SBcd, P616b as SABR0, and P521b
as S0. Our sample, randomly chosen from the Soares et al. (1995) binary galaxies list, is composed of 4 elliptical galaxies, 7 (9) lenticulars, 10 Sas, 1 Sab, 8 (10) Sbs, 13 (14) Sbcs, 7 Scs, (2) Scds, and 3 simply classified as S (spiral), due to their severe morphological distortions. Numbers within parentheses indicate the morphological type of the 7 galaxies previously discussed (7 companions to galaxies studied in this sample). These galaxies were included only to obtain statistics related to the morphological types, but they were not taken into account when spectroscopic information was necessary. Thus, we considered a total of 60 objects for this analysis. The number of S0 galaxies is nearly the same as that of Sa and Sb galaxies, however, the occurence of ellipticals (and Sab and Scd galaxies) is very small.
In our sample,  of galaxies are classified as E or S0,
  as Sa or Sab,
  as Sb or Sbc, and
as Sc or Scd galaxies (
as Sb or Sbc, and
as Sc or Scd galaxies ( are classified as S). The majority of
early-type components of our binary sample are lenticular galaxies, while Sb-Sbc galaxies are the most common types in our sample. A slight enhancement of Sb galaxies in pairs is also found in Sekiguchi & Wolstencroft (1992), but these authors did not note that. It seems that, when
ranged together, Sb-Sbc are the most common spiral types in comparably sized binary samples at
the present epoch, unless we believe there is a special reason for their occurrence in these
samples.
are classified as S). The majority of
early-type components of our binary sample are lenticular galaxies, while Sb-Sbc galaxies are the most common types in our sample. A slight enhancement of Sb galaxies in pairs is also found in Sekiguchi & Wolstencroft (1992), but these authors did not note that. It seems that, when
ranged together, Sb-Sbc are the most common spiral types in comparably sized binary samples at
the present epoch, unless we believe there is a special reason for their occurrence in these
samples.
Table 4: Mean central optical emission strength for barred and unbarred disk galaxies.
Information relating to the number of barred and unbarred galaxies and mean
EW
emission line strength for disk galaxies are presented in Table 4. Column 1 displays the morphological type; Cols. 2 and 3 show the number of galaxies morphologically classified as unbarred (SA) and barred (SB). P490a, an SABbc galaxy,
is not included in this table. Mean EW
emission line strengths are presented in Cols. 4 and 5. Column 6 presents mean emission line strength for every morphological type, considering barred and unbarred galaxies together.
We corroborate Liu & Kennicutt's (1995) and Donzelli & Pastoriza's (1997) findings that the morphological types of interacting galaxies are related to their spectral characteristics. The same trend was obtained by Kennicutt & Kent (1983) for the field galaxies integrated spectra.
Ho et al. (1997) noted that the frequency of
![$\rm [H_{II}]$](/articles/aa/full/2006/38/aa4444-05/img96.gif) in the nuclear region of isolated
galaxies is a strong monotonic function of morphological type, increasing from
in the nuclear region of isolated
galaxies is a strong monotonic function of morphological type, increasing from  in
elliptical galaxies to
in lenticular galaxies,
in
elliptical galaxies to
in lenticular galaxies,  in Sa galaxies,
  in
Sb galaxies, and
in
Sb galaxies, and  in Sc-Im galaxies, although these frequencies may be influenced by AGN contamination. We did not detect emission lines in the elliptical galaxies of our sample. The 2 lenticular galaxies, out of 7 exhibiting EW
emission lines,
are AGNs (P432a and P437b), one barred and the other unbarred. Nearly 2/3 of Sa galaxies also do not exhibit central emission. However, the SBa type presents a larger
mean strength than the Sa type in spite of its small mean strength. In the same way,
the SBbc type presents a larger central emission than that of the Sbc type,
but the mean strength for this type is smaller than the strength of the next class of early
and late-spiral types.
If this were caused by a misclassification of these galaxies, the Sbc type probably belongs
to a morphological type next to them with a larger mean emission strength. A comparison
between the morphological types used in this work and other morphological
classifications, such as those from the RC3 catalogue, indicates that this is not
the case. In spite of the small number of galaxies present in this analysis,
it is noteworthy to mention that the occurrence of SBbc is more than twice that of Sbc.
The number of spirals with a morphological type later than Sc is very small, only two,
and both are barred; no spectroscopic data was obtained for them in this work.
There is a small difference between pairs studied in this sample and the one studied in photometry by Couto da Silva & de Souza (2006), but the results are nearly the same.
in Sc-Im galaxies, although these frequencies may be influenced by AGN contamination. We did not detect emission lines in the elliptical galaxies of our sample. The 2 lenticular galaxies, out of 7 exhibiting EW
emission lines,
are AGNs (P432a and P437b), one barred and the other unbarred. Nearly 2/3 of Sa galaxies also do not exhibit central emission. However, the SBa type presents a larger
mean strength than the Sa type in spite of its small mean strength. In the same way,
the SBbc type presents a larger central emission than that of the Sbc type,
but the mean strength for this type is smaller than the strength of the next class of early
and late-spiral types.
If this were caused by a misclassification of these galaxies, the Sbc type probably belongs
to a morphological type next to them with a larger mean emission strength. A comparison
between the morphological types used in this work and other morphological
classifications, such as those from the RC3 catalogue, indicates that this is not
the case. In spite of the small number of galaxies present in this analysis,
it is noteworthy to mention that the occurrence of SBbc is more than twice that of Sbc.
The number of spirals with a morphological type later than Sc is very small, only two,
and both are barred; no spectroscopic data was obtained for them in this work.
There is a small difference between pairs studied in this sample and the one studied in photometry by Couto da Silva & de Souza (2006), but the results are nearly the same.
Donzelli & Pastoriza (1997) studied a sample of pairs consisting of a main galaxy (component A) and a companion with half or less the diameter of the main component (B component),
and they noted that A components show a mean strength of
EW
![$\rm {(H_{\alpha} + [N_{II}])} \sim 37~\hbox{\rm\AA}$](/articles/aa/full/2006/38/aa4444-05/img101.gif) ,
a slightly higher strength than the 29
obtained by KK 83 for normal spiral galaxies (the mean strength for EW
for our sample of spiral components of optical pairs is
,
a slightly higher strength than the 29
obtained by KK 83 for normal spiral galaxies (the mean strength for EW
for our sample of spiral components of optical pairs is
 ). According to Donzelli & Pastoriza, B components show a significantly enhanced strength (54
)
compared to A components and to isolated galaxies.
However, Lambas et al. (2003) verified that the effects of having a companion are more significant on the star formation of bright galaxies in pairs, unless the pairs are formed by similar luminosity galaxies; in this case, the star formation is enhanced in both components.
). According to Donzelli & Pastoriza, B components show a significantly enhanced strength (54
)
compared to A components and to isolated galaxies.
However, Lambas et al. (2003) verified that the effects of having a companion are more significant on the star formation of bright galaxies in pairs, unless the pairs are formed by similar luminosity galaxies; in this case, the star formation is enhanced in both components.
The mean EW
strength for A and B components in our sample is
 and
and
 ,
respectively, considering only spiral + spiral pairs. The errors presented in this work are the mean standard errors. This indicates
that the star formation activity is most likely to take place in both galaxies with nearly the same mean strength, although it is slightly higher for B components. This might be
related to the fact that our pair components show either a large morphological
type similarity (see below) or a similar luminosity, as pointed out by Lambas et al.
(2003). For A components, the mean strength is slightly lower than that obtained
for isolated spirals by KK 83, as well as for optical pairs of this work. The mean strength
for B components is around the one obtained for isolated galaxies, although it may be
slightly different because we did not make an absorption effect correction. However, this may
not affect our results much.
,
respectively, considering only spiral + spiral pairs. The errors presented in this work are the mean standard errors. This indicates
that the star formation activity is most likely to take place in both galaxies with nearly the same mean strength, although it is slightly higher for B components. This might be
related to the fact that our pair components show either a large morphological
type similarity (see below) or a similar luminosity, as pointed out by Lambas et al.
(2003). For A components, the mean strength is slightly lower than that obtained
for isolated spirals by KK 83, as well as for optical pairs of this work. The mean strength
for B components is around the one obtained for isolated galaxies, although it may be
slightly different because we did not make an absorption effect correction. However, this may
not affect our results much.
We corroborate the Bergvall et al. (2003) findings that there is not a significant enhancement in star formation of interacting/forming galaxies. A possible explanation for the differences found in the literature may be associated with different samples taken into account. We noted that in binary galaxies, the emission is related to the galaxy morphology. In our sample, the spirals with types in the range of Sb-Sc galaxies are stronger emitters (we did not observe galaxies Scd and later). If a sample contains more galaxies with morphological types in that range, for instance, the results may indicate a larger mean emission strength. Results based on mean values may be tendentious as well. Just two out of seven lenticulars present optical central emission, and they are both AGNs. These 2 galaxies are responsible for the large mean EW
strength obtained for the lenticulars. If they are excluded from the sample, we should conclude that no one lenticular is a central emitter. All Sbc galaxies but P416a, a flocculent spiral, are central emitters. It would be interesting to obtain EW information on a large sample of pair components ranged in different spiral classes to better differentiate between intrinsic star formation enlargement and that caused by gravitational interaction.
P402b (type S(rs)a p), an optical pair component, shows some very interesting behavior. It presents a very blue central region, a boxy-shaped bulge (Couto da Silva & de Souza 2006), and a strong central HII emission, but it is not a pair component. Perhaps it had an unbound encounter with P402a sometime in the past. As this galaxy does not have a bar, a bar cannot be evoked as the mechanism responsible for driving the gas inward. This interesting object deserves deeper study. Eight galaxies of our sample belong to optical pairs (P40, P373, P387, P402): 1 E, 1 S0,
3 Sas, 1 Sbc, and 2 SBbcs. The elliptical and the lenticular galaxies of these optical pairs do not show emission, and two out of the three Sa galaxies do not show emission lines either. However, the P402b makes the mean EW
strength for Sa galaxies become
 ,
a larger mean strength than the one obtained for pair components. For one Sbc this strength is
,
a larger mean strength than the one obtained for pair components. For one Sbc this strength is
 ,
and for 2 SBbcs galaxies it is
,
and for 2 SBbcs galaxies it is
 .
Of course, we are dealing with uncomfortably small numbers.
.
Of course, we are dealing with uncomfortably small numbers.
Malkan et al. (1998) pointed out that galaxies with HII emission line spectra
appear more irregular and clumpy because of their higher rates of current star
formation per unit of galactic mass. We looked for morphological peculiarities
in our sample for galaxies with EW
![$\rm {(H_{\alpha} + [N_{II}])} \geq 50~\hbox{\rm\AA}$](/articles/aa/full/2006/38/aa4444-05/img108.gif) ,
excluding
the AGNs. Galaxies that match these criteria are: P24b, P422b, P457a, P457b, P500a,
and P500b, all spirals with types equal to or later than Sb. These galaxies present either a bar or an inner peculiarity. P24b, P457a, and P500b are barred spirals. P422b has a very displaced center, P457b exhibits an inner knot of star formation, and P500a has a strong inward peculiarity: a displaced center and a structure (bar?) being formed or extinguished (Couto da Silva & de Souza 2006). However, not all spirals exhibiting either an inner morphological distortion or a bar display a high HII central emission line spectra. This is the case of P101a and P358b, both unbarred galaxies presenting an inward peculiarity, but with a central optical emission in the range foreseen for its morphological type. Nevertheless, P101a is a far
ultraviolet emitter (Bowyer et al. 1995), thus it may be a strong emitter in a
different spectra range than that studied in this work. In P457 and P500, both
components present an excess in their star formation. It is interesting to note
that both pairs have a morphological peculiar spiral paired with a barred spiral.
It is important to keep in mind that P402b, an unbarred component of an optical pair, shows a very peculiar morphology and is a strong central optical emitter. In this case, the strong emission is associated with the peculiar morphology, but not with the gravitational interaction.
,
excluding
the AGNs. Galaxies that match these criteria are: P24b, P422b, P457a, P457b, P500a,
and P500b, all spirals with types equal to or later than Sb. These galaxies present either a bar or an inner peculiarity. P24b, P457a, and P500b are barred spirals. P422b has a very displaced center, P457b exhibits an inner knot of star formation, and P500a has a strong inward peculiarity: a displaced center and a structure (bar?) being formed or extinguished (Couto da Silva & de Souza 2006). However, not all spirals exhibiting either an inner morphological distortion or a bar display a high HII central emission line spectra. This is the case of P101a and P358b, both unbarred galaxies presenting an inward peculiarity, but with a central optical emission in the range foreseen for its morphological type. Nevertheless, P101a is a far
ultraviolet emitter (Bowyer et al. 1995), thus it may be a strong emitter in a
different spectra range than that studied in this work. In P457 and P500, both
components present an excess in their star formation. It is interesting to note
that both pairs have a morphological peculiar spiral paired with a barred spiral.
It is important to keep in mind that P402b, an unbarred component of an optical pair, shows a very peculiar morphology and is a strong central optical emitter. In this case, the strong emission is associated with the peculiar morphology, but not with the gravitational interaction.
Rampazzo et al. (1995) found evidence that for some mixed pairs, the gaseous material of
the early-type galaxy might be obtained from the spiral component through a cross-fueling mechanism. Domingue et al. (2003) also studied a sample of mixed pairs, and they found that many early-type galaxies exhibit weak EW emission. However, some early-type components of their sample, especially the lenticular galaxies, show evidence of significant star formation, with
EW (H)
strength comparable to or exceeding that of spiral components. There are 11 early-type galaxies in our sample, 4 ellipticals, and 7 lenticulars. One elliptical belongs to an
early pair E/S0, and the cross-fueling mechanism cannot act on it or on the lenticular. Three of them are paired with spirals, but we did not detect emission in any of them, even in P546b,
which is a component of a very close pair. Keel et al. (1985) and Liu & Kennicutt (1995) did not detect emission lines in P546b either. Three lenticulars are components of early-type
pairs: one belongs to an E/S0 pair, and two of them to S0/S0 pairs. The remaining 4 lenticulars are components of S0/S pairs where a cross-fueling mechanism should be evoked to trigger star formation in these galaxies. The two lenticular galaxies with EW
emission show a strength that exceeds that of spiral components (P432 and P437); however, both are AGNs and their spiral companions are also AGNs. These pairs are at different relative separations, and it does not seem that the cross-fueling mechanism can be responsible for triggering the active galactic nuclei in both components of these pairs. It is important to emphasize that the Domingue et al. (2003) sample was selected by infrared emission in a
different way than selections made in this work. For almost all early-type galaxies of our sample, we did not detect emission spectra, in accordance with Liu & Kennicutt (1995) and Donzelli & Pastoriza (1997) findings that the morphological types of interacting galaxies are related to their spectral characteristics.
To have a rough idea how binary galaxies components are connected to their
companions, we applied the same pairing factor,  ,
used in our photometric sample (Couto da Silva & de Souza 2006) to our spectroscopic sample. It is important to
emphasize that these samples are slightly different, mainly because of weather conditions.
For pairs with an elliptical component,
,
used in our photometric sample (Couto da Silva & de Souza 2006) to our spectroscopic sample. It is important to
emphasize that these samples are slightly different, mainly because of weather conditions.
For pairs with an elliptical component,
 ,
for N = 4.
This indicates that an elliptical galaxy has a trend of being paired with spiral types
no later than Sb, in spite of individual differences. However,
the small number of elliptical galaxies in our sample does not make this result
reliable. For pairs with a lenticular component,
,
for N = 4.
This indicates that an elliptical galaxy has a trend of being paired with spiral types
no later than Sb, in spite of individual differences. However,
the small number of elliptical galaxies in our sample does not make this result
reliable. For pairs with a lenticular component,
 .
This suggests that lenticulars prefer having E or Sab galaxies as companions (N=8, as P538 was counted once and P350 was not included in this analysis). If we take only spiral-spiral pairs
(N=17, as P139 and P358 were excluded from this analysis since they contain an
S component) into account,
.
This suggests that lenticulars prefer having E or Sab galaxies as companions (N=8, as P538 was counted once and P350 was not included in this analysis). If we take only spiral-spiral pairs
(N=17, as P139 and P358 were excluded from this analysis since they contain an
S component) into account,
 ,
indicating that a spiral has a
tendency of being paired with another spiral of similar morphology. There is still
a close correlation among morphological types. These results corroborate the works
of Karachentsev (1990) and Couto da Silva & de Souza (2006), whicht found a
morphological similarity between the pairs' components.
,
indicating that a spiral has a
tendency of being paired with another spiral of similar morphology. There is still
a close correlation among morphological types. These results corroborate the works
of Karachentsev (1990) and Couto da Silva & de Souza (2006), whicht found a
morphological similarity between the pairs' components.
Some galaxies in our sample exhibit strong central star formation detected both in our B-R color maps (Couto da Silva & de Souza 2006) and in this spectroscopic study. Most of these galaxies belong to close pairs; however, not all galaxies belonging to close pairs show this behavior. Disregarding the galaxies with peculiar spectra, we noted that the galaxies exhibiting an excess in their central optical emission either have a bar or an inner morphological peculiarity. That may be an indication that besides interaction, other agents such as particular internal conditions (Petrosian et al. 2002; Lambas et al. 2003), gaseous feeding due to kinematical mechanisms (Keel et al. 1985; Bushouse et al. 1988), orbital geometry (Jones & Stein 1989; Surace et al. 1993), and dust content (Jones & Stein 1989) can trigger emission in binary galaxies. According to Mihos & Hernquist's (1996) models, the gas response to a close pass depends dramatically on the mass distribution of a galaxy.
In agreement with Keel et al. (1985), we suggest that there is a slight enhancement in AGNs in our binary sample, although it is much smaller than the number of AGNs in a sample of LIRGs. Only 2 (P139b and P437a) out of 8 AGNs from our sample show morphological distortion, and our data indicates that AGNs' peculiar spectra are not associated with any morphological peculiarity. It is interesting to note that a galaxy with peculiar spectra (P139b, probably a LINER) belongs to a pair with projected separation >250 kpc. In this case, the proximity between galaxies is not the mechanism responsible for triggering the spectral peculiarity.
We corroborate Liu & Kennicutt's (1995) and Donzelli & Pastoriza's (1997) findings that the morphological types of interacting galaxies are related to their spectral characteristics. In spite of having a few mixed pairs in our sample, we do not corroborate Rampazzo et al.'s (1995) and Domingue et al.'s (2003) findings that in such pairs the gaseous material of the early-type galaxy is obtained from the spiral, unless we believe that either all ellipticals of our sample are exceptions or that the emission of these galaxies is only detected in the infrared spectral range. Only two out of seven lenticular galaxies' components of mixed pairs present a strong central optical emission, and they are both AGNs.
We found a large morphological similarity between pair components, just as Karachentsev (1990) and Couto da Silva & de Souza (2006), for a slightly different sample, did. In our binary sample of relatively comparable sized galaxies, we verified that the star formation activity is most likely to take place in both galaxies with nearly the same mean strength. This might be related to the fact that our pair components show either a large morphological type similarity or a similar luminosity (Lambas et al. 2003).
It seems that, ranged together, Sb-Sbc are the most common spiral types in comparable sized binary samples at the present epoch. As the median population of field galaxies is Sb (Schweizer & Seitzer 1992), we may infer that the population of pairs of galaxies is an extension of that of the field.
Our result is in agreement the one found by Bushouse et al. (1988), who verified that many interacting galaxies do not show nuclear emission. It is important to keep in mind that P402b, an unbarred component of an optical pair, shows a very peculiar morphology and is a strong central optical emitter. In this case, the emission is associated with the peculiar morphology but not with the gravitational interaction.
Acknowledgements
We are indebted to Luís Carlos Yamamoto for helping us with the figures displayed in this paper. T.C.C.S. thanks a CAPES grant. This work was partially supported by PRONEX/CNPq (66.2175/1996-4).
![\begin{figure}
\par\mbox{\includegraphics[width=5.7cm,clip]{espp24a.eps} \hspace...
...hspace{0.3cm}
\includegraphics[width=5.8cm,clip]{espp117b.eps} }
\end{figure}](/articles/aa/full/2006/38/aa4444-05/img113.gif) |
Figure 3: Spectra of some galaxies. |
| Open with DEXTER | |
![\begin{figure}
\par\mbox{ \includegraphics[width=5.7cm,clip]{espp101a.eps} \hspa...
...hspace{0.3cm}
\includegraphics[width=5.8cm,clip]{espp316b.eps} }
\end{figure}](/articles/aa/full/2006/38/aa4444-05/img114.gif) |
Figure 3: continued. |
| Open with DEXTER | |
![\begin{figure}
\par\mbox{ \includegraphics[width=5.8cm,clip]{espp331a.eps} \hspa...
...ce{0.3cm}
\includegraphics[width=5.7cm,clip]{espp363a.eps} }
\par\end{figure}](/articles/aa/full/2006/38/aa4444-05/img115.gif) |
Figure 3: continued. |
| Open with DEXTER | |
![\begin{figure}
\par\includegraphics[width=5.8cm,clip]{espp373a.eps} \hspace{0.3c...
...hspace{0.3cm}
\includegraphics[width=5.7cm,clip]{espp402b.eps} }
\end{figure}](/articles/aa/full/2006/38/aa4444-05/img116.gif) |
Figure 3: continued. |
| Open with DEXTER | |
![\begin{figure}
\par\mbox{\includegraphics[width=5.8cm,clip]{espp416a.eps} \hspac...
...hspace{0.3cm}
\includegraphics[width=5.7cm,clip]{espp429b.eps} }
\end{figure}](/articles/aa/full/2006/38/aa4444-05/img117.gif) |
Figure 3: continued. |
| Open with DEXTER | |
![\begin{figure}
\par\mbox{ \includegraphics[width=5.7cm,clip]{espp457a.eps} \hspa...
...hspace{0.3cm}
\includegraphics[width=5.8cm,clip]{espp487b.eps} }
\end{figure}](/articles/aa/full/2006/38/aa4444-05/img118.gif) |
Figure 3: continued. |
| Open with DEXTER | |
![\begin{figure}
\par\mbox{ \includegraphics[width=5.7cm,clip]{espp490a.eps} \hspa...
...hspace{0.3cm}
\includegraphics[width=5.7cm,clip]{espp546b.eps} }
\end{figure}](/articles/aa/full/2006/38/aa4444-05/img119.gif) |
Figure 3: continued. |
| Open with DEXTER | |
![\begin{figure}
\par\mbox{\includegraphics[width=5.7cm,clip]{espp539a.eps} \hspac...
...cs[width=5.8cm,clip]{espp617b.eps} }
\par\hbox{\hspace{08cm}}
\par\end{figure}](/articles/aa/full/2006/38/aa4444-05/img120.gif) |
Figure 3: continued. |
| Open with DEXTER | |