A&A 456, 1085-1096 (2006)
DOI: 10.1051/0004-6361:20065133
F. Meissner1 - A. Weiss1
Max-Planck-Institut für Astrophysik, Karl-Schwarzschild-Str. 1, 85748 Garching, Germany
Received 3 March 2006 / Accepted 12 June 2006
Abstract
Context. Stellar models and the methods for the age determinations of globular clusters are still in need of improvement.
Aims. We attempt to obtain a more objective method of age determination based on cluster diagrams, avoiding the introduction of biases due to the preference of one single age indicator.
Methods. We compute new stellar evolutionary tracks and derive the dependence of age indicating points along the tracks and isochrone - such as the turn-off or bump location - as a function of age and metallicity. The same critical points are identified in the colour-magnitude diagrams of globular clusters from a homogeneous database. Several age indicators are then fitted simultaneously, and the overall best-fitting isochrone is selected to determine the cluster age. We also determine the goodness-of-fit for different sets of indicators to estimate the confidence level of our results.
Results. We find that our isochrones provide no acceptable fit for all age indicators. In particular, the location of the bump and the brightness of the tip of the red giant branch are problematic. On the other hand, the turn-off region is very well reproduced, and restricting the method to indicators depending on it results in trustworthy ages. Using an alternative set of isochrones improves the situation, but neither leads to an acceptable global fit.
Conclusions. We conclude that evolutionary tracks of low-mass metal-poor stars are far from reproducing all aspects of globular cluster colour-magnitude diagrams and that the determination of cluster ages still depends on the favourite method or indicator chosen.
Key words: stars: evolution - Galaxy: globular clusters: general
The determination of globular cluster (GC) ages rests on the fact that colour-magnitude diagrams (CMDs) of single-age single-composition stellar populations exhibit specific time-dependent features. Most importantly, this is the location of the turn-off (TO), which - together with the cluster's distance - serves as the most straightforward and widely used age indicator. However, there are other parts of the CMD that change their colour or brightness with age, too. Since the sensitivity to time is different for the various parts of the cluster CMD, it is possible to use either the various indicators independently, or the differences in colour and brightness between pairs of them; these latter methods have the advantage of being independent of distance. Finally, one may attempt to fit, within constraints, several properties of parts of the cluster diagram with one isochrone, which is the method of VandenBerg (2000) or even fit the whole fiducial cluster line, as done by Straniero & Chieffi (1991).
The decision of which age indicator is used is the choice of the investigator and may depend on the observational data (e.g., CMDs not deep enough prevent the use of the TO), the isochrones (with or without the horizontal branch), or simply tradition. In the epoch of rather accurate Hipparcos distances, the traditional TO brightness has experienced new interest (Gratton et al. 1997; Carretta et al. 2000). Salaris & Weiss (1997,2002) prefer the brightness difference between horizontal branch (HB) and TO for absolute ages, and the colour difference between TO and red giant branch (RGB) for relative ages, while Rosenberg et al. (1999) use the former method for an almost empirical relative age scale. Rarely, several age indicators are used simultaneously to check for consistency. Therefore, the choice of the age determination method is subject to a bias.
The aim of this paper is to investigate whether the simultaneous use of several age indicators, which implies a higher degree of objectivity, is possible and whether it leads to overall acceptable isochrone fits. We restrict ourselves to brightness and colour differences, thereby avoiding the problem of distance accuracy. We do not intend to present new or improved age determinations, but rather to concentrate on developing a new and more reliable method. The basic idea is to define a selection of crucial points along the cluster sequences and the corresponding ones along theoretical isochrones. These are the TO, and two points close to but cooler than it, the bump and tip of the RGB, and the colour of the lower RGB. HB and RGB tip are almost age independent and serve as reference points; they also provide a means of predicting the distance to the cluster. This can be compared to independent distance measurements to check for consistency and for graphical overlay of isochrone and cluster ridge line.
Various brightness and colour differences are defined according to
their use in the literature as age indicators. They are derived
directly from the photometric data; theoretical values are determined
from our isochrones, which we computed specifically for this project,
and their age dependence fitted by simple analytical formulae. The
deviation between theoretical and observed value as a function of age
enters a goodness-of-fit test (a ![]() -method). The overall minimum
of this function determines the best age, and its value the confidence
level. The basic result is that using all indicators results in flat
minima with low probability, while the restriction to subsets of
indicators (equivalent to putting zero weight to the others) allows
quite precise age determinations. The reason for the failure of the
complete set of age indicators lies in the inability of the isochrones
to fit not just the overall shape, but the individual features of a cluster CMD. More details about our work can be found in
Meissner (2005) on which this paper is based.
-method). The overall minimum
of this function determines the best age, and its value the confidence
level. The basic result is that using all indicators results in flat
minima with low probability, while the restriction to subsets of
indicators (equivalent to putting zero weight to the others) allows
quite precise age determinations. The reason for the failure of the
complete set of age indicators lies in the inability of the isochrones
to fit not just the overall shape, but the individual features of a cluster CMD. More details about our work can be found in
Meissner (2005) on which this paper is based.
The age indicators will be introduced and discussed in Sect. 2 with references to earlier work using them. The observational data are presented in Sect. 3 along with the details of the determination of the ridge line and the various features of interest. Then (Sect. 4) follows a short description of our calculations and a set of stellar tracks. Section 5 contains the presentation of results, while the discussion in Sect. 6 closes the paper.
![\begin{figure}
\par\includegraphics[width=7.2cm,clip]{5133fig1.eps}
\protect\end{figure}](/articles/aa/full/2006/36/aa5133-06/img27.gif) |
Figure 1:
A sample isochrone (
|
| Open with DEXTER | |
Turn-off region: The classical age indicator (Renzini & Fusi Pecci 1988) in cluster CMDs is the turn-off (indicated in Fig. 1 by "TO''), whose position moves to the lower right (cooler and fainter) with age. Its colour can be determined easily and accurately, if the reddening is small or well-determined, while the brightness is more difficult to fix due to the long and almost vertical extension of the ridge-line (or, equivalently, the isochrone), which can reach up to 0.1 mag, corresponding to an age uncertainty of about 1 Gyr. In this paper, we will always indicate TO quantities by the corresponding index.
To avoid the problem of determining
![]() accurately, two alternative indicator points have been introduced that are 0.05 mag
redder than the TO, but that lie on less steep portions of the
isochrone: the point
accurately, two alternative indicator points have been introduced that are 0.05 mag
redder than the TO, but that lie on less steep portions of the
isochrone: the point
![]() on the post-TO part and
on the post-TO part and
![]() on the main sequence. The first alternative was
introduced by Chaboyer et al. (1996b); it has the same age sensitivity as the TO
itself, but its determination is claimed to be a factor of 2 better.
The second one was proposed by Buonanno et al. (1998) and in addition is
claimed to be less affected by uncertainties such as the convection
theory. While this conjecture is plausible on the basis that pre-TO stars are less evolved, it was never investigated in detail.
on the main sequence. The first alternative was
introduced by Chaboyer et al. (1996b); it has the same age sensitivity as the TO
itself, but its determination is claimed to be a factor of 2 better.
The second one was proposed by Buonanno et al. (1998) and in addition is
claimed to be less affected by uncertainties such as the convection
theory. While this conjecture is plausible on the basis that pre-TO stars are less evolved, it was never investigated in detail.
Red giant branch:
The luminosity of the red giant branch tip and its brightness in the
I-band,
![]() ,
depend only weakly on composition, and
hardly at all on age. Therefore, it is used as a standard candle to
determine distances to galaxies with resolved populations (see
Salaris & Cassisi 1997,1998 for a discussion). Since the observational data
we are using (Piotto et al. 2002b, Sect. 3) provide only B and V magnitudes, we will employ the more metallicity-dependent
,
depend only weakly on composition, and
hardly at all on age. Therefore, it is used as a standard candle to
determine distances to galaxies with resolved populations (see
Salaris & Cassisi 1997,1998 for a discussion). Since the observational data
we are using (Piotto et al. 2002b, Sect. 3) provide only B and V magnitudes, we will employ the more metallicity-dependent
![]() as
the reference point from which brightness differences to
time-dependent points can be defined.
as
the reference point from which brightness differences to
time-dependent points can be defined.
On the lower red-giant branch, the colour of a point or region is used
for colour-based age indicators (also called "horizontal''
indicators, in contrast to the brightness-based "vertical'' ones). We
chose the colour of a point 2.5 mag brighter than the TO (
![]() ); Salaris & Weiss (1997) used the mean colour for a range of about 0.5-1.0 mag starting from this point. The uncertainty of
); Salaris & Weiss (1997) used the mean colour for a range of about 0.5-1.0 mag starting from this point. The uncertainty of
![]() is not very crucial since the RGB colour hardly changes over 0.1 mag.
is not very crucial since the RGB colour hardly changes over 0.1 mag.
The most age-sensitive feature along the RGB is the so-called bump, where the evolutionary sequence backtracks on itself over a small magnitude range when the H-burning shell reaches the layers previously mixed by convection at its deepest penetration. This results observationally in an enhanced number of stars in a limited magnitude range (see Salaris et al. 2002 for more details). The bump is now routinely found in high-quality cluster photometry, both in the optical (Riello et al. 2003) and near infrared (Valenti et al. 2004). Its location both in colour and brightness is mass-, and therefore age-dependent. It also depends on composition.
![\begin{figure}
\par\includegraphics[width=7.65cm,clip]{5133fig2.eps}
\protect\end{figure}](/articles/aa/full/2006/36/aa5133-06/img30.gif) |
Figure 2:
Luminosity function isochrones for
|
| Open with DEXTER | |
As the bump has to be detected from the luminosity function (LF) of a cluster, we show the simulated LFs of isochrones with
![]() for ages of 6 and 12 Gyr in Fig. 2. For the initial mass
function (IMF) needed to produce the LF, the standard Salpeter law
(Salpeter 1955) was assumed.
for ages of 6 and 12 Gyr in Fig. 2. For the initial mass
function (IMF) needed to produce the LF, the standard Salpeter law
(Salpeter 1955) was assumed.
Horizontal branch:
The brightness of the zero-age horizontal branch (ZAHB) is only very
weakly dependent on age, and therefore
![]() is widely used for
vertical age indicators (Salaris & Weiss 1997; VandenBerg et al. 1990). Theoretically it is
easily determined, but observationally one estimates it from the lower
envelope of the horizontal branch. From
is widely used for
vertical age indicators (Salaris & Weiss 1997; VandenBerg et al. 1990). Theoretically it is
easily determined, but observationally one estimates it from the lower
envelope of the horizontal branch. From
![]() ,
one can thus derive
the distance to the cluster; in general, the agreement with
main-sequence fitting distances is quite good (Salaris & Weiss 1998). The
colour of the HB red end is another possible age-dependent feature,
but as it is sensitive to many factors, and due to our lack of
understanding HB morphology, we chose not to use it.
,
one can thus derive
the distance to the cluster; in general, the agreement with
main-sequence fitting distances is quite good (Salaris & Weiss 1998). The
colour of the HB red end is another possible age-dependent feature,
but as it is sensitive to many factors, and due to our lack of
understanding HB morphology, we chose not to use it.
![]() :
the difference between TO and ZAHB,
:
the difference between TO and ZAHB,
![]() =
=
![]() -
-
![]() ,
is the
most widely used vertical age indicator (see De Angeli et al. 2005, for
the most recent application), and probably the most reliable one. If
,
is the
most widely used vertical age indicator (see De Angeli et al. 2005, for
the most recent application), and probably the most reliable one. If
![]() is taken at the same colour as the TO, it is largely
independent of uncertainties in the colour transformations or
reddening, and depends only on the relative accuracy of bolometric
corrections, as was discussed by Salaris & Weiss (1998). In contrast to that
paper and to Salaris & Weiss (2002), we also use
is taken at the same colour as the TO, it is largely
independent of uncertainties in the colour transformations or
reddening, and depends only on the relative accuracy of bolometric
corrections, as was discussed by Salaris & Weiss (1998). In contrast to that
paper and to Salaris & Weiss (2002), we also use
![]() for those clusters,
which do not have stars on the HB at the TO colour. This requires a less accurate approach: we chose to select the ZAHB level at the closest colour available in the observed CMD. As long as this point is on the horizontal part of the ZAHB, this appears to be rather safe,
but for an extremely blue morphology, it would be less so. Figure 3 shows
for those clusters,
which do not have stars on the HB at the TO colour. This requires a less accurate approach: we chose to select the ZAHB level at the closest colour available in the observed CMD. As long as this point is on the horizontal part of the ZAHB, this appears to be rather safe,
but for an extremely blue morphology, it would be less so. Figure 3 shows
![]() as a function of age, as well as
as a function of age, as well as
![]() for two metallicities, as obtained from the theoretical
isochrones. It is obvious that
for two metallicities, as obtained from the theoretical
isochrones. It is obvious that
![]() is nearly constant over an age
range of 8-15 Gyr.
is nearly constant over an age
range of 8-15 Gyr.
![\begin{figure}
\par\includegraphics[width=7.15cm,clip]{5133fig3.eps}
\protect\end{figure}](/articles/aa/full/2006/36/aa5133-06/img31.gif) |
Figure 3:
|
| Open with DEXTER | |
![]() and
and
![]() :
these are the two alternative age indicators equivalent to
:
these are the two alternative age indicators equivalent to
![]() ,
but without the uncertainty connected with the determination of
,
but without the uncertainty connected with the determination of
![]() .
All other comments made in the previous paragraph hold. The age
and metallicity dependence is very similar to that of
.
All other comments made in the previous paragraph hold. The age
and metallicity dependence is very similar to that of
![]() .
.
![]() :
in case of a HB with a morphology rendering the previous age
indicators inaccurate, one can resort to
:
in case of a HB with a morphology rendering the previous age
indicators inaccurate, one can resort to
![]() =
=
![]() -
-
![]() instead. Its age sensitivity is slightly lower than that of
instead. Its age sensitivity is slightly lower than that of
![]() for low ages, but almost comparable at the interesting age range
around 10 Gyr. The problems with this indicator lie in the need for
photometry of a sufficient number of stars to identify the
bump. Theoretically, as we will see, it appears to be systematically
too bright by a few tenths of a magnitude as is also found in some
observational papers (e.g., Zoccali & Piotto 2000).
for low ages, but almost comparable at the interesting age range
around 10 Gyr. The problems with this indicator lie in the need for
photometry of a sufficient number of stars to identify the
bump. Theoretically, as we will see, it appears to be systematically
too bright by a few tenths of a magnitude as is also found in some
observational papers (e.g., Zoccali & Piotto 2000).
![]() :
:
![]() =
=
![]() -
-
![]() is again useful in cases of an insufficiently populated or observed HB. It is particularly sensitive to age for lower metallicities, changing by more than 0.5 mag between 8 and 14 Gyr. It was used by Vandenberg & Durrell (1990) for relative age
determinations at a given
is again useful in cases of an insufficiently populated or observed HB. It is particularly sensitive to age for lower metallicities, changing by more than 0.5 mag between 8 and 14 Gyr. It was used by Vandenberg & Durrell (1990) for relative age
determinations at a given
![]() .
The obvious difficulty lies in a precision estimate of
.
The obvious difficulty lies in a precision estimate of
![]() ,
since the number of stars at the tip is very low, due to the increased evolutionary speed in this phase.
,
since the number of stars at the tip is very low, due to the increased evolutionary speed in this phase.
![]() :
if the photometry is not deep enough to reach the TO, it is in
principle possible to use
:
if the photometry is not deep enough to reach the TO, it is in
principle possible to use
![]() =
=
![]() -
-
![]() (Ferraro et al. 1999). The age sensitivity is very weak, amounting to
(Ferraro et al. 1999). The age sensitivity is very weak, amounting to
![]() 0.5 mag over 10 Gyr only, such that
0.5 mag over 10 Gyr only, such that
![]() will not
provide any additional age restriction in comparison with the other
indicators (Cassisi & Salaris 1997). The colour at which
will not
provide any additional age restriction in comparison with the other
indicators (Cassisi & Salaris 1997). The colour at which
![]() is to be taken
is arbitrary, but must be consistent between data and isochrone.
is to be taken
is arbitrary, but must be consistent between data and isochrone.
![]() :
the preferred horizontal (here in (B-V)) age indicator is
:
the preferred horizontal (here in (B-V)) age indicator is
![]() =
=
![]() -
-
![]() (Salaris & Weiss 1997; Buonanno et al. 1998; VandenBerg et al. 1990). As mentioned in
Sect. 2.1, we take
(Salaris & Weiss 1997; Buonanno et al. 1998; VandenBerg et al. 1990). As mentioned in
Sect. 2.1, we take
![]() at a brightness 2.5 mag brighter than the TO. This point represents a compromise between minimising photometric
errors and stellar density on the RGB (Rosenberg et al. 1999). The general
problems with colours rest with the uncertainties in both the
calculations (convection theory) and the transformations between
theoretical
at a brightness 2.5 mag brighter than the TO. This point represents a compromise between minimising photometric
errors and stellar density on the RGB (Rosenberg et al. 1999). The general
problems with colours rest with the uncertainties in both the
calculations (convection theory) and the transformations between
theoretical
![]() and colour. However, by using a differential
quantity, systematic uncertainties related to the models' metallicity
can probably be avoided. A further reduction of the influence of these
uncertainties can be achieved by using
and colour. However, by using a differential
quantity, systematic uncertainties related to the models' metallicity
can probably be avoided. A further reduction of the influence of these
uncertainties can be achieved by using
![]() for relative ages, as
in Salaris & Weiss (1998).
for relative ages, as
in Salaris & Weiss (1998).
![\begin{figure}
\par\includegraphics[width=7.6cm,clip]{5133fig4.eps}
\protect\end{figure}](/articles/aa/full/2006/36/aa5133-06/img35.gif) |
Figure 4:
|
| Open with DEXTER | |
![]() :
alternatively, the colour difference between bump and TO can be used,
which is very similar to
:
alternatively, the colour difference between bump and TO can be used,
which is very similar to
![]() ,
but is taken at the location of a physical feature.
,
but is taken at the location of a physical feature.
Hatzidimitriou (1991) presented a further "age calibrator'', using the colour difference between RGB and the red part of the HB. However, in view of the variety of HBs we encounter in a sample of GC and the unknown influence of the second parameter, we chose not to include this in our investigation.
This work is concerned with developing a more complete approach to
globular cluster dating. The observational data should be
comprehensive in terms of metallicity range and consistent to avoid
differential effects in the quality of the method, which could be due
to the differences in the database. For this reason, the photometric
cluster catalogues by Rosenberg et al. (2000b) or Piotto et al. (2002a) are
excellent choices. The first catalogue was used by Salaris & Weiss (2002), and
we decided to use the second one, which contains 74 galactic GCs in
the HST F439W and F555W filters. The HST observations concentrated in
particular on the central parts of the clusters. We obtained the data
from the Padua web page![]() . The catalogue conveniently
offers reddening-corrected Johnson colours (B, V), which were
obtained by Piotto et al. (2002a) from an iterative data calibration. While
the authors do not claim the reddening to be always correct, in
particular in the case of highly reddened clusters, our differential
age indicators are mostly rather insensitive to reddening.
. The catalogue conveniently
offers reddening-corrected Johnson colours (B, V), which were
obtained by Piotto et al. (2002a) from an iterative data calibration. While
the authors do not claim the reddening to be always correct, in
particular in the case of highly reddened clusters, our differential
age indicators are mostly rather insensitive to reddening.
We did not select 28 clusters due to the low number of stars, a significant scatter in the CMDs, or a lack of any discernible HB. The final number of clusters used was therefore 46 (Table 6).
For the metallicities (
![]() ), we used the values on the scale of
Zinn & West (1984,
), we used the values on the scale of
Zinn & West (1984, ![]() # given in the cluster catalogue, and
transformed them to the Carretta & Gratton (1997,
# given in the cluster catalogue, and
transformed them to the Carretta & Gratton (1997, ![]() # scale with the
relation given by Carretta et al. (2001), unless they were available from
Rutledge et al. (1997).
# scale with the
relation given by Carretta et al. (2001), unless they were available from
Rutledge et al. (1997).
The first step in preparing the photometric data for our method is to
determine the mean ridge line. After the exclusion of obvious HB stars
by eye, we follow the standard procedure described, e.g., in
Cho et al. (2005): After determining the mean colour of stars in
brightness bins of 0.25 mag, stars with a colour more than ![]() different from the mean are removed. Then, the determination of mean
and variance are repeated until convergence is reached, usually in
less than 5 iterations. Typically, around 5% of the initial non-HB
objects are removed. We also tested data using the median instead of
the mean, but the difference in the final ridge line was not
recognizable.
different from the mean are removed. Then, the determination of mean
and variance are repeated until convergence is reached, usually in
less than 5 iterations. Typically, around 5% of the initial non-HB
objects are removed. We also tested data using the median instead of
the mean, but the difference in the final ridge line was not
recognizable.
![\begin{figure}
\par\includegraphics[width=7.5cm,clip]{5133fig5.eps}
\protect\end{figure}](/articles/aa/full/2006/36/aa5133-06/img39.gif) |
Figure 5: Mean ridge line for the cluster M 5 as determined by us (crosses) and by Sandquist et al. (1996) from their own data (diamond symbols). |
| Open with DEXTER | |
Figure 5 shows, as an example, our ridge line and that of Sandquist et al. (1996) for the cluster M 5. It also shows that along the RGB, the ridge line data points do not form a smooth line due to statistical variations at low star numbers per brightness interval. Therefore, we performed a hyperbolic fit to the data following Rosenberg et al. (1999) and Saviane et al. (2000).
The ZAHB brigthness was determined using the method presented by
Salaris & Weiss (1997): the HB is divided into colour bins with width
sufficiently large to contain at least 10 stars. Each colour bin is
then sub-divided into brightness bins of 0.05 mag, and the number of
stars in each of them is used for a histogram of the colour bin. The
criterion for the ZAHB is that 90% or more of all stars are
above the ZAHB and that the number of stars drops by at least a factor
of two from the bin above to that below the ZAHB level. The error is
estimated from the brightness width. Not all colour bins allow the
determination of the ZAHB at this colour and under these conditions,
and thus the ZAHB line is obtained by interpolation between those
colours where the method is successful. To check the reliability of
our method, we compared our results with those of Ferraro et al. (1999),
who determined, among other parameters,
![]() for 61 GCs. Figure 6 shows the result of the comparison, which confirms our method completely.
for 61 GCs. Figure 6 shows the result of the comparison, which confirms our method completely.
![\begin{figure}
\par\includegraphics[width=7.5cm,clip]{5133fig6.eps}
\protect\end{figure}](/articles/aa/full/2006/36/aa5133-06/img40.gif) |
Figure 6:
Comparison of our derived values for
|
| Open with DEXTER | |
![]() can be compared directly with the theoretical predictions
(Sect. 4.2), and therefore immediately yields a distance to the
cluster. We have also compared these distances to those by
Ferraro et al. (1999) and found that our distance moduli are on average
0.1 mag larger. This is the immediate consequence of the Straniero et al. (1997)
stellar models used by Ferraro et al. (1999). We emphasize again that the
distances are not necessary for any age indicator we are using, but
are just for the purpose of comparing isochrone with data in the CMD.
can be compared directly with the theoretical predictions
(Sect. 4.2), and therefore immediately yields a distance to the
cluster. We have also compared these distances to those by
Ferraro et al. (1999) and found that our distance moduli are on average
0.1 mag larger. This is the immediate consequence of the Straniero et al. (1997)
stellar models used by Ferraro et al. (1999). We emphasize again that the
distances are not necessary for any age indicator we are using, but
are just for the purpose of comparing isochrone with data in the CMD.
For the cluster TO, one should select the bluest point along
the MS. However, as disussed by Salaris et al. (1997) for the case of M 15, the
uncertainties in the mean colour of brightness bins, together with the
near-vertical CMD, introduces an uncertainty of 0.1 to 0.2 mag. We
followed the method by Chaboyer et al. (1996a), who fitted the mean ridge line
around the TO by a fifth-order polynomial
(B-V)=f(V), and then took
the bluest point along this curve as the TO. This point does not
necessarily have the same colour as the bluest point of the ridge
line. The error
![]() introduced is estimated (Press et al. 1992) by
the expression
introduced is estimated (Press et al. 1992) by
the expression
The related quantities
![]() and
and
![]() are both determined from the
same polynomial fit and TO colour, with a similar estimate of the
errors (see Fig. 7 for an illustrative example). Again, we
compared our results with others from the literature; in this case we
used Rosenberg et al. (1999), who determined
are both determined from the
same polynomial fit and TO colour, with a similar estimate of the
errors (see Fig. 7 for an illustrative example). Again, we
compared our results with others from the literature; in this case we
used Rosenberg et al. (1999), who determined
![]() from ground-based
VI-photometry, for 16 clusters in common. Only in two cases,
NGC 1261 and NGC 6093 (M 80), is there a difference of 0.3 mag. In all
other cases, the agreement is of the order of 0.1 mag or better; the rms deviation is 0.125 (0.073 without NGC 1261 and M 80).
Noting that
from ground-based
VI-photometry, for 16 clusters in common. Only in two cases,
NGC 1261 and NGC 6093 (M 80), is there a difference of 0.3 mag. In all
other cases, the agreement is of the order of 0.1 mag or better; the rms deviation is 0.125 (0.073 without NGC 1261 and M 80).
Noting that
![]() is 0.06-0.09
for all these clusters, the agreement is excellent.
is 0.06-0.09
for all these clusters, the agreement is excellent.
![\begin{figure}
\par\includegraphics[width=7.75cm,clip]{5133fig7.eps}\end{figure}](/articles/aa/full/2006/36/aa5133-06/img50.gif) |
Figure 7:
Fit to the mean ridge line of NGC 362 in the
TO region, and the location of TO,
|
| Open with DEXTER | |
Finally, we compared our
![]() values with those by
De Angeli et al. (2005), obtained from the same HST photometry. Most values
agree within the error bars (the typical error in De Angeli et al. 2005
is around 0.08 mag), but there are some prominent outliers; many of
them (like NGC 4147, NGC 6273, and NGC 6544) have very blue HBs, for
which our method is more uncertain. For the 35 clusters, for which
we have
values with those by
De Angeli et al. (2005), obtained from the same HST photometry. Most values
agree within the error bars (the typical error in De Angeli et al. 2005
is around 0.08 mag), but there are some prominent outliers; many of
them (like NGC 4147, NGC 6273, and NGC 6544) have very blue HBs, for
which our method is more uncertain. For the 35 clusters, for which
we have
![]() from both sources, the rms is 0.15 mag.
De Angeli et al. (2005) also obtained
from both sources, the rms is 0.15 mag.
De Angeli et al. (2005) also obtained
![]() for the ground-based data by
Rosenberg et al. (1999); the comparison there resulted in an rms deviation of
only 0.09 mag. This better agreement is most likely due to the use of
the same method of "template HBs'' for determining the HB levels.
for the ground-based data by
Rosenberg et al. (1999); the comparison there resulted in an rms deviation of
only 0.09 mag. This better agreement is most likely due to the use of
the same method of "template HBs'' for determining the HB levels.
To identify the RGB bump, the luminosity function (omitting HB and AGB stars) is needed. Piotto et al. (2002a) investigated the completeness of the luminosity function (LF) by artifical star experiments, concluding that the lower MS is complete only to a level of 0.7. In principle, LFs can be used for age determinations, as they allow the identification of the subgiant-branch and bump luminosity and the relative number of stars in different luminosity bins, which is age-sensitive, too. Also, the shape of the LF at the subgiant-branch is age-dependent, and this was used by Zoccali & Piotto (2000) to determine the ages of 18 clusters. However, incompleteness severely affects the usefulness of the LF, and therefore we did not pursue this route any further.
![\begin{figure}
\par\includegraphics[width=7.3cm,clip]{5133fig8.eps}\end{figure}](/articles/aa/full/2006/36/aa5133-06/img51.gif) |
Figure 8: Observed luminosity function (LF) for NGC 362. The lower lines are the differential LF with brightness bins of sizes 0.05 mag (solid) and 0.2 mag (dotted), and the upper solid line the integrated LF. The bump is indentified by the vertical line, where a slope change in the integrated function conincides with a local overdensity of stars. |
| Open with DEXTER | |
To locate the bump, we used brightness bins of 0.05 mag, and followed Ferraro et al. (1999) and Riello et al. (2003) by requiring the coincidence of a stellar overdensity in a brightness bin and of a change of slope in the integrated LF. Figure 8 shows the example of NGC 362. For ten clusters in the sample, the bump could not be identified due to the large scattering of star numbers along the RGB (Table 7). The colour of the bump was determined by using the average (B-V) of the bump and the two adjacent bins. The error was taken to be of the same size as the standard deviation of colours within these three bins. The theoretical counterpart was obtained by taking the upper bump brightness in the isochrone, which corresponds to the peak in the theoretical LF. Tables 6 and 7 list the brightness and colour of our age indicator points for all clusters taken into consideration.
For this project, we computed new stellar models and isochrones with the Garching stellar evolution code described by Weiss & Schlattl (2000). The code incorporates the OPAL equation of state (Rogers et al. 1996) and the OPAL opacity tables (Iglesias & Rogers 1996), supplemented by the molecular opacities of Alexander & Ferguson (1994). In the calculations presented here, the equation of state (EOS) of Irwin (see Cassisi et al. 2003) has been used, which is based on the Eggleton et al. (1973) EOS, calibrated to the OPAL EOS. Diffusion of hydrogen and helium was taken into account using the diffusion coefficient treatment of Thoul et al. (1994), while that of heavier elements was ignored as it only has a minor effect on the evolution (see Weiss & Schlattl 2000). Convection is treated according to standard mixing length theory with the Schwarzschild criterion for stability. The mixing length parameter was obtained from a calibration of the solar model (with diffusion), which yielded a value of 1.71. For the solar mixture, the values by Grevesse & Noels (1993) were employed. No mass loss is included.
Nuclear reaction rates for H-burning are mostly from Adelberger et al. (1998);
the S-factor for
![]() was taken from the
recent result by
the LUNA collaboration (Formicola et al. 2004), and that for
was taken from the
recent result by
the LUNA collaboration (Formicola et al. 2004), and that for
![]() from Junker et al. (1998). Helium
burning reaction rates are by Caughlan et al. (1985) and Caughlan & Fowler (1988).
from Junker et al. (1998). Helium
burning reaction rates are by Caughlan et al. (1985) and Caughlan & Fowler (1988).
We calculated models in the mass range of
![]() .
For the initial helium content Y0 we used
.
For the initial helium content Y0 we used

Table 1: Chemical composition of stellar models with total metallicity Z, initial helium Y0, hydrogen abundance X0, iron abundance with respect to hydrogen (in spectroscopic notation [Fe/H]) and total metallicity with respect to hydrogen [M/H].
Our age indicators require theoretical ZAHB models, which we obtained
by the method presented in Serenelli & Weiss (2005). Briefly, for each
metallicity, one stellar evolution model is followed completely from
ZAMS to HB, including the full core helium flash, and without mass
loss. From the ZAHB configuration of this model, other ZAHB models of
lower mass are obtained by reducing the envelope mass. Serenelli & Weiss (2005)
have shown that this method reproduces models
obtained from full calculations with high accuracy.
As the ZAHB brightness hardly depends
on age (a change in age of 6 Gyr results in a change in
![]() of only 0.02), it suffices to calculate one ZAHB per
metallicity case for the age range of interest.
of only 0.02), it suffices to calculate one ZAHB per
metallicity case for the age range of interest.
To obtain isochrones from the stellar evolution tracks, we follow the
method of equivalence points (EP) described, e.g., in
Bergbusch & VandenBerg (1992). We defined 16 EPs in total, 5 on the MS, 7 more from
the TO to the bottom of the RGB, and 4 more along the RGB, including 2
at the start and end of the bump. Between the EPs, additional points,
their number ranging from 10 on the MS to 100 on the RGB, were
distributed at equal stellar age increments (for details, see
Meissner 2005). This procedure yields a "normalised track''
of given mass and metallicity.
To get an isochrone of age t from these normalised tracks,
![]() and
and
![]() values were interpolated for each
available mass value. This results in a number of normalised points
where the age of the lower mass track is higher and that of the higher mass track
is lower than t. Additional isochrone points are thus obtained by
interpolating
values were interpolated for each
available mass value. This results in a number of normalised points
where the age of the lower mass track is higher and that of the higher mass track
is lower than t. Additional isochrone points are thus obtained by
interpolating
![]() and
and
![]() in t between
corresponding normalised points. We constructed isochrones of age
in t between
corresponding normalised points. We constructed isochrones of age
![]() Gyr for each metallicity.
Gyr for each metallicity.
Finally, isochrones for the cluster metallicity are needed (measured
by its
![]() value). Linear interpolation in metallicity
was done between corresponding points on the available isochrones. We
tested our method by interpolating and comparing with available
metallicities, and found an accuracy of the order of 0.001 mag in
colour, resp. 0.01 in brightness.
value). Linear interpolation in metallicity
was done between corresponding points on the available isochrones. We
tested our method by interpolating and comparing with available
metallicities, and found an accuracy of the order of 0.001 mag in
colour, resp. 0.01 in brightness.
As a further test of our models, we compared
![]() of the
isochrones with temperatures of globular cluster RGBs by
Frogel et al. (1981). We find that with our standard mixing length
parameter, our RGB temperatures are hotter than the emipircal ones for
low metallicities (
of the
isochrones with temperatures of globular cluster RGBs by
Frogel et al. (1981). We find that with our standard mixing length
parameter, our RGB temperatures are hotter than the emipircal ones for
low metallicities (
![]() ,
M 92) by about 100 K. At
,
M 92) by about 100 K. At
![]() (M 13 and M 3), they match the observations perfectly, while at
an even higher metallicity (
(M 13 and M 3), they match the observations perfectly, while at
an even higher metallicity (
![]() ,
47 Tuc and M 71) they are again hotter
by 50-100 K. Given the uncertainty of the empirical determinations
(
,
47 Tuc and M 71) they are again hotter
by 50-100 K. Given the uncertainty of the empirical determinations
(![]() 90 K), this is a satisfactory agreement. We also compared our
results to
the latest
90 K), this is a satisfactory agreement. We also compared our
results to
the latest
![]() -values by Ferraro et al. (2006) for M 92, M 13, and
47 Tuc, given at three different values of
-values by Ferraro et al. (2006) for M 92, M 13, and
47 Tuc, given at three different values of
![]() along the RGB. After
correcting for the slightly different distances, we find agreement
within the errors given by Ferraro et al. (2006) for the two metal-poor
clusters, but systematically hotter theoretical
along the RGB. After
correcting for the slightly different distances, we find agreement
within the errors given by Ferraro et al. (2006) for the two metal-poor
clusters, but systematically hotter theoretical
![]() for 47 Tuc
(
for 47 Tuc
(![]() 150 K), which are, however, only slightly outside the
empirical uncertainties. Overall, we consider the agreement between
our predicted effective temperatures and those determined from the
infrared flux method satisfactory. Nonetheless, the fact that there
is a tendency that the our values are too high renders colour-based
age indicators more problematic than the vertical ones.
150 K), which are, however, only slightly outside the
empirical uncertainties. Overall, we consider the agreement between
our predicted effective temperatures and those determined from the
infrared flux method satisfactory. Nonetheless, the fact that there
is a tendency that the our values are too high renders colour-based
age indicators more problematic than the vertical ones.
Finally, the RGB tip brightness can be compared to empirical data. We use Eq. (3) of Bellazzini et al. (2001), which gives the bolometric magnitude of the giant branch tip as a function of [Fe/H]. Inserting the corresponding numbers from Table 1, we find that the RGB tip of our isochrones (taken at 12 Gyr) is systematically too bright by 0.1 dex in luminosity, almost independent of metallicity. However, this discrepancy with the empirical values is very close to that found by Bellazzini et al. (2001) when comparing their results to the models by Salaris & Cassisi (1998); it seems, therefore, that there is a systematic difference between theoretical and empirical values, which could be due the difficulty of finding the sparsely populated RGB tip.
The theoretical isochrones were transformed into the observational
MV vs. (B-V)0 plane using the transformations by
Cassisi et al. (2004), which, however, do not include ![]() -enhancements
in the theoretical atmosphere models. We always chose the
transformation with
-enhancements
in the theoretical atmosphere models. We always chose the
transformation with
![]() ,
although this will render the transformed isochrones slightly too red
on the RGB (Cassisi et al. 2004).
,
although this will render the transformed isochrones slightly too red
on the RGB (Cassisi et al. 2004).
Alternatively, we tested the Yale transformations
(Green 1988), which result in bluer RGBs than the
Cassisi transformation. The influence on the determined ages was
tested by generating a 10 Gyr isochrone for Z=0.001 with the
transformations by Cassisi et al. (2004), and then fitting it with
isochrones using the Yale transformations. Depending on the age
indicator, the transformations change the inferred age between 0.3 Gyr (for
TO-indicators) and 1.1 Gyr (indicators involving the bump). However,
for
![]() alone, the change is +5 Gyr, when using the Yale transformations. Obviously, together with the hotter RGB effective temperature we find, the problematic colour transformations
are another reason to consider colour-based age indicators less
reliable, at least for absolute age determinations.
alone, the change is +5 Gyr, when using the Yale transformations. Obviously, together with the hotter RGB effective temperature we find, the problematic colour transformations
are another reason to consider colour-based age indicators less
reliable, at least for absolute age determinations.
The theoretical luminosity function is obtained from the isochrone easily, as the mass along it is known, after folding it with an appropriate IMF. We choose an IMF exponent of s=1.17 (appropriate for globular cluster cores, see Zoccali & Piotto 2000), with s=3.35 as the Salpeter value. The influence of s is almost exclusively on the MS; since we need the LF only for the bump location, our results are almost completely independent of s.
The determination of the critical points along isochrones has been
discussed before, or is straightforward. It is convenient to derive
simple relations for their brightness and colour as function of age
for all isochrone metallicities. An example (
![]() )
is shown in
Fig. 9. The analytical relations are obtained in all cases by
fitting a third order polynomial through the data (Tables 8
and 9).
No fitting of the metallicity dependence was done, however, for the
sake of accuracy.
)
is shown in
Fig. 9. The analytical relations are obtained in all cases by
fitting a third order polynomial through the data (Tables 8
and 9).
No fitting of the metallicity dependence was done, however, for the
sake of accuracy.
![\begin{figure}
\par\includegraphics[width=7.2cm,clip]{5133fig9.eps}\end{figure}](/articles/aa/full/2006/36/aa5133-06/img75.gif) |
Figure 9:
|
| Open with DEXTER | |
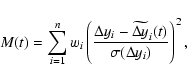
The general method is to calculate, for nindicators and for each isochrone age, the value of M(t)
as defined by
Our best estimate for the age t is then that of the isochrone with minimal M(t), i.e., the age of the isochrone that appears to fit best all indicators simultaneously with equal weights assigned to them, and Q > 0.001 implying that the remaining differences could be by chance due to the measurement errors. We recall (Sect. 4.3) that we always apply ischrones with the metallicity of the particular cluster; however, we do not refine the age grid of our isochrones, which implies an age resolution of 0.5 Gyr. A refined grid of isochrones or use of the polynomial fits of Tables 8 and 9 might possibly yield lower M-values than those given below. We have tested several cases with various combinations of age indicators (equivalent to setting the weights in Eq. (3) to 1); they are given in Table 2.
Table 2: Combinations of age indicators. The weight wi in Eq. (3) is given for each indicator.
NGC 4833 is a cluster with
![]() ;
its CMD
contains about 6700 stars and shows very well-defined structures. The
HB is rather blue, but with a sufficient number of stars at
;
its CMD
contains about 6700 stars and shows very well-defined structures. The
HB is rather blue, but with a sufficient number of stars at
![]() to
determine the ZAHB.
to
determine the ZAHB.
![\begin{figure}
\par\includegraphics[width=6.9cm,clip]{5133fig10.eps}\end{figure}](/articles/aa/full/2006/36/aa5133-06/img82.gif) |
Figure 10:
M(t) for various age indicators for the cluster NGC 4833;
they are:
|
| Open with DEXTER | |
Figure 10 shows M(t) for various indicators. It is
immediately clear that they do not agree at all. The three TO-related
vertical indicators (Case A) yield an age of 13.5 Gyr with
M(13.5)=2.6 and Q=0.457, while
![]() has a sharp minimum at 8 Gyr, and
has a sharp minimum at 8 Gyr, and
![]() at
13.5 Gyr. Notice that
at
13.5 Gyr. Notice that
![]() has an extremely flat curve at
low M, which is due to the large error in this indicator. It provides,
therefore, hardly any restriction on the global fit. Using all
indicators (Case S) results in a minimum at 11.5 Gyr, which however,
is pure coincidence, as
M(11.5)=191 and Q < 0.001. Clearly,
has an extremely flat curve at
low M, which is due to the large error in this indicator. It provides,
therefore, hardly any restriction on the global fit. Using all
indicators (Case S) results in a minimum at 11.5 Gyr, which however,
is pure coincidence, as
M(11.5)=191 and Q < 0.001. Clearly,
![]() is too low (bump too bright; it gets fainter with increasing
age), which is also the reason why
is too low (bump too bright; it gets fainter with increasing
age), which is also the reason why
![]() results in ages above the
maximum age of 18 Gyr for which we have isochrones. Since
results in ages above the
maximum age of 18 Gyr for which we have isochrones. Since
![]() from
the isochrones is too small,
from
the isochrones is too small,
![]() has a too negative value for the
actual age. To compensate, age has to be increased, and since the
indicator is only weakly sensitive, the increase has to be
substantial. The effect is in the opposite direction of that of
has a too negative value for the
actual age. To compensate, age has to be increased, and since the
indicator is only weakly sensitive, the increase has to be
substantial. The effect is in the opposite direction of that of
![]() ,
since the latter quantity has an opposite dependence on
,
since the latter quantity has an opposite dependence on
![]() .
.
We add that
![]() yields an unrealistically low age of 4.5 Gyr,
which is most likely due to an underestimate of the tip brightness in
the data, but could also be due to errors in the cluster
metallicity, as
yields an unrealistically low age of 4.5 Gyr,
which is most likely due to an underestimate of the tip brightness in
the data, but could also be due to errors in the cluster
metallicity, as
![]() is sensitive to it.
is sensitive to it.
Our second example is that of NGC 6934 (
![]() ); the CMD
contains close to 9500 stars and the HB is well populated. As in the
previous case we see (Table 3) that the first three indicators
agree very well and thus the "Case A'' determination yields an age of
9.0 Gyr with Q=0.857. Due to the higher number of stars,
); the CMD
contains close to 9500 stars and the HB is well populated. As in the
previous case we see (Table 3) that the first three indicators
agree very well and thus the "Case A'' determination yields an age of
9.0 Gyr with Q=0.857. Due to the higher number of stars,
![]() can
be determined more accurately and thus
can
be determined more accurately and thus
![]() yields an age in
agreement (Case D). In contrast, inclusion of the bump-brightness yields
discrepant ages and Cases B and BC of Table 2 have a much
lower confidence level (Fig. 11). The same is true when
including the colour indicator
yields an age in
agreement (Case D). In contrast, inclusion of the bump-brightness yields
discrepant ages and Cases B and BC of Table 2 have a much
lower confidence level (Fig. 11). The same is true when
including the colour indicator
![]() (Case E), which requires a higher
age. This implies that the RGB is too blue, relative to the TO, although our
colour transformations have a systematic shift to the red (Sect. 4.3),
and is a likely consequence of the theoretical effective temperatures.
Cases C and F agree quite well with the turn-off indicators.
Overall (Case S) the age is 9.5 Gyr, but the confidence in this
result is very low, and
M(9.5)=150.
(Case E), which requires a higher
age. This implies that the RGB is too blue, relative to the TO, although our
colour transformations have a systematic shift to the red (Sect. 4.3),
and is a likely consequence of the theoretical effective temperatures.
Cases C and F agree quite well with the turn-off indicators.
Overall (Case S) the age is 9.5 Gyr, but the confidence in this
result is very low, and
M(9.5)=150.
Table 3:
Indicator value, age
![]() ,
minimum value
,
minimum value
![]() ,
and fit quality Q for all age indicators applied to NGC 6934.
,
and fit quality Q for all age indicators applied to NGC 6934.
![\begin{figure}
\par\includegraphics[width=7.5cm,clip]{5133fig11.eps}\end{figure}](/articles/aa/full/2006/36/aa5133-06/img92.gif) |
Figure 11: Combinations of age indicators for NGC 6934: Case A (solid), Case B (dotted), Case C (dashed), Case D (dash dot), Case E (dash dot dot dot), and Case S (diamonds). Case F is not shown, as it coincides with Case A. |
| Open with DEXTER | |
We have also investigated all other clusters obtaining consistent results:
the bump in our isochrones appears to be too luminous, thereby leading
to discrepant results when using
![]() or
or
![]() .
The TO indicators give very consistent results with a very high confidence
level, and the quality of
.
The TO indicators give very consistent results with a very high confidence
level, and the quality of
![]() depends on the number of stars
available for the location of the RGB tip, as should be expected.
depends on the number of stars
available for the location of the RGB tip, as should be expected.
![\begin{figure}
\par\includegraphics[width=7.6cm,clip]{5133fig12.eps}\end{figure}](/articles/aa/full/2006/36/aa5133-06/img93.gif) |
Figure 12: Fit of the M 15 photometric data by Piotto et al. (2002b). In the upper panel our standard procedure was applied, fitting the HB at the TO colour. Isochrones of 9 and 11 Gyr are overlaid. For the lower panel, the HB was fitted at the blue end, where the majority of stars is found, as can be seen in the inset of the upper panel. Here, the isochrone ages are 10 and 12 Gyr. |
| Open with DEXTER | |
We finally mention the peculiar case of M 15. Applying our method straightforwardly to the data by Piotto et al. (2002b), we obtain around 9 Gyr only (see Table 5), with very low Q-values. The ZAHB is determined here at the TO-colour. Overlaying the resulting isochrone of 9 (Case A) and 11 Gyr (Case S) with the determined cluster ridge line aligned at the ZAHB (Fig. 12; upper panel), the corresponding distance modulus amounts to 15.32 mag. The figure shows that the isochrone is a very bad match to the CMD; it is too blue for all of the MS and too red on the RGB (one realizes how the "best'' isochrone is a compromise match to all indicators). The inset, however, indicates that there might be a problem with the identification of the HB, as the majority of stars is to the blue and at a higher brightness. Piotto (private communication) pointed out that the data were obtained in HST snapshot mode, which does not allow us to determine the mean brightness of RR Lyr variables, in which M 15 is very rich. Thus, a number of RR Lyr stars will be caught at minimum brightness. This was one reason for Recio-Blanco et al. (2005) to introduce the concept of template clusters. Identifying the blue part as the true HB, we obtain the results of the lower panel: our method yields 10.2-11.7 Gyr for Case A, and 11.5 Gyr for Case S; the ZAHB level corresponds to a distance modulus of 15.10 mag, and the 12 Gyr isochrone matches the CMD quite well, except for being too blue on the lower main sequence.
As the photometry appears to be difficult to interpret, we used as an alternative
that by Durrell & Harris (1993). The ridge
line we determine from this source agrees very well with that derived by
Durrell and Harris themselves.
Our age indicators now yield ages between 10.5 and 13.5 Gyr. The inferred
distance modulus is 15.37. From these
data, the bump could not be located and the corresponding
indicators cannot be used. The remaining indicators together yield 12.0 Gyr, in
excellent agreement with the 11.7 ![]() 0.8 Gyr by
Salaris & Weiss (2002). Note that the CMD of Durrell & Harris (1993) does not show the splitting into
a bluer, brighter and a redder, fainter part, as that by Piotto et al. (2002b) does (visible
also on the original web-site dipastro.astro.unipd.it/globulars/databases).
It is also less pronouned in the ground-based (V-I) data by Rosenberg et al. (2000a).
Whether the data by Piotto et al. (2002b) are erroneous,
or our method of determining the ridge line fails in this case, or
whether the core of M 15 indeed shows an anomalous CMD remains to be
investigated. This case demonstrates that our method might also be capable
of finding inconsistencies in the data.
0.8 Gyr by
Salaris & Weiss (2002). Note that the CMD of Durrell & Harris (1993) does not show the splitting into
a bluer, brighter and a redder, fainter part, as that by Piotto et al. (2002b) does (visible
also on the original web-site dipastro.astro.unipd.it/globulars/databases).
It is also less pronouned in the ground-based (V-I) data by Rosenberg et al. (2000a).
Whether the data by Piotto et al. (2002b) are erroneous,
or our method of determining the ridge line fails in this case, or
whether the core of M 15 indeed shows an anomalous CMD remains to be
investigated. This case demonstrates that our method might also be capable
of finding inconsistencies in the data.
Figure 13 shows the quality of the Case A indicators' fits for all clusters investigated. We notice no correlation with metallicity and that the majority of cases have Q > 0.5. In fact, all but three clusters (NGC 6093, 6642, and 6864) have Q > 0.001, i.e., the best fit is unlikely to be just a chance result. This implies that our isochrones reproduce the critical TO region very well.
![\begin{figure}
\par\includegraphics[width=7.7cm,clip]{5133fig13.eps}\end{figure}](/articles/aa/full/2006/36/aa5133-06/img94.gif) |
Figure 13:
Fit quality of Case A (TO-ZAHB-related) age indicators for
all 46 clusters as a function of
|
| Open with DEXTER | |
The situation is very different for Case B (Fig. 14), when we
add
![]() as an additional age indicator: no
single cluster has Q > 0.1 and 29 clusters are below our rejection
value of 0.001. As the bump appears to be too bright by about 0.2-0.3 mag,
we artificially made it fainter by applying an ad hoc correction of
+0.25 mag, which is also indicated by Zoccali & Piotto (2000). However, the
result is basically the same (Fig. 14),
such that an even larger correction would be needed. Indeed, with
0.35 mag, the ages obtained from
as an additional age indicator: no
single cluster has Q > 0.1 and 29 clusters are below our rejection
value of 0.001. As the bump appears to be too bright by about 0.2-0.3 mag,
we artificially made it fainter by applying an ad hoc correction of
+0.25 mag, which is also indicated by Zoccali & Piotto (2000). However, the
result is basically the same (Fig. 14),
such that an even larger correction would be needed. Indeed, with
0.35 mag, the ages obtained from
![]() begin to be consistent
with those of Case A. Note that adding
begin to be consistent
with those of Case A. Note that adding
![]() to case A
(i.e., Case C) does not degrade the fit quality significantly due to
the rather shallow run of M(t) for this indicator (Fig. 10).
to case A
(i.e., Case C) does not degrade the fit quality significantly due to
the rather shallow run of M(t) for this indicator (Fig. 10).
![\begin{figure}
\par\includegraphics[width=7.8cm,clip]{5133fig14.eps}\end{figure}](/articles/aa/full/2006/36/aa5133-06/img95.gif) |
Figure 14:
Fit quality of Case B (Case A plus
|
| Open with DEXTER | |
The inclusion of the colour indicators (Cases E or F) results in no
change of the fit quality at all because of the large errors
for this indicator (Case F; see Sect. 5.2), or in a larger number of clusters
to be rejected (Case E, inclusion of
![]() ): 15 out of 46 clusters
are below Q=0.001. Here, the theoretical uncertainty in the colour
transformations is crucial and should be included in the calculation
of M, although in this case the usefulness of
): 15 out of 46 clusters
are below Q=0.001. Here, the theoretical uncertainty in the colour
transformations is crucial and should be included in the calculation
of M, although in this case the usefulness of
![]() would just
disappear. What is really needed are reliable and accurate
transformations. Until then, vertical age indicators will remain
the more reliable ones.
would just
disappear. What is really needed are reliable and accurate
transformations. Until then, vertical age indicators will remain
the more reliable ones.
Finally,
![]() leads to systematically too low ages, as is
expected from the problem of finding the true RGB tip in the observed CMD. Insteat, one should probably evaluate at what level the observed tip would be, given the number of stars observed in the uppermost bins of the CMD.
leads to systematically too low ages, as is
expected from the problem of finding the true RGB tip in the observed CMD. Insteat, one should probably evaluate at what level the observed tip would be, given the number of stars observed in the uppermost bins of the CMD.
Table 5 contains the results for Case A, which is the
most reliable one, and Case S for all clusters in
comparison with the ages found by Salaris & Weiss (2002). If there is an age
range given, it is that part of M(t) with Q > 0.32, which corresponds
to the ![]() range or a confidence level of 68%. If only one
age is listed, it is that where M(t) has a minimum and where this
minimum has a lower confidence level. This is particular true for all
ages determined using all indicators (Case S).
Note that very narrow age ranges
ususally are not due to very sharp minima in M(t), but due to a minimum
value only slightly above the
range or a confidence level of 68%. If only one
age is listed, it is that where M(t) has a minimum and where this
minimum has a lower confidence level. This is particular true for all
ages determined using all indicators (Case S).
Note that very narrow age ranges
ususally are not due to very sharp minima in M(t), but due to a minimum
value only slightly above the ![]() level.
level.
![\begin{figure}
\par\includegraphics[width=7.6cm,clip]{5133fig15a.eps}\vspace*{3mm}
\includegraphics[width=7.6cm,clip]{5133fig15b.eps}\end{figure}](/articles/aa/full/2006/36/aa5133-06/img96.gif) |
Figure 15: Fitting functions for NGC 4833 ( upper panel) and NGC 6934 ( lower panel) using the BASTI (Pietrinferni et al. 2004) isochrones. The linetypes correspond to Case A (solid), B (dotted), C (dashed), and S (dash-dotted) in both cases. |
| Open with DEXTER | |
The main conclusion of the preceding sections is that our bump
brightnesses are too high. We have therefore looked into alternative
sets of isochrones. Since Cassisi & Salaris (1997) and Riello et al. (2003) claimed an improved agreement between observed and theoretical
![]() for their
isochrones, we took the publically available BASTI
for their
isochrones, we took the publically available BASTI![]() isochrones by Pietrinferni et al. (2004) and
applied our method to
them. A first inspection already confirmed that BASTI bumps are dimmer
than ours by a few tenths of a magnitude. Figure 15 shows several
fitting functions M(t) for the two sample clusters NGC 4833 and NGC 6934
using the BASTI isochrones. Obviously, in these cases, the bump indicators are in much
better agreement with those of set A, and in addition, the remaining
deviations are in both directions, that is, there are no systematic variations.
The total fit (Case S) is still rather poor,
but this is mainly due to the colour indicators, included here, too.
Figure 16
illustrates the improvement in Q (Case B indicators) for
at least 14 clusters when using the BASTI isochrones, and Table 5
contains the corresponding ages when considering both TO and bump indicators.
isochrones by Pietrinferni et al. (2004) and
applied our method to
them. A first inspection already confirmed that BASTI bumps are dimmer
than ours by a few tenths of a magnitude. Figure 15 shows several
fitting functions M(t) for the two sample clusters NGC 4833 and NGC 6934
using the BASTI isochrones. Obviously, in these cases, the bump indicators are in much
better agreement with those of set A, and in addition, the remaining
deviations are in both directions, that is, there are no systematic variations.
The total fit (Case S) is still rather poor,
but this is mainly due to the colour indicators, included here, too.
Figure 16
illustrates the improvement in Q (Case B indicators) for
at least 14 clusters when using the BASTI isochrones, and Table 5
contains the corresponding ages when considering both TO and bump indicators.
![\begin{figure}
\par\includegraphics[width=7.85cm,clip]{5133fig16.eps}\end{figure}](/articles/aa/full/2006/36/aa5133-06/img97.gif) |
Figure 16:
Fit quality Q for Case B indicators as a function of
|
| Open with DEXTER | |
![\begin{figure}
\par\includegraphics[width=7.65cm,clip]{5133fig17.eps}\end{figure}](/articles/aa/full/2006/36/aa5133-06/img98.gif) |
Figure 17:
Bump brightness for isochrones of 10 Gyr as a function of
metallicity
|
| Open with DEXTER | |
Table 4:
Comparison of bump properties for stellar models of
![]() and Z=0.001. The references are:
Girardi et al. (2000, Padova), Cariulo et al. (2004, Pisa),
Pietrinferni et al. (2004, BASTI), and Kim et al. (2002, Y2).
and Z=0.001. The references are:
Girardi et al. (2000, Padova), Cariulo et al. (2004, Pisa),
Pietrinferni et al. (2004, BASTI), and Kim et al. (2002, Y2).
Table 5:
Ages (in Gyr) for galactic globular clusters
from Case A (Col. 4), from Case S (Col. 5) and quoted from
Salaris & Weiss (2002, Col., "SW02''). The age range is that for which M(t) has
Q > 0.32 (![]() -range). If only one age is given, it is
-range). If only one age is given, it is
![]() ,
with
,
with
![]() .
Columns 7 and 8 contain the result when using
the BASTI isochrones (Pietrinferni et al. 2004) for Case A, and for case BC
(see Table 2), which includes the bump brightness. Case S is not shown as it is not better than for our own isochrones.
.
Columns 7 and 8 contain the result when using
the BASTI isochrones (Pietrinferni et al. 2004) for Case A, and for case BC
(see Table 2), which includes the bump brightness. Case S is not shown as it is not better than for our own isochrones.
In Fig. 17 we show the bump location as a function of
![]() for
our isochrones, that of BASTI, and those by Bergbusch & VandenBerg (2001). Obviously,
our bump location is systematically lower (brighter) than that of the
other two sources. In Table 4 we compare bump locations and
ages of
for
our isochrones, that of BASTI, and those by Bergbusch & VandenBerg (2001). Obviously,
our bump location is systematically lower (brighter) than that of the
other two sources. In Table 4 we compare bump locations and
ages of ![]() stars with Z=0.001 for a number of authors,
finding that there is quite a scatter in the bump properties. The
Padova-bump has the lowest brightness due to the additional effect of
overshooting from the lower convective boundary. The bump of our model
is the brightest, and the age of BASTI's the youngest. We are
currently comparing our RGB models in detail with those by
Pietrinferni et al. (2004) to find out the reasons for the differences. At the
present time, the scatter seems to be an intrinsic uncertainty in the
various model calculations. Further evidence for the rather uncertain
bump brightness comes from the comparison of a
stars with Z=0.001 for a number of authors,
finding that there is quite a scatter in the bump properties. The
Padova-bump has the lowest brightness due to the additional effect of
overshooting from the lower convective boundary. The bump of our model
is the brightest, and the age of BASTI's the youngest. We are
currently comparing our RGB models in detail with those by
Pietrinferni et al. (2004) to find out the reasons for the differences. At the
present time, the scatter seems to be an intrinsic uncertainty in the
various model calculations. Further evidence for the rather uncertain
bump brightness comes from the comparison of a
![]() star
(Z=0.0001) by Straniero et al. (1997), recomputed by M. Limongi (private
communication) with an updated version of his stellar evolution code:
the luminosity of the new model agrees with that of our model within
star
(Z=0.0001) by Straniero et al. (1997), recomputed by M. Limongi (private
communication) with an updated version of his stellar evolution code:
the luminosity of the new model agrees with that of our model within
![]() ,
while the BASTI model is 0.058 dex
fainter. However, all models of Straniero et al. (1997), which were used in
Valenti et al. (2004) for comparison with infrared bump data, were
consistently fainter than ours by
,
while the BASTI model is 0.058 dex
fainter. However, all models of Straniero et al. (1997), which were used in
Valenti et al. (2004) for comparison with infrared bump data, were
consistently fainter than ours by ![]() 0.05 dex.
0.05 dex.
If we use only the Case A indictors, the fit quality of the BASTI is very similar to that of our isochrones, but the ages are on average lower by about 0.5-1.5 Gyr.
The aim of this work has been to attempt for the first time to simultaneously fit several age indicators of globular cluster CMDs. Such a more global approach removes a certain arbitrariness in the method of age determination and results in an overall best-fitting isochrone, which is not necessarily the one that best reproduces the TO. The bottom line of this paper is, however, that we are far from being able to do so. Instead, our method points to a number of inconsistencies and problems with our theoretical models. Apart from the case of M 15 (see Sect. 5.3), where the data deserve a second look by the observers, we doubt that a different data source would alter our findings. Nor did we modify the original data (Piotto et al. 2002b), for example, by changing the reddening.
The most severe problem lies in the bump brightness, which, for our models consistently is too large by up to 0.3 mag. This may indicate the need for overshooting, which would result in a fainter bump. At the present time, however, it is evident that different theoretical models, which nominally all use up-to-date physical input, differ widely in their predictions such that one first should look into code-specific reasons. We tested our method with the BASTI (Pietrinferni et al. 2004) isochrones, which show lower bump brightness, and found some improvement with respect to bump-related age indicators, but no final ages of consistently high confidence levels.
The second problem is the determination of the RGB tip brightness,
which is due to the low number of stars observed in this phase. This
leads to a consistent underestimate for the age derived from
![]() ,
which could be cured by either applying a one-sided error-bar, or by a simulation of observations, or by modifying the age indicator, for
example, by determining the level of the 10% brightest stars above
the HB. Generally, however, this just leads to the assignment of an appreciable error range, which then would reduce the weight of that age
indicator. This could also be done by assigning a lower weight wiin Eq. (3). One should mention in this context that theoretical models
consistently appear to be brighter by
,
which could be cured by either applying a one-sided error-bar, or by a simulation of observations, or by modifying the age indicator, for
example, by determining the level of the 10% brightest stars above
the HB. Generally, however, this just leads to the assignment of an appreciable error range, which then would reduce the weight of that age
indicator. This could also be done by assigning a lower weight wiin Eq. (3). One should mention in this context that theoretical models
consistently appear to be brighter by ![]() 0.2 mag than empirical
determinations (Bellazzini et al. 2001, and Sect. 4.3).
0.2 mag than empirical
determinations (Bellazzini et al. 2001, and Sect. 4.3).
Finally, the colour-related indicators on the RGB are unreliable due to the uncertainties of colour transformations and effective temperatures of the models. They, too, should receive a lower weight, or should be used for differential age determinations only, where the uncertainties are of less influence. The solution lies in better and calibrated transformations.
The most reliable age indicators appear to be those related to
![]() and the three TO-brightness points. They give, for all cases, very
consistent ages, and the confidence level of the solution is always
very high. They are, within the errors, often in agreement with
and the three TO-brightness points. They give, for all cases, very
consistent ages, and the confidence level of the solution is always
very high. They are, within the errors, often in agreement with
![]() and
and
![]() .
Note that the overall best solution, even when
omitting the most problematic indicators, does not yield the age of
the classical indicator,
.
Note that the overall best solution, even when
omitting the most problematic indicators, does not yield the age of
the classical indicator,
![]() ,
alone. This demonstrates that a global fit of cluster CMDs is indeed valuable.
,
alone. This demonstrates that a global fit of cluster CMDs is indeed valuable.
Acknowledgements
We thank H. Schlattl for help with the numerical calculations, M. Salaris for valuable comments on the manuscript, S. Cassisi and D. VandenBerg for making their models available to us, and M. Limongi for doing a separate new calculation. F. Meissner is grateful to the Max-Planck-Institut für Astrophysik for financial support. We also acknowledge the extremely careful and detailed report of the anonymous referee, which helped to significantly improve this paper.
Table 6: Data of the critical points of all Globular Cluster Colour-Magnitude Diagrams in our sample as determined by us (see Sect. 3); part I: the turn-off region and colours of turn-off, lower RGB, and bump.
Table 7:
As Table 6, but displaying horizontal branch, RGB bump, and
tip brightness as well as the cluster distances inferred from
![]() and
and
![]() .
.
![]() is the colour of the point on the ZAHB
closest to the TO colour.
is the colour of the point on the ZAHB
closest to the TO colour.
Table 8: Polynomial relations for points along our isochrones used as age indicators. The relations are all of the form f(t)=a0+a1t+a2t2+a3t3, where t is in Gyr. Part I: V-magnitudes.
Table 9: As Table 8. Part II: Colours.