A&A 455, 931-942 (2006)
DOI: 10.1051/0004-6361:20065315
Methods for improving open cluster fundamental parameters applied to M 52 and NGC 3960
C. Bonatto - E. Bica
Universidade Federal do Rio Grande do Sul, Instituto de Física,
CP 15051, Porto Alegre 91501-970, RS, Brazil
Received 29 March 2006 / Accepted 5 May 2006
Abstract
Aims. We derive accurate parameters related to the CMD, structure and dynamical state of M 52 and NGC 3960, whose fields are affected by differential reddening. Previous works estimated their ages in the ranges 35-135 Myr and 0.5-1.0 Gyr, respectively.
Methods. J, H and  2MASS photometry with errors <0.2 mag is used to build CMDs, radial density profiles, luminosity and mass functions, and correct for differential reddening. Field-star decontamination is applied to uncover the cluster's intrinsic CMD morphology, and colour-magnitude filters are used to isolate stars with high probability of being cluster members.
Results. The differential-reddening corrected radial density profile of M 52 follows King's law with core and limiting radii of


 and
and

 .
NGC 3960 presents an excess of the stellar density over King's profile (
.
NGC 3960 presents an excess of the stellar density over King's profile (

 and
and

 )
at the center. The tidal radii of M 52 and NGC 3960 are
)
at the center. The tidal radii of M 52 and NGC 3960 are
 2.2 pc and
 3.7 pc. Cluster ages of M 52 and NGC 3960 derived with Padova isochrones are constrained to 60
10 Myr and 1.1
0.1 Gyr. In M 52 the core MF (
3.7 pc. Cluster ages of M 52 and NGC 3960 derived with Padova isochrones are constrained to 60
10 Myr and 1.1
0.1 Gyr. In M 52 the core MF (
 0.12) is flatter than the halo's (
 0.12). In NGC 3960 they are
 0.35 and
 0.26. The mass locked up in MS/evolved stars in M 52 is
  1200
1200  ,
and the total mass (extrapolated to 0.08 )
is 3800 .
The total mass in NGC 3960 is 1300 .
,
and the total mass (extrapolated to 0.08 )
is 3800 .
The total mass in NGC 3960 is 1300 .
Conclusions. Compared to open clusters in different dynamical states studied with similar methods, the core and overall parameters of M 52 are consistent with an open cluster more massive than 1000
and 60 Myr old, with some mass segregation in the inner region. The core of NGC 3960 is in an advanced dynamical state with strong mass segregation in the core/halo region, while the somewhat flat overall MF (
 )
suggests low-mass star evaporation. The excess stellar density in the core may suggest post-core collapse. The dynamical evolution of NGC 3960 may have been accelerated by the tidal Galactic field, since it lies
)
suggests low-mass star evaporation. The excess stellar density in the core may suggest post-core collapse. The dynamical evolution of NGC 3960 may have been accelerated by the tidal Galactic field, since it lies  0.5 kpc inside the Solar circle.
Key words: Galaxy: open clusters and associations: individual: M 52 - Galaxy: structure - Galaxy: open clusters and associations: individual: NGC 3960
1 Introduction
Open clusters (OCs) can be used as test-beds of molecular cloud fragmentation, star formation, and stellar and dynamical evolution models. They are excellent probes of the Galactic disc structure (Janes & Phelps 1994; Friel 1995; Bonatto et al. 2006a). This follows from the relative simplicity in age and distance estimates, at least for bright clusters. Accurate OC parameters such as core and limiting radii, age, mass, density, and relaxation times are essential to constrain theoretical
models. However, because most of the OCs lie close to the disk, and thus are more affected both
by reddening and field-star contamination (Bonatto et al. 2006a, and references therein), this kind of analysis becomes restricted to the more populous OCs and/or those located a few kpc from the Sun.
According to the WEBDA![[*]](/icons/foot_motif.gif) OC database (Mermilliod 1996) the current number of OCs with known parameters (such as coordinates, age, distance from the Sun, and reddening) amounts to 700. The catalogue of Dias et al. (2002) includes 1756 optically visible OCs and candidates. More recently Bonatto et al. (2006a) simulated observational completeness
in different directions throughout the Galaxy and estimated that 50% of Trumpler types I to III OCs remain undetected in the solar neighbourhood (distance from the Sun
OC database (Mermilliod 1996) the current number of OCs with known parameters (such as coordinates, age, distance from the Sun, and reddening) amounts to 700. The catalogue of Dias et al. (2002) includes 1756 optically visible OCs and candidates. More recently Bonatto et al. (2006a) simulated observational completeness
in different directions throughout the Galaxy and estimated that 50% of Trumpler types I to III OCs remain undetected in the solar neighbourhood (distance from the Sun
 kpc). A large fraction of the faint and/or poorly populated OCs end up drowned in the stellar background, particularly in directions intercepting the bulge.
Table 1:
General data on M 52 and NGC 3960.
Several decades of studies have provided fundamental parameters for a considerable fraction of the
catalogued OCs (e.g. Lyngå 1982; WEBDA; Dias et al. 2002; Kharchenko et al.
2005; Bonatto et al. 2006a). Some clusters have been studied twice or more
and a disagreement of a factor of 2 in parameters is not uncommon. Discrepancies arise mostly from different analytical methods dealing with optical or IR photometry, Colour-Magnitude Diagrams (CMDs), isochrone sets, photometric systems, etc.
Recently we started a program to derive fundamental parameters of OCs with near-IR photometry
and a series of analytical procedures developed to minimise field-star contamination of CMDs. They
have proven to be effective for parameter determination for a wide class of OCs.
For spatial and photometric uniformity we work with J, H and
2MASS photometry. The 2MASS Point Source
Catalogue (PSC) is uniform reaching relatively faint magnitudes covering nearly all the sky,
allowing a proper background definition for clusters with large angular sizes (e.g.
Bonatto et al. 2004c, 2005).
The use of field-star decontamination and colour-magnitude filters have produced more robust
parameters (e.g. Bonatto & Bica 2005; Bonatto et al. 2006b). In particular,
field-star decontamination constrains the age more, especially for low-latitude OCs (Bonatto
et al. 2006a). These procedures have proven useful in the analysis also of faint and/or distant OCs (Bica et al. 2003; Bonatto et al. 2004b; Bica & Bonatto 2005).
Another potential source of observational uncertainties in OC parameters is the presence of differential reddening. Spatial variation of reddening may affect the age determination by isochrone fitting and, consequently, the distance from the Sun. This in turn could affect the absolute values of core and limiting radii, and cluster mass.
Our goals in this paper are twofold: (i) add to the previous techniques a procedure to take into account the differential reddening, and (ii) derive more constrained parameters for two OCs of different ages. As targets we selected the relatively bright OCs M 52 and NGC 3960 that in the literature have uncertain age determinations. The age of M 52 has been estimated in the range 35-135 Myr (Sect. 2.1), while that of NGC 3960 varies from 0.5 to 1.0 Gyr (Sect. 2.2). Previous works have shown evidence of differential reddening in the fields of both clusters (e.g. Pandey et al. 2001; Prisinzano et al. 2004). Besides reddening, age and distance from
the Sun, in this paper we derive the core and limiting radii, and the stellar mass stored in
the core and halo subsystems. The latter parameters for NGC 3960 are derived for the first time.
This paper is organized as follows. In Sect. 2 we review previous findings on M 52 and NGC 3960. In Sect. 3 we present the 2MASS data, subtract the field-star contamination, estimate the differential reddening, derive fundamental cluster parameters, and analyse the cluster density structure. In Sect. 4 we derive luminosity and mass functions (LFs and MFs), and compute stellar content properties. In Sect. 5
we discuss the dynamical states of both OCs. In Sect. 6 we use diagnostic diagrams to analyse the structure and dynamical state of M 52 and NGC 3960 as compared to other OCs. Concluding remarks are given in Sect. 7.
![\begin{figure}
\par\includegraphics[width=8.4cm,clip]{fig1a.ps}\hspace*{-0.7mm}
\includegraphics[width=8.4cm,clip]{fig1b.ps}\end{figure}](/articles/aa/full/2006/33/aa5315-06/Timg50.gif) |
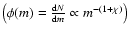
Figure 1:
 XDSS R images of M 52 ( left panel) and NGC 3960
( right panel).
XDSS R images of M 52 ( left panel) and NGC 3960
( right panel). |
| Open with DEXTER |
2 The target open clusters M 52 and NGC 3960
2.1 M 52
M 52 (NGC 7654) is a prominent OC located in the direction of Cassiopea, in an interarm
region (Fenkart & Schröder 1985). Its field is affected by a significant amount of variable reddening (e.g. Danford & Thomas 1981) and field star contamination (Sect. 3.2), consistent with its low galactic latitude (Table 1). The supergiant (SG) star
 of spectral type F7 Ib with V=8.22 and B-V=1.16 that is projected
 from the cluster center
(Sect. 3) is a probable cluster member (Schmidt 1984). Other bright stars are projected in the field of M 52. These features appear in the
DSS R image (left panel of Fig. 1). Below we summarise previous works on M 52.
from the cluster center
(Sect. 3) is a probable cluster member (Schmidt 1984). Other bright stars are projected in the field of M 52. These features appear in the
DSS R image (left panel of Fig. 1). Below we summarise previous works on M 52.
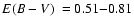
- One of the earliest studies of M 52 is that of Pesch (1960) that using UBV photolectric photometry found a non-uniform reddening varying in the range
 ,
a distance from the Sun
,
a distance from the Sun
 kpc and suggested an age similar to that of the Pleiades (135 Myr, according to WEBDA).
- Lindoff (1968) derived an age of 35 Myr for M 52.
- Schmidt (1977) using
 photometry found
 .
.
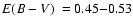
- Danford & Thomas (1981) using
photometry found
 kpc,
a mean
kpc,
a mean
 and non-uniform reddening with E(B-V) in the northern half of the
cluster field in excess of 0.11 with respect to the southern half. They found an age
intermediate between those of the
and non-uniform reddening with E(B-V) in the northern half of the
cluster field in excess of 0.11 with respect to the southern half. They found an age
intermediate between those of the  Persei cluster (70 Myr) and the
Pleiades.
Persei cluster (70 Myr) and the
Pleiades.
- Bruch & Sanders (1983) applied an empirical calibration to convert relative
to absolute mass and estimated a cluster mass of 518 .
- Lyngå (1987) classified M 52 as Trumpler type II2r, and measured an angular
diameter of
 .
.
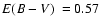
- Kaltcheva (1990) using uvby photometry found an age of 96 Myr and
mean cluster reddening of
.
- Battinelli et al. (1994) using integrated UBV photometry
found an angular diameter of 12
 ,
age 35 Myr,
,
202 member stars
and mass
,
age 35 Myr,
,
202 member stars
and mass
 .
.
- Lotkin (1994) estimated a main sequence (MS) turn-off age of
 and
and
 kpc.
kpc.
- Pandey et al. (2001) using wide field (

 )
CCD UBVIc photometry found variable reddening (
)
CCD UBVIc photometry found variable reddening (
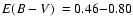 ),
),
 0.07 kpc, and a spread in age from 30 to 100 Myr. For stars with mass in the range 1.5-4.0
they found
MF
0.07 kpc, and a spread in age from 30 to 100 Myr. For stars with mass in the range 1.5-4.0
they found
MF
 slopes
  0.08 (inner region),
  0.20 (intermediate region), and
  0.07 (whole cluster). They concluded that the presence of mass segregation is consistent with the cluster's age range.
- Nilakshi et al. (2002) using photometry from Palomar Observatory Sky Survey I plates found a Galactocentric distance
 kpc, core radius
 0.08 pc
and core stellar density
0.08 pc
and core stellar density

 ,
halo radius
,
halo radius
 pc and halo stellar density

 .
.
- Kharchenko et al. (2005) derived an age of
 ,
,
 ,
,
 kpc,
kpc,
 and cluster radius of
 .
.
In WEBDA the central coordinates of M 52 are (J2000)
 ,
and
,
and
 .
However, the corresponding radial density
profile built with stars having colours consistent with the cluster's (Sect. 3.4) presented
a dip at
.
However, the corresponding radial density
profile built with stars having colours consistent with the cluster's (Sect. 3.4) presented
a dip at
 .
Consequently, we searched for a new center by examining histograms for
the number of stars in 0.5 bins of right ascension and declination. The coordinates that
maximize the central density of stars are (J2000)
.
Consequently, we searched for a new center by examining histograms for
the number of stars in 0.5 bins of right ascension and declination. The coordinates that
maximize the central density of stars are (J2000)
 ,
and
,
and
 .
In what follows we refer to these optimized coordinates as
the center of M 52. Additional cluster parameters from WEBDA are given in Table 1.
.
In what follows we refer to these optimized coordinates as
the center of M 52. Additional cluster parameters from WEBDA are given in Table 1.
2.2 NGC 3960
NGC 3960 is a moderately-rich OC projected in the 4th quadrant (Table 1).
The
DSS R image is in Fig. 1 (right panel).
Previous works on NGC 3960 are listed below.
3 The 2MASS photometry
VizieR was used to
extract J, H and
2MASS photometry in a circular area with radius
 centered on the optimized coordinates of both clusters (Table 1). As photometric quality
constraints the extraction was restricted to stars (i) brighter than the 99.9% Point
Source Catalogue Completeness Limit,
centered on the optimized coordinates of both clusters (Table 1). As photometric quality
constraints the extraction was restricted to stars (i) brighter than the 99.9% Point
Source Catalogue Completeness Limit,
 ,
,
 and
and
 ,
respectively, and (ii) with errors in J, H and
smaller than 0.2 mag. For reddening transformations we use the relations
AJ/AV=0.276,
AH/AV=0.176,
,
respectively, and (ii) with errors in J, H and
smaller than 0.2 mag. For reddening transformations we use the relations
AJ/AV=0.276,
AH/AV=0.176,
 ,
and AJ=2.76
,
and AJ=2.76
 (Dutra et al.
2002), assuming a constant total-to-selective absorption ratio RV=3.1.
(Dutra et al.
2002), assuming a constant total-to-selective absorption ratio RV=3.1.
The
 CMD of the central 10
of M 52 is in Fig. 2 (left panel). Reflecting the relatively young age a prominent, nearly vertical MS is present, together with the bright star at
CMD of the central 10
of M 52 is in Fig. 2 (left panel). Reflecting the relatively young age a prominent, nearly vertical MS is present, together with the bright star at
 and
and
 (the red SG
 ). Because of
its low latitude, field stars (mostly disc) contaminate the CMD particularly at faint magnitudes
and red colours.
). Because of
its low latitude, field stars (mostly disc) contaminate the CMD particularly at faint magnitudes
and red colours.
The intermediate-age nature of NGC 3960 is evident in the truncated MS and the presence of
a clump of red evolved stars at
 (right panel of Fig. 2). However,
conspicuous field-star contamination precludes further speculations.
(right panel of Fig. 2). However,
conspicuous field-star contamination precludes further speculations.
3.1 Differential reddening
Previous work has shown that differential reddening is present in the fields of NGC 3960 and
particularly M 52 (Sect. 2). Spatially variable reddening may introduce additional
uncertainties in the analysis, particularly with respect to the intrinsic CMD morphology. To take
this effect into account we divided the cluster fields into grids with cells of 5
width,
along right ascension and declination, extending
 in both directions. These
dimensions correspond roughly to the cluster sizes (Sect. 3.4). The 5 cell dimension
provides both spatial resolution and statistical significance in the number of stars in most cells. We illustrate this procedure in Fig. 3 for M 52. For more accurate results we work only with the stars that remain after applying the colour-magnitude filter that discards stars with non-cluster colours (Sect. 3.4). In this plot the projected stellar density of the central region of M 52 clearly detaches from the outer regions. The corresponding
cell CMDs are shown in the right panel of Fig. 3.
in both directions. These
dimensions correspond roughly to the cluster sizes (Sect. 3.4). The 5 cell dimension
provides both spatial resolution and statistical significance in the number of stars in most cells. We illustrate this procedure in Fig. 3 for M 52. For more accurate results we work only with the stars that remain after applying the colour-magnitude filter that discards stars with non-cluster colours (Sect. 3.4). In this plot the projected stellar density of the central region of M 52 clearly detaches from the outer regions. The corresponding
cell CMDs are shown in the right panel of Fig. 3.
![\begin{figure}
\par\includegraphics[width=4.5cm,clip]{fig2a.eps}\includegraphics[width=4.5cm,clip]{fig2b.eps}\end{figure}](/articles/aa/full/2006/33/aa5315-06/Timg110.gif) |
Figure 2:
CMDs of the central 10
of M 52 ( left panel) and NGC 3960
( right panel). Solid lines: fiducial lines used to derive the differential reddening (Sect. 3.1). Red stars belong mostly to the field (Sect. 3.2). Error bars are shown in the right panels of Fig. 4. |
| Open with DEXTER |
![\begin{figure}
\par\mbox{\includegraphics[width=\textwidth]{fig3a.eps}\hspace*{4cm}
\includegraphics[width=\textwidth]{fig3b.eps} }
\end{figure}](/articles/aa/full/2006/33/aa5315-06/Timg113.gif) |
Figure 3:
Left panel: spatial grid used to derive the differential reddening in M 52. Only stars with colours consistent with the cluster's (Sect. 3.4) are plotted here. North is up and East left. Right panel:
CMDs extracted from the spatial grid ( left panel). The fiducial line of the central cell is shown in all panels as a continuous line. Spatial orientation follows that in the left panel.
 and
and
 give the displacement along right ascension and declination
of the center of each cell with respect to the central cell.
give the displacement along right ascension and declination
of the center of each cell with respect to the central cell. |
| Open with DEXTER |
Table 2:
Differential reddening
 in M 52.
Table 3:
Differential reddening
 in NGC 3960.
Taking as reference the CMD of the central cell (
 )
we built a fiducial line for the MS and evolved stars that represents the mean (J-H) colour distribution in bins of 0.25 mag in J. Because bright stars are scarce (particularly in M 52), we used the respective Padova isochrone (Sect. 3.3) as a guide. The CMD fiducial lines of the central region of both clusters are shown in Fig. 2. For M 52 it is superimposed on all cell CMDs (right panel of Fig. 3). To derive the differential reddening of a given cell with respect
to the central one we applied a procedure that compares the observed CMD morphology with the fiducial line. Differences are assumed to be caused only by reddening. The procedure varies E(B-V) from -0.8 to +0.8 in steps of 0.02. The observed J and H magnitudes of all stars in the cell are corrected for each
new value of E(B-V), and the corresponding (J-H) colour is calculated. The chi-square is computed by summing the squared difference of (J-H) colour between observed point and fiducial line over all the stars in the cell. The excess reddening (
)
in each cell is the value of E(B-V) that produces the best match between fiducial line and observed colours. The resulting values of
for M 52 are given in
Table 2, where we include as well the average values of
both for the right ascension and declination bins.
)
we built a fiducial line for the MS and evolved stars that represents the mean (J-H) colour distribution in bins of 0.25 mag in J. Because bright stars are scarce (particularly in M 52), we used the respective Padova isochrone (Sect. 3.3) as a guide. The CMD fiducial lines of the central region of both clusters are shown in Fig. 2. For M 52 it is superimposed on all cell CMDs (right panel of Fig. 3). To derive the differential reddening of a given cell with respect
to the central one we applied a procedure that compares the observed CMD morphology with the fiducial line. Differences are assumed to be caused only by reddening. The procedure varies E(B-V) from -0.8 to +0.8 in steps of 0.02. The observed J and H magnitudes of all stars in the cell are corrected for each
new value of E(B-V), and the corresponding (J-H) colour is calculated. The chi-square is computed by summing the squared difference of (J-H) colour between observed point and fiducial line over all the stars in the cell. The excess reddening (
)
in each cell is the value of E(B-V) that produces the best match between fiducial line and observed colours. The resulting values of
for M 52 are given in
Table 2, where we include as well the average values of
both for the right ascension and declination bins.
As previously indicated (e.g. Danford & Thomas 1981) there is a reddening
gradient from the south towards the north through the field of M 52. With
the present data we found that
ranges from -0.08
0.05 to 0.35
0.05, and a least-squares fit to the data provides the relation

 from south to north, with a correlation coefficient
 .
With
.
With
 0.03
derived for the central region of M 52 (Sect. 3.3),
values convert to absolute
reddening values of 0.50
0.05 and 0.93
0.05, respectively. In right ascension, on the other hand, reddening is rather uniform, within uncertainties. The present values of the central and differential reddening agree with those of Danford & Thomas (1981), Kaltcheva (1990) and Pandey et al. (2001).
0.03
derived for the central region of M 52 (Sect. 3.3),
values convert to absolute
reddening values of 0.50
0.05 and 0.93
0.05, respectively. In right ascension, on the other hand, reddening is rather uniform, within uncertainties. The present values of the central and differential reddening agree with those of Danford & Thomas (1981), Kaltcheva (1990) and Pandey et al. (2001).
A similar procedure was applied to NGC 3960, and the respective values of
are given in
Table 3. Contrarily to M 52 the differential reddening is more uniform throughout
the field of NGC 3960, within the uncertainties.
ranges from -0.10
0.05 to
0.21
0.05 that, with the central value of
 0.03 (Sect. 3.3), convert to absolute reddening values of 0.03
0.05 and 0.34
0.05, respectively.
0.03 (Sect. 3.3), convert to absolute reddening values of 0.03
0.05 and 0.34
0.05, respectively.
For the subsequent analyses we corrected the photometry for the differential reddening. We note, however, that the correction was applied only to the stars located at
 from the cluster center.
3.2 Field-star decontamination
Field stars are usually an important component of wide-field CMDs, particularly of low-latitude
star clusters and/or those projected against the bulge. Their presence in the fields of M 52
and NGC 3960 is clear (Fig. 2), where they mimic an artificial sub-solar mass MS
in M 52 and a red sequence in NGC 3960. To better evaluate this effect we show in the left
panels of Fig. 4 the

 CMDs of the central 5
of M 52 (top panel) and NGC 3960 (bottom). On both CMDs we superimpose the respective field-star contribution,
extracted from the region
CMDs of the central 5
of M 52 (top panel) and NGC 3960 (bottom). On both CMDs we superimpose the respective field-star contribution,
extracted from the region
 that corresponds to the same projected
area. Most of the faint stars (
that corresponds to the same projected
area. Most of the faint stars (
 )
in M 52 and the red ones (
)
in M 52 and the red ones (
 )
in both clusters are probably field stars.
)
in both clusters are probably field stars.
To retrieve the intrinsic cluster-CMD morphology we use a field-star decontamination procedure
previously applied in the analysis of low-contrast (Bica & Bonatto 2005), young
embedded (Bonatto et al. 2006c), and young (Bonatto et al. 2006b)
OCs. In the present case we apply this procedure to the differential-reddening corrected photometry.
As the offset field we take the region
 ,
that is large enough to produce statistical representativity of the field-stars, both in magnitude and colours. The number of
stars in both offset fields is 15 000. The algorithm divides the CMD in colour/magnitude cells from which stars are randomly subtracted in a fraction consistent with the expected number of field stars. The remaining stars end up located in
CMD regions where the stellar density presents a clear excess over the field and consequently they
have a high probability of being cluster members. Because it
actually excludes stars from the original files - thus artificially changing both the radial
distribution of stars and LFs - we use field-star decontamination exclusively to derive the intrinsic CMD morphology. Further details are given in Bonatto et al. (2006b).
,
that is large enough to produce statistical representativity of the field-stars, both in magnitude and colours. The number of
stars in both offset fields is 15 000. The algorithm divides the CMD in colour/magnitude cells from which stars are randomly subtracted in a fraction consistent with the expected number of field stars. The remaining stars end up located in
CMD regions where the stellar density presents a clear excess over the field and consequently they
have a high probability of being cluster members. Because it
actually excludes stars from the original files - thus artificially changing both the radial
distribution of stars and LFs - we use field-star decontamination exclusively to derive the intrinsic CMD morphology. Further details are given in Bonatto et al. (2006b).
![\begin{figure}
\par\includegraphics[width=8.25cm,clip]{fig4.eps}\end{figure}](/articles/aa/full/2006/33/aa5315-06/Timg165.gif) |
Figure 4:
Panel a): field stars ("x'') are superimposed on the differential-reddening corrected CMD of the central 5
of M 52. Extraction areas match. Panel b): field-star decontaminated CMD. Solid line: 60 Myr Padova isochrone with
 0.1 and
 0.01. Bottom panels: same as the top panels for NGC 3960. Solid line in panel d): 1.1 Gyr Padova isochrone with
0.1 and
0.01. Bottom panels: same as the top panels for NGC 3960. Solid line in panel d): 1.1 Gyr Padova isochrone with
0.1 and
 0.01. Colour-magnitude filters used to isolate MS/evolved stars
are shown as dotted lines in panels b) and d).
0.01. Colour-magnitude filters used to isolate MS/evolved stars
are shown as dotted lines in panels b) and d). |
| Open with DEXTER |
In Table 4 we summarise the results of the decontamination procedure that quantify the
presence of field stars throughout the fields of M 52 and NGC 3960. Member stars appear
to be found up to
 from the center of M 52, while in NGC 3960 they
extend to
from the center of M 52, while in NGC 3960 they
extend to
 .
The fraction of member stars in both fields is similar,
.
The fraction of member stars in both fields is similar,
 .
The field-star decontamination was applied to the whole range
of colours and magnitudes (i.e. without discarding stars with non-cluster colours, Sect. 3.3). Consequently, the above cluster dimensions are somewhat smaller than that suggested in Fig. 3 for M 52 and those derived in Sect. 3.4 for both OCs undergoing colour-magnitude filtered photometry. This effect is better illustrated with the observed and colour-magnitude filtered radial density profiles (Fig. 5).
.
The field-star decontamination was applied to the whole range
of colours and magnitudes (i.e. without discarding stars with non-cluster colours, Sect. 3.3). Consequently, the above cluster dimensions are somewhat smaller than that suggested in Fig. 3 for M 52 and those derived in Sect. 3.4 for both OCs undergoing colour-magnitude filtered photometry. This effect is better illustrated with the observed and colour-magnitude filtered radial density profiles (Fig. 5).
Table 4:
Cluster and field-star statistics.
The field-star decontaminated CMDs of the region
 are shown in the right panels
of Fig. 4, where error bars are included to show the magnitude of the photometric
uncertainties. As expected, most of the faint stars in M 52 and red ones in NGC 3960 were
eliminated by the decontamination procedure. According to Fig. 4, M 52's
CMD morphology is typical of a cluster younger than 100 Myr with a well-developed MS spanning 5 mag, while the old age of NGC 3960 is reflected in the low turnoff and
giant branch.
are shown in the right panels
of Fig. 4, where error bars are included to show the magnitude of the photometric
uncertainties. As expected, most of the faint stars in M 52 and red ones in NGC 3960 were
eliminated by the decontamination procedure. According to Fig. 4, M 52's
CMD morphology is typical of a cluster younger than 100 Myr with a well-developed MS spanning 5 mag, while the old age of NGC 3960 is reflected in the low turnoff and
giant branch.
The colour spread in the MS of both clusters may be partly intrinsic and partly accounted for
by residual reddening, since we could not compute differential reddening for the offset field
(
 ). However, differential reddening effects in the near-IR are smaller
than in the optical, since
). However, differential reddening effects in the near-IR are smaller
than in the optical, since

 .
To further minimise this effect we work with colour-magnitude filters broad enough to include most of the colour spread of the high-probability member stars (right panels of Fig. 4).
.
To further minimise this effect we work with colour-magnitude filters broad enough to include most of the colour spread of the high-probability member stars (right panels of Fig. 4).
3.3 Cluster age and distance from the Sun
Cluster age is derived by means of solar-metallicity Padova isochrones (Girardi et al.
2002) computed with the 2MASS J, H and filters.
![\begin{figure}
\par\includegraphics[width=8.2cm,clip]{fig5.eps}\end{figure}](/articles/aa/full/2006/33/aa5315-06/Timg179.gif) |
Figure 5:
Filled circles: differential-reddening corrected + colour-magnitude filtered radial
density profiles (RDPs) of M 52 ( left panel) and NGC 3960 ( right
panel). Dashed lines: two-parameter King profile where the core size is indicated. Shaded regions:
stellar background level. For comparison purposes the RDPs prior to the colour-magnitude filtering
are shown as empty circles. |
| Open with DEXTER |
The red SG together with the rather well-defined low-MS of M 52 reaching
 constrain the age to 60
10 Myr. Parameters derived from the isochrone fit are the observed distance modulus
0.1 and colour excess
0.01, converting to
0.03. This age-solution is plotted in panel (b) of Fig. 4. The absolute distance modulus is
constrain the age to 60
10 Myr. Parameters derived from the isochrone fit are the observed distance modulus
0.1 and colour excess
0.01, converting to
0.03. This age-solution is plotted in panel (b) of Fig. 4. The absolute distance modulus is
 0.1, resulting in
 0.2 kpc. MS stars are restricted to the mass range
 .
The Galactocentric distance of M 52 is
.
The Galactocentric distance of M 52 is
 0.2 kpc,
using
0.2 kpc,
using
 kpc as the Sun's distance to the Galactic center (Reid 1993). However,
with the recently derived value of
kpc as the Sun's distance to the Galactic center (Reid 1993). However,
with the recently derived value of
 kpc (based on updated parameters of globular clusters - Bica et al. 2006), M 52 is located
 0.2 kpc from the Galactic center. M 52 is located 0.7 kpc outside the Solar circle.
For NGC 3960 we derive an age of 1.1
0.1 Gyr,
0.1 and
0.01,
corresponding to
0.03,

 and
and
 0.2 kpc (
 kpc) or
 0.2 kpc (
kpc). Either way, NGC 3960 is 0.5 kpc inside the Solar circle. Because of the 2MASS faint-magnitude limit (Sect. 3), MS stars are detected in the range
0.2 kpc (
kpc). Either way, NGC 3960 is 0.5 kpc inside the Solar circle. Because of the 2MASS faint-magnitude limit (Sect. 3), MS stars are detected in the range
 .
This age solution is shown in panel (d) of Fig. 4.
.
This age solution is shown in panel (d) of Fig. 4.
3.4 Cluster structure
Cluster structure was inferred with the radial density profile (RDP), defined as the projected
number-density of MS/evolved stars around the center. The stars were selected by applying the
respective colour-magnitude filters (right panels of Fig. 4) to the differential-reddening corrected photometry (Sect. 3.1). The use of colour-magnitude filters to discard
foreground/background field objects was previously applied in the analysis of the OCs
M 67 (Bonatto & Bica 2003), NGC 3680 (Bonatto et al. 2004c),
NGC 188 (Bonatto et al. 2005), NGC 6611 (Bonatto et al.
2006c), and NGC 4755 (Bonatto et al. 2006b). To avoid oversampling near the center
and undersampling for large radii, the RDPs were built by counting stars in concentric rings with
radius
 for
for
 ,
,
 for
for
 ,
,
 for
for
 and
and
 for
for
 .
The residual background level corresponds to the average number of stars in the
region
,
resulting in
.
The residual background level corresponds to the average number of stars in the
region
,
resulting in

 and
and

 ,
respectively for M 52 and NGC 3960.
,
respectively for M 52 and NGC 3960.
Figure 5 shows the MS/evolved stars' RDP of both clusters. For absolute comparison between clusters the radius scale was converted to parsecs and the number-density of stars to
 using the distances derived in Sect. 3.3. The statistical significance of the RDPs is indicated by the relatively small
  Poisson error bars. We also show in Fig. 5 the RDPs produced with photometry prior to the colour-magnitude filtering. Clearly, the filtered profiles present less fluctuation and reveal more of the cluster structure than the observed ones. In particular, the observed profiles tend
to underestimate the cluster's extension.
Poisson error bars. We also show in Fig. 5 the RDPs produced with photometry prior to the colour-magnitude filtering. Clearly, the filtered profiles present less fluctuation and reveal more of the cluster structure than the observed ones. In particular, the observed profiles tend
to underestimate the cluster's extension.
Table 5:
Structural parameters.
Structural parameters were derived by fitting the colour-magnitude filtered RDPs with the two-parameter King (1966a) surface density profile, which describes the intermediate and central regions of normal globular clusters (King 1966b; Trager et al. 1995). The fits were performed using a nonlinear least-squares fit routine that uses errors as weights. To minimise degrees of freedom in the fit the background level (
 )
was kept constant, corresponding to the residual values (see above). Parameters derived from the fit are King's central density of stars (
)
was kept constant, corresponding to the residual values (see above). Parameters derived from the fit are King's central density of stars (
 )
and core radius (
)
and core radius (
 ). The resulting parameters are given in Table 5 and the best-fit solutions are superimposed
on the colour-magnitude filtered RDPs (Fig. 5). The limiting radius (
). The resulting parameters are given in Table 5 and the best-fit solutions are superimposed
on the colour-magnitude filtered RDPs (Fig. 5). The limiting radius (
 )
of a cluster can be estimated by considering the fluctuations of the RDPs with respect to the background.
describes where the RDP merges into the background and for practical purposes most of the cluster stars are contained within
)
of a cluster can be estimated by considering the fluctuations of the RDPs with respect to the background.
describes where the RDP merges into the background and for practical purposes most of the cluster stars are contained within
 .
M 52 has core and limiting radii
.
M 52 has core and limiting radii  and
and  larger than those of NGC 3960, respectively (Table 5).
We also give in Table 5 parameters derived from the RDPs built with differential reddening
uncorrected photometry. The uncorrected values of
,
,
and
agree with the corrected ones, within uncertainties.
The differential reddening corrected RDPs allowed us to compute the tidal radii of M 52 and
NGC 3960 using the three-parameter King (1962) model. The results are
2.2 pc (1.6
)
and
3.7 pc (1.8
). The present ratios
 agree with those derived for bright OCs in Bonatto & Bica (2005), that are in the range 1.4-1.9.
The colour-magnitude filtering provided parameters of M 52 to be compared with
those of Nilakshi et al. (2002) and Kharchenko et al. (2005). The latter works do not apply such a filtering method. Probably because of the deep RDPs produced by the present method, our values of
and
for M 52 are about 50% smaller and larger, respectively, than those
of Nilakshi et al. (2002) and Kharchenko et al. (2005).
King's profile provides an excellent analytical representation of the stellar RDP of M 52 from the external parts to the core. Since it follows from an isothermal (virialized) sphere, the close similarity of the stellar RDP with a King profile may suggest that the internal structure of M 52 (particularly the core) has reached some
level of energy equipartition after 60 Myr (Sect. 3.3). For NGC 3960, on the other hand, King's profile fails to reproduce the innermost region, particularly in the core where there is a marked excess density of stars (Fig. 5). In this region the RDP increases almost as a straight line towards the center. This
fact may suggest post-core collapse in this 1 Gyr OC (Sect. 3.3), as seen in part of the globular clusters (Trager et al. 1995). We will return to this point in Sect. 6.
4 Luminosity and mass functions
Luminosity and mass functions
 for the core, halo and overall cluster are derived for M 52 and NGC 3960 following the methods presented in Bonatto
& Bica (2005 and references therein). To maximize the statistical significance
of field-star counts we take as the offset field the region
,
that lies
for the core, halo and overall cluster are derived for M 52 and NGC 3960 following the methods presented in Bonatto
& Bica (2005 and references therein). To maximize the statistical significance
of field-star counts we take as the offset field the region
,
that lies

 and
and
 beyond the limiting radii of M 52 and NGC 3960
(Sect. 3.4).
beyond the limiting radii of M 52 and NGC 3960
(Sect. 3.4).
To isolate MS stars we apply the colour-magnitude filters (Fig. 4) to the
differential-reddening corrected photometries (Sect. 3.1), resulting in the
MS ranges
 and
and
 ,
respectively for M 52 and
NGC 3960. The faint-magnitude limit of the MS in both clusters is brighter than that
of the 99.9% Completeness Limit (Sect. 3).
,
respectively for M 52 and
NGC 3960. The faint-magnitude limit of the MS in both clusters is brighter than that
of the 99.9% Completeness Limit (Sect. 3).
![\begin{figure}
\par\includegraphics[width=8.2cm,clip]{fig6.eps}\end{figure}](/articles/aa/full/2006/33/aa5315-06/Timg240.gif) |
Figure 6:
Overall ( top panels), halo ( middle) and core ( bottom) mass functions of M 52 ( left panels) and NGC 3960 ( right). Dashed lines: fits with
 . . |
| Open with DEXTER |
Table 6:
Parameters derived from the MFs of M 52.
To take the residual field-star contamination into account we build LFs for each cluster region and
offset field separately. J, H and LFs are built by counting stars in magnitude bins from the respective faint magnitude limit to the turn-off, for cluster and offset field regions. Magnitude
bins are wider in the upper MS than in the lower MS to avoid undersampling near the turn-off and
oversampling at the faint limit. Corrections are made for different solid angles between offset
field and cluster regions. Intrinsic LFs are obtained by subtracting the offset-field LFs
(Fig. 7); they are transformed into MFs using the mass-luminosity relations obtained from
the respective Padova isochrones and observed distance modulii (Sect. 3). These procedures are applied independently to the three 2MASS bands, and the final MFs combine the J, H and MFs. MS mass ranges are
 and
,
respectively for M 52 and NGC 3960. We note that the 1.3
low-mass limit in M 52 is consistent under contraction arguments with an age of 60 Myr. Although expected to populate the MS of a 1 Gyr-old OC, stars less massive than 0.95
cannot be detected in NGC 3960 with 2MASS mostly because of the increasing fraction of field-star contamination in that mass range (as already indicated by panel (d) of Fig. 4).
and
,
respectively for M 52 and NGC 3960. We note that the 1.3
low-mass limit in M 52 is consistent under contraction arguments with an age of 60 Myr. Although expected to populate the MS of a 1 Gyr-old OC, stars less massive than 0.95
cannot be detected in NGC 3960 with 2MASS mostly because of the increasing fraction of field-star contamination in that mass range (as already indicated by panel (d) of Fig. 4).
Figure 6 shows the overall, halo and core MFs of both clusters together with the fits with the function
,
and the MF slopes are given in Tables 6 and 7.
Both the overall and halo MFs of M 52 with slopes  0.09 and
  0.12 are slightly steeper than Salpeter's (1955) IMF (
 ). The core, however, is flatter with
  0.12. Within uncertainties the present core, halo and overall MF slopes agree with those of Pandey et al. (2001) for the equivalent mass range.
The overall MF of NGC 3960 with slope
0.22 is flatter than Salpeter's, while that of the halo ( 0.26) is similar. The core is very flat with
 0.35. The present overall MF slope is significantly flatter than that of Prisinzano et al. (2004). In M 52
and particularly NGC 3960, MF slopes increase from core to halo, which suggests mass segregation in the core. We will discuss this point further in Sect. 5.
0.35. The present overall MF slope is significantly flatter than that of Prisinzano et al. (2004). In M 52
and particularly NGC 3960, MF slopes increase from core to halo, which suggests mass segregation in the core. We will discuss this point further in Sect. 5.
4.1 Cluster mass
Parameters derived from the core, halo and overall MFs of M 52 and NGC 3960 are given in Tables 6 and 7. The number of evolved stars (Col. 2) in each cluster region was obtained by integration of the respective field-star subtracted LF for stars earlier than the turnoff. Multiplying this number by the
mass at the turn-off ( in M 52 and
  in NGC 3960) yields an estimate of the mass stored in evolved stars (Col. 3). The observed number of MS stars and corresponding mass (Cols. 5 and 6, respectively) were derived by integrating the MFs in the mass ranges
and
,
respectively for M 52 and NGC 3960.
in NGC 3960) yields an estimate of the mass stored in evolved stars (Col. 3). The observed number of MS stars and corresponding mass (Cols. 5 and 6, respectively) were derived by integrating the MFs in the mass ranges
and
,
respectively for M 52 and NGC 3960.
![\begin{figure}
\par\includegraphics[width=8.2cm,clip]{fig7.eps}\end{figure}](/articles/aa/full/2006/33/aa5315-06/Timg320.gif) |
Figure 7:
Relations involving structural parameters of OCs. Open circles: clusters
more massive than 1000 .
Squares with a dot: m<1000 .
Dotted lines: least-squares
fits to nearby clusters. Square: M 52. Triangle: NGC 3960. Shaded areas: borders
of least-squares fits. Arrows indicate lower-limit estimates of mass, density and evolutionary
parameter. Observed and extrapolated values of mass, density and evolutionary parameter of M 52
are shown. In panels d) and e) we show both determinations of
 . . |
| Open with DEXTER |
Table 7:
Parameters derived from the MFs of NGC 3960.
The total number (Col. 7) and mass (Col. 8) of the observed stars in M 52 is computed by adding the corresponding values of the evolved and MS stars. We also give in Table 6 the projected mass density (Col. 9) and volume mass density (Col. 10). This total mass estimate for M 52 should be taken as a lower limit, since we are not computing the low-mass stars still in the process of reaching the MS. On the other hand, upper-limits can be computed if we assume that stars less massive than 1.3 ,
although not detected in the 2MASS photometry, are present in the cluster in the form of PMS stars. We do this by extrapolating the MFs down to the H-burning mass limit,
 assuming Kroupa's (2001) universal Initial Mass Function (IMF), in which
  0.5 for the range
 .
For masses in the range
.
For masses in the range
 we use our values of
  which, within uncertainties are similar to the slope in Kroupa (2001) for the equivalent mass range.
The extrapolated values of number, mass, projected and volume densities are given in Cols. 7 to 10 of the third set of entries in Table 6. According to this extrapolation the core may contain about twice the observed
mass, while the total cluster mass may be a fraction of 3 larger than the observed value.
which, within uncertainties are similar to the slope in Kroupa (2001) for the equivalent mass range.
The extrapolated values of number, mass, projected and volume densities are given in Cols. 7 to 10 of the third set of entries in Table 6. According to this extrapolation the core may contain about twice the observed
mass, while the total cluster mass may be a fraction of 3 larger than the observed value.
Because of the 1.1 Gyr age, we estimate the total mass locked up in stars in NGC 3960 by taking into account all stars from the turnoff down to the H-burning mass limit,
.
For the core we extrapolate the flat MF down to
.
For the halo and overall cluster, on the other hand, we assume the universal Initial Mass Function (IMF) of Kroupa (2001). The results are given in Table 7.
We also give in Tables 6 and 7 parameters computed without the
differential-reddening correction. The results are not very sensitive to this correction, at least
in the near-IR.
The present mass determinations for M 52 are a factor 2 (observed) and
6 (extrapolated) larger than that of Bruch & Sanders (1983). The difference
in the mass estimates can be accounted for by different analytical methods. In the present case
we have based our results on colour-magnitude filtered photometry, while Bruch & Sanders (1983)
estimated mass according to an empirical relation that converts relative to absolute masses.
5 Dynamical state
5.1 M 52
Within uncertainties, the overall MF slope (
0.09) in the mass range
agrees with that of a Salpeter () IMF. However, the MF slopes present
significant spatial variations throughout the cluster, being flat (
0.12) in the core and rather steep (
0.12) in the halo (Table 6 and Fig. 6). In older clusters such spatial variation of MF slope can be accounted for by dynamical mass segregation, in the sense that low-mass stars originally in the core are transferred to the cluster's outskirts, while massive stars sink in the core. This process produces a flat core MF and a steep one in the halo (e.g. Bonatto & Bica 2005, and references therein).
Mass segregation in a star cluster scales with the relaxation time
 ,
where
,
where
 is the crossing time, N is the (total) number of stars and
  is the velocity dispersion (Binney & Tremaine 1987). The relaxation time is the
characteristic time-scale for a cluster to reach some level of energy equipartition. For a typical
is the velocity dispersion (Binney & Tremaine 1987). The relaxation time is the
characteristic time-scale for a cluster to reach some level of energy equipartition. For a typical
 (Binney & Merrifield 1998) we obtain
 4 Myr and
 0.2 Myr for the observed values; using the extrapolated values we obtain
 204 Myr and
 2.6 Myr. The 60 Myr age of M 52 (Sect. 3) corresponds to 78
 (observed) or 13
(extrapolated). Thus, some degree of MF slope flattening in the core is to be expected. However, the ratio cluster age to
(observed) or 13
(extrapolated). Thus, some degree of MF slope flattening in the core is to be expected. However, the ratio cluster age to
 drops to 2.2 (observed) or 0.2 (extrapolated) for the overall cluster, consistent with the Salpeter slope and absence of large-scale mass segregation.
5.2 NGC 3960
The flat core MF of NGC 3960 (
0.35) seems consistent with the relaxation time
 0.7 Myr, which corresponds to 10-3 of the cluster age. For the overall cluster we obtain
 63 Myr, corresponding to 0.1 of the cluster age, which might explain its sub-Salpeter (
0.22) MF. Large-scale mass segregation through the body of NGC 3960 is expected to have occurred, as well as low-mass star evaporation. NGC 3960 is dynamically
more advanced than M 52 (Sect. 6).
63 Myr, corresponding to 0.1 of the cluster age, which might explain its sub-Salpeter (
0.22) MF. Large-scale mass segregation through the body of NGC 3960 is expected to have occurred, as well as low-mass star evaporation. NGC 3960 is dynamically
more advanced than M 52 (Sect. 6).
6 Diagnostic diagrams of open cluster parameters
Bonatto & Bica (2005) derived a set of parameters related to the structure and
dynamical evolution of OCs in different dynamical states. We analysed
nearby OCs with ages in the range 70-7000 Myr and masses in
400-5300 ,
following most of the present methodology. The evolutionary parameter
 (Col. 11 of Tables 6 and 7) was found to be a good indicator of dynamical states.
In particular, significant flattening in core and overall MFs due to dynamical effects such as mass
segregation is expected to occur for
(Col. 11 of Tables 6 and 7) was found to be a good indicator of dynamical states.
In particular, significant flattening in core and overall MFs due to dynamical effects such as mass
segregation is expected to occur for
 and
and
 ,
respectively. To these clusters were added the very young OC (age 1.3 Myr) NGC 6611 (Bonatto et al. 2006c) and the young (age
,
respectively. To these clusters were added the very young OC (age 1.3 Myr) NGC 6611 (Bonatto et al. 2006c) and the young (age  Myr) NGC 4755 (Bonatto et al. 2006b).
6.1 Structural parameters
Structural parameters are dealt with in Fig. 7. Because the observed values of mass, density and evolutionary parameters of M 52 are lower limits, we plot as well the corresponding extrapolated values. For NGC 3960 we only consider the extrapolated values. The core density of NGC 3960, and particularly the extrapolated one of M 52, follow the trend presented by massive OCs for the corresponding ages (panel a). A similar trend occurs for the overall
density (panel b), particularly for the extrapolated value for M 52. Both clusters follow the
massive OC relation involving overall mass and core radius (panel c). Panels (d) and (e) appear
to suggest a correlation of
and
with
,
but the scatter of points precludes conclusions. M 52 and NGC 3960 fit in the observed correlation of core and limiting radii (panel f). About 2/3 of the sample OCs - including M 52 - seem to define a trend of increasing core radius with age (panel g), while the remaining ones - including NGC 3960 - appear to follow a sequence of decreasing
with age. Similar trends occur in the relation
with age (panel h). NGC 3960 fits in the relation of core and overall mass (panel i), while M 52 agrees at the level. Further details on parameter correlations are given in Bonatto & Bica (2005).
![\begin{figure}
\par\includegraphics[width=8.2cm,clip]{fig8.eps}\end{figure}](/articles/aa/full/2006/33/aa5315-06/Timg387.gif) |
Figure 8:
Relations involving evolutionary parameters of open clusters. Symbols as in
Fig. 7. Panels f) and i): fit of the linear-decay function
 . . |
| Open with DEXTER |
6.2 Dynamical parameters
Dynamical-evolution parameters of M 52 and NGC 3960 are compared with those of other OCs in
different dynamical states in Fig. 8. The Salpeter-like overall MF slope of M 52 is consistent with the relation of

 for massive clusters (panel a); the same is valid for NGC 3960 at the level. The core MF slope of M 52 is consistent with the expected one for its core mass (panel b) while the core of NGC 3960 seems significantly flatter. Both clusters fit in the relations involving

 (panel c),
 (panel d),
(panel e), and
(panel h). The distribution of Galactocentric distances in terms of age (panel g) indicates a correlation, as suggested by Lyngå (1982). This correlation probably reflects the average tidal disruption effect on clusters, which increases for smaller Galactocentric distances (e.g. Boutloukos &
Lamers 2003; Lamers et al. 2005).
(panel d),
(panel e), and
(panel h). The distribution of Galactocentric distances in terms of age (panel g) indicates a correlation, as suggested by Lyngå (1982). This correlation probably reflects the average tidal disruption effect on clusters, which increases for smaller Galactocentric distances (e.g. Boutloukos &
Lamers 2003; Lamers et al. 2005).
Panels (f) and (i) suggest a systematic flattening with age of the core and overall MFs, particularly for the less-massive OCs. The deviant object is the 7 Gyr, massive OC NGC 188 whose orbit avoids the inner regions of the Galaxy for most of the time (Bonatto et al. 2005, and references therein). The core and overall MFs of M 52 have slopes consistent with those of other massive OCs of similar age. NGC 3960, on the other hand, has core and overall MFs significantly flatter than those expected for its mass, although they may be consistent with its age (see below). Except for NGC 188 the age dependence of the core and overall MF slopes can be parameterised by the linear-decay function
,
where
 represents the MF slope in the early phases and
  is the flattening time scale. For the core MF we derive
 0.12 and
 0.1 Gyr (correlation coefficient
 ); the overall values are
 0.08 and
 0.5 Gyr
(
0.5 Gyr
(
 ). These relations suggest that OCs in general are formed with flat core and Salpeter-like overall MFs. At cluster birth the core MF already is much flatter than the
overall one, similarly to what was observed in e.g. NGC 6611 (Bonatto et al. 2006c).
Such early core flattening may be partly linked to primordial processes related to molecular-cloud fragmentation. Because of the cumulative effects of mass segregation, additional core MF flattening becomes significant after 100 Myr and proceeds on an approximately linear time scale of 0.9 Gyr (panel f). Flattening in the overall MF takes
). These relations suggest that OCs in general are formed with flat core and Salpeter-like overall MFs. At cluster birth the core MF already is much flatter than the
overall one, similarly to what was observed in e.g. NGC 6611 (Bonatto et al. 2006c).
Such early core flattening may be partly linked to primordial processes related to molecular-cloud fragmentation. Because of the cumulative effects of mass segregation, additional core MF flattening becomes significant after 100 Myr and proceeds on an approximately linear time scale of 0.9 Gyr (panel f). Flattening in the overall MF takes  longer to become evident and proceeds at a slower pace (panel i) than in the
core, which probably reflects the average time scale associated with low-mass evaporation, tidal stripping and encounters with giant molecular clouds. Compared to the overall cluster, harder physical conditions in the core such as high density and small relaxation time account for the fast evolution rate (Bonatto & Bica 2005, and references therein).
longer to become evident and proceeds at a slower pace (panel i) than in the
core, which probably reflects the average time scale associated with low-mass evaporation, tidal stripping and encounters with giant molecular clouds. Compared to the overall cluster, harder physical conditions in the core such as high density and small relaxation time account for the fast evolution rate (Bonatto & Bica 2005, and references therein).
The present MF flattening sequences - particularly the overall one - are defined mostly by the less-massive clusters, including NGC 3960. At least for
 Gyr, a linear-decay function provides a good analytical representation of the flattening, both for the core and overall MFs. It remains to determine the behaviour of the flattening in older clusters, whether it keeps linear until dissolution
into the field (particularly for the less-massive OCs) or saturates at some threshold value. A larger sample especially containing old OCs of any mass is required to (i) better constrain the analytical form of the less-massive OC flattening function, (ii) check whether the core and overall MFs of the massive OCs flatten in a similar way as those of the less-massive ones, and (iii) compute the core and overall MF flattening time scales.
Gyr, a linear-decay function provides a good analytical representation of the flattening, both for the core and overall MFs. It remains to determine the behaviour of the flattening in older clusters, whether it keeps linear until dissolution
into the field (particularly for the less-massive OCs) or saturates at some threshold value. A larger sample especially containing old OCs of any mass is required to (i) better constrain the analytical form of the less-massive OC flattening function, (ii) check whether the core and overall MFs of the massive OCs flatten in a similar way as those of the less-massive ones, and (iii) compute the core and overall MF flattening time scales.
7 Concluding remarks
In this paper we analyzed the structure and distribution of stars in the OCs M 52 and NGC 3960
with J, H and
2MASS photometry, restricted to stars with observational uncertainties
 mag. To derive cluster parameters we took into account the differential reddening and applied field-star decontamination and colour-magnitude filters.
Compared to previous works we found differences in some parameters, such as cluster radius,
mass and MF slopes. Most of those studies were based on spatial and magnitude-limited data. However, the discrepancies can be largely accounted for by the absence of a proper field-star
decontamination.
Reddening throughout the field of M 52 varies from
 to
to
 ,
with a marked gradient from south to north and a near uniformity in right ascension. For NGC 3960 we derive the range
,
with a marked gradient from south to north and a near uniformity in right ascension. For NGC 3960 we derive the range
 ,
uniform both in right ascension and declination. The projected area considered in both fields was
,
uniform both in right ascension and declination. The projected area considered in both fields was
 .
.
For M 52 we derived an age of 60
10 Myr, absolute distance modulus
0.1, and distance from the Sun
 0.2 kpc. For NGC 3960 we found an age of 1.1
0.1 Gyr,
0.2 kpc. For NGC 3960 we found an age of 1.1
0.1 Gyr,
 0.1, and
 0.2 kpc. M 52 is located 0.7 kpc outside the Solar circle, while NGC 3960 is 0.5 kpc inside it.
Radial density profiles built with colour-magnitude filtered photometry are much deeper and yield
more constrained OC structural parameters than the observed ones. In particular, King's model
provided an excellent fit to the differential-reddening corrected radial density profile of M 52, from the external parts to the inner region. We found core and limiting radii of
 0.14 pc and
 1.0 pc. The inner region of NGC 3960, on the other hand, presents a clear excess of the stellar density over King's profile, which may suggest post-core collapse in this 1.1 Gyr OC. Parameters derived are
 0.11 pc and
 0.8 pc. The tidal radii of M 52 and NGC 3960,
computed with the differential-reddening corrected RDPs are
2.2 pc and
3.7 pc.
0.8 pc. The tidal radii of M 52 and NGC 3960,
computed with the differential-reddening corrected RDPs are
2.2 pc and
3.7 pc.
The present use of colour-magnitude filtered photometry to build RDPs excludes a large fraction
of non-cluster stars. As a result, observed and colour-magnitude filtered RDPs present significant
differences (especially depth and shape) as shown in Fig. 5. Because of the small residual
field-star contamination in the present RDPs, they can be used to derive more realistic intrinsic
structural parameters. Nilakshi et al. (2002) built RDPs using a photographic database (DSS photometry). They pointed out that the angular size was difficult to determine accurately due to the weak contrast between cluster and field stars. Kharchenko et al. (2005) derived parameters based on stars with available proper motion, which restricts the analysis to brighter stars. For evolved clusters in which a significant fraction of low-mass stars has already been displaced from
the center outwards, their brighter cutoff photometry may explain differences, together with lower
statistics for a smaller sample of cluster stars.
The mass stored in observed stars (
)
in M 52 is
 103 ;
the core contains
103 ;
the core contains
 .
Extrapolating to the H-burning limit with Kroupa's IMF these values become
.
Extrapolating to the H-burning limit with Kroupa's IMF these values become
 103
and
103
and
 .
For NGC 3960 we derived
.
For NGC 3960 we derived
 103
and
103
and
 .
.
We conclude that both structurally and dynamically, the core and overall parameters of M 52
are consistent with those expected of an OC more massive than 1000
and 60 Myr
old. The somewhat flat core MF slope (
 )
as compared to the steeper
one at the halo (
)
as compared to the steeper
one at the halo (
 )
and the Salpeter-like overall MF
(
)
and the Salpeter-like overall MF
(
 )
suggests mild mass segregation in the inner region. This
picture is consistent with the low values of the core/overall dynamical-evolution parameters,
)
suggests mild mass segregation in the inner region. This
picture is consistent with the low values of the core/overall dynamical-evolution parameters,
 and
and
 .
.
The parameters of NGC 3960, on the other hand, suggest that this OC - particularly the core - has reached an advanced dynamical state characterised by
 and
and
 ,
respectively for the core and overall cluster. NGC 3960 presents evident signs of mass segregation in the core/halo
region, with a very flat MF slope (
,
respectively for the core and overall cluster. NGC 3960 presents evident signs of mass segregation in the core/halo
region, with a very flat MF slope (
 )
and a steeper one at the halo
(
)
and a steeper one at the halo
(
 ). Besides, the somewhat flat (compared to Salpeter) overall MF
(
). Besides, the somewhat flat (compared to Salpeter) overall MF
(
 )
suggests low-mass star evaporation through the cluster rim.
Tidal disruption due to the Galactic field may have boosted the dynamical evolution of NGC 3960,
since it is located 0.5 kpc inside the Solar circle.
)
suggests low-mass star evaporation through the cluster rim.
Tidal disruption due to the Galactic field may have boosted the dynamical evolution of NGC 3960,
since it is located 0.5 kpc inside the Solar circle.
Changes in parameters of M 52 and NGC 3960 because of differential-reddening correction are
not significant, at least in the near-IR and/or because of the reddening ranges
 (M 52) and
 (NGC 3960). With respect to the analytical methods we conclude that
colour-magnitude filters are essential to improve cluster parameters, particularly those related to structure.
(NGC 3960). With respect to the analytical methods we conclude that
colour-magnitude filters are essential to improve cluster parameters, particularly those related to structure.
Acknowledgements
We thank the referee, Dr. Nate Bastian, for helpful suggestions.
This publication makes use of data products from the Two Micron All Sky Survey, which
is a joint project of the University of Massachusetts and the Infrared Processing and
Analysis Center/California Institute of Technology, funded by the National Aeronautics
and Space Administration and the National Science Foundation. This research has made use
of the WEBDA database, operated at the Institute for Astronomy of the University of Vienna.
C.B. and E.B. aacknowledge support from the Brazilian Institution CNPq.
- Battinelli, P.,
Brandimarti, A., & Capuzzo-Dolcetta, R. 1994, A&AS, 104,
379 [NASA ADS] (In the text)
- Bica, E., &
Bonatto, C. 2005, A&A, 443, 465 [EDP Sciences] [NASA ADS] [CrossRef] (In the text)
- Bica, E., Bonatto, C.,
& Dutra, C. M. 2003, A&A, 405, 991 [EDP Sciences] [NASA ADS] [CrossRef] (In the text)
- Bica, E., Bonatto, C.,
Barbuy, B., & Ortolani, S. 2006, A&A, 450, 105 [EDP Sciences] [NASA ADS] [CrossRef] (In the text)
- Binney, J.,
& Tremaine, S. 1987, in Galactic Dynamics, Princeton, NJ:
Princeton University Press. (Princeton series in astrophysics)
(In the text)
- Binney, J.,
& Merrifield, M. 1998, in Galactic Astronomy, Princeton, NJ:
Princeton University Press. (Princeton series in astrophysics)
(In the text)
- Bonatto, C., &
Bica, E. 2003, A&A, 405, 525 [EDP Sciences] [NASA ADS] [CrossRef] (In the text)
- Bonatto, C., &
Bica, E. 2005, A&A, 437, 483 [EDP Sciences] [NASA ADS] [CrossRef] (In the text)
- Bonatto, C., Bica,
E., & Girardi, L. 2004a, A&A, 415, 571 [EDP Sciences] [NASA ADS] [CrossRef]
- Bonatto, C., Bica, E.,
& Dutra, C. M. 2004b, A&A, 422, 555 [EDP Sciences] [NASA ADS] [CrossRef] (In the text)
- Bonatto, C., Bica,
E., & Pavani, D. B. 2004c, A&A, 427, 485 [EDP Sciences] [NASA ADS] [CrossRef] (In the text)
- Bonatto, C., Bica,
E., & Santos Jr., J. F. C. 2005, A&A, 433, 917 [EDP Sciences] [NASA ADS] [CrossRef] (In the text)
- Bonatto, C., Kerber, L.
O., Santiago, B. X., & Bica, E. 2006a, A&A, 446, 121 [EDP Sciences] [NASA ADS] [CrossRef] (In the text)
- Bonatto, C., Bica, E.,
Ortolani, S., & Barbuy, B. 2006b, A&A, 453, 121 [EDP Sciences] [NASA ADS] [CrossRef] (In the text)
- Bonatto, C., Santos
Jr., J. F. C., & Bica, E. 2006c, A&A, 445, 567 [EDP Sciences] [NASA ADS] [CrossRef] (In the text)
- Boutloukos, S. G.,
& Lamers, H. J. G. L. M. 2003, MNRAS, 338, 717 [NASA ADS] [CrossRef] (In the text)
- Bragaglia,
A., Tosi, M., Carretta, E., et al. 2006, MNRAS, 366, 1493 [NASA ADS] (In the text)
- Bruch, A., &
Sanders, W. L. 1983, A&A, 121, 237 [NASA ADS] (In the text)
- Carraro, G., Ng, Y. K.,
& Portinari, L. 1998, MNRAS, 296, 1045 [NASA ADS] [CrossRef] (In the text)
- Danford, S. C., &
Thomas, J. 1981, PASP, 93, 447 [NASA ADS] [CrossRef] (In the text)
- Dias, W. S.,
Alessi, B. S., Moitinho, A., & Lépine, J. R. D. 2002,
A&A, 389, 871 [EDP Sciences] [NASA ADS] [CrossRef] (In the text)
- Dutra, C. M.,
Santiago, B. X., & Bica, E. 2002, A&A, 381, 219 [EDP Sciences] [NASA ADS] [CrossRef] (In the text)
- Fenkart, R. P., &
Schröder, A. 1985, A&AS, 59, 83 [NASA ADS] (In the text)
- Friel, E. D. 1995,
ARA&A, 33, 38 [NASA ADS] (In the text)
- Girardi, L.,
Bertelli, G., Bressan, A., et al. 2002, A&A, 391, 195 [EDP Sciences] [NASA ADS] [CrossRef] (In the text)
- Janes, K. A. 1981,
AJ, 86, 1210 [NASA ADS] [CrossRef] (In the text)
- Janes, K. A., & Phelps,
R. L. 1994, AJ, 108, 1773 [NASA ADS] [CrossRef] (In the text)
- Kaltcheva, N.
T. 1990, Ap&SS, 173, 69 [NASA ADS] (In the text)
- Kharchenko,
N. V., Piskunov, A. E., Röser, S., Schilbach, E., &
Scholz, R.-D. 2005, A&A, 438, 1163 [EDP Sciences] [NASA ADS] [CrossRef] (In the text)
- King, I. 1962, AJ,
67, 471 [NASA ADS] [CrossRef] (In the text)
- King, I. 1966a,
AJ, 71, 64 [NASA ADS] [CrossRef] (In the text)
- King, I. 1966b,
AJ, 71, 276 [NASA ADS] [CrossRef] (In the text)
- Kroupa, P.
2001, MNRAS, 322, 231 [NASA ADS] [CrossRef] (In the text)
- Lamers, H. J.
G. L. M., Gieles, M., Bastian, N., et al. 2005, A&A, 441,
117 [EDP Sciences] [NASA ADS] [CrossRef] (In the text)
- Lindoff, U. 1968, ArA,
5, 1 [NASA ADS] (In the text)
- Lotkin, A. V.,
Matkin, N. V., & Gerasimenko, T. P. 1994, Astron. Astrophys.
Trans., 4, 153 [NASA ADS] (In the text)
- Lyngå, G. 1982,
A&A, 109, 213 [NASA ADS] (In the text)
- Lyngå, G. 1987,
in Catalog of Open Cluster Data, Computer Based Catalogue available
through the CDS, Strasbourg, France and NASA DATA Center,
Greenbelt, Maryland, USA, 5th edition, 4, 121
(In the text)
- Mermilliod, J. C.
1996, in The Origins, Evolution, and Destinies of Binary Stars in
Clusters, ASP Conf. Ser., ed. E. F. Milone, & J.-C. Mermilliod,
90, 475
(In the text)
- Nilakshi,
S. R., Pandey, A. K., & Mohan, V. 2002, A&A, 383, 153 [EDP Sciences] [NASA ADS] [CrossRef] (In the text)
- Pandey, A. K.,
Nilakshi, Ogura, K., Sagar, R., & Tarusawa, K. 2001, A&A,
374, 504 [EDP Sciences] [NASA ADS] [CrossRef] (In the text)
- Pesch, P. 1960, ApJ,
132, 689 [NASA ADS] [CrossRef] (In the text)
- Prisinzano,
L., Micela, G., Sciortino, S., & Favata, F. 2004, A&A, 417,
945 [EDP Sciences] [NASA ADS] [CrossRef] (In the text)
- Reid, M. J. 1993,
ARA&A, 31, 345 [NASA ADS] (In the text)
- Salpeter, E.
1955, ApJ, 121, 161 [NASA ADS] [CrossRef] (In the text)
- Schmidt, E. G.
1977, PASP, 89, 546 [NASA ADS] [CrossRef] (In the text)
- Schmidt, E. G.
1984, ApJS, 55, 455 [NASA ADS] [CrossRef] (In the text)
- Skrutskie, M., Schneider, S. E.,
Stiening, R., et al. 1997, in The Impact of Large Scale Near-IR Sky
Surveys, ed. Garzon et al. (Netherlands: Kluwer), 210, 187
- Trager, S. C., King, I.
R., & Djorgovski, S. 1995, AJ, 109, 218 [NASA ADS] [CrossRef] (In the text)
Copyright ESO 2006
![\begin{figure}
\par\includegraphics[width=8.4cm,clip]{fig1a.ps}\hspace*{-0.7mm}
\includegraphics[width=8.4cm,clip]{fig1b.ps}\end{figure}](/articles/aa/full/2006/33/aa5315-06/img50.gif)
![\begin{figure}
\par\includegraphics[width=4.5cm,clip]{fig2a.eps}\includegraphics[width=4.5cm,clip]{fig2b.eps}\end{figure}](/articles/aa/full/2006/33/aa5315-06/img110.gif)
![\begin{figure}
\par\mbox{\includegraphics[width=\textwidth]{fig3a.eps}\hspace*{4cm}
\includegraphics[width=\textwidth]{fig3b.eps} }
\end{figure}](/articles/aa/full/2006/33/aa5315-06/img113.gif)
![\begin{figure}
\par\includegraphics[width=8.25cm,clip]{fig4.eps}\end{figure}](/articles/aa/full/2006/33/aa5315-06/img165.gif)
![\begin{figure}
\par\includegraphics[width=8.2cm,clip]{fig5.eps}\end{figure}](/articles/aa/full/2006/33/aa5315-06/img179.gif)
![\begin{figure}
\par\includegraphics[width=8.2cm,clip]{fig6.eps}\end{figure}](/articles/aa/full/2006/33/aa5315-06/img240.gif)
![\begin{figure}
\par\includegraphics[width=8.2cm,clip]{fig7.eps}\end{figure}](/articles/aa/full/2006/33/aa5315-06/img320.gif)
![\begin{figure}
\par\includegraphics[width=8.2cm,clip]{fig8.eps}\end{figure}](/articles/aa/full/2006/33/aa5315-06/img387.gif)