A&A 455, 1091-1098 (2006)
DOI: 10.1051/0004-6361:20064963
Sub arcsec evolution of solar magnetic fields
Th. Roudier1 - J. M. Malherbe2 - J. Moity2 - S. Rondi1 - P. Mein2
- Ch. Coutard2
1 - Laboratoire d'Astrophysique de l'Observatoire Midi-Pyrénées, Université Paul Sabatier
Toulouse III, CNRS, 57 avenue d'Azeirex, BP 826, 65008 Tarbes Cedex, France
2 -
LESIA, Observatoire de Paris,
Section de Meudon, 92195 Meudon, France
Received 3 February 2006 / Accepted 20 April 2006
Abstract
Context. The evolution of the concentrated magnetic field in flux tubes is one challenge of the nowadays Solar physics which requires time sequence with high spatial resolution.
Aims. Our objective is to follow the properties of the magnetic concentrations during their life, in intensity (continuum and line core), magnetic field and Doppler velocity.
Methods. We have observed solar region NOAA 0644 on 2004 July 15 at Pic du Midi observatory with the Multichannel Subtractive Double Pass (MSDP) operating mode and analysed the circular polarization of the Na D1 589.6 nm spectral line in terms of longitudinal magnetic field in 2D field of view (
 ), during 41 mn at two altitudes 327 km and 170 km in the photosphere.
Results. Our data analysis reveals that all the concentrated magnetic features are associated with downward motions and the magnetic field remains very stable during the 41 mn. At different height 327 and 170 km, a clear depth effect is visible on Doppler velocity but not in the magnetic field strength.
Key words: Sun: photosphere - Sun: granulation - Sun: magnetic fields
The quiet-Sun magnetism which is present in the form of discrete element over the Sun surface
plays an important role in the solar magnetic activity. The simulations (Sanchez Almeida
et al. 2003) point out that more than 90% of the unsigned magnetic flux
existing in their numerical data would not appear in magnetograms with 1
 angular
resolution. Thus, the existing flux in the quiet sun probably exceeds by far that carried
by active regions during the maximum of the solar cycle (Sanchez Almeida et al. 2003).
Then, one of the main goals of the solar physics today is to describe and
understand the physical and dynamical properties of the magnetic flux tubes. These features
which are elementary bricks of the magnetic field in the quiet-Sun (diameter around
100-150 km or less) require for their analysis very high spatial and temporal resolution
observations in spectro-polarimetric mode. Recent work (Rimmele 2004; Berger et al. 2004;
Rouppe et al. 2005) demonstrated the gain of the large solar telescopes, 1 m class, to learn
more about the magnetic flux tubes properties. With the high spatial resolution (0
angular
resolution. Thus, the existing flux in the quiet sun probably exceeds by far that carried
by active regions during the maximum of the solar cycle (Sanchez Almeida et al. 2003).
Then, one of the main goals of the solar physics today is to describe and
understand the physical and dynamical properties of the magnetic flux tubes. These features
which are elementary bricks of the magnetic field in the quiet-Sun (diameter around
100-150 km or less) require for their analysis very high spatial and temporal resolution
observations in spectro-polarimetric mode. Recent work (Rimmele 2004; Berger et al. 2004;
Rouppe et al. 2005) demonstrated the gain of the large solar telescopes, 1 m class, to learn
more about the magnetic flux tubes properties. With the high spatial resolution (0
 1)
of their observations, they show that weak upflows are found in the flux sheets and downflows
in the immediate surroundings and the visible appearance of the small magnetic features is
determined by their horizontal size (micro-pores, ribbon shaped and flowers).
1)
of their observations, they show that weak upflows are found in the flux sheets and downflows
in the immediate surroundings and the visible appearance of the small magnetic features is
determined by their horizontal size (micro-pores, ribbon shaped and flowers).
The purpose of our paper is to show the possibilities of the combination
of a Nematic Liquid Crystal (NLC) polarimeter with MSDP spectrograph to study the
temporal evolution of magnetic concentration with a spatial resolution of 0
3 to 0
4.
We organized the paper in two parts: the first part presents the statistical properties of
the magnetic field relatively to the Doppler velocity and intensity distribution over the
solar surface. We focus in particular on noise levels due to the reduction process. In
the second part, we consider the time evolution properties of different magnetic features,
such as magnetic concentrations and moving magnetic features (MMF).
![\begin{figure}
\par\includegraphics[width=8cm,clip]{4963fig1.ps}
\end{figure}](/articles/aa/full/2006/33/aa4963-06/Timg27.gif) |
Figure 1:
Meudon spectroheliogram in CaII K1v
(blue wing of CaII K 393.4 nm), on 2004 July 14 at 07:36 UT, showing NOAA 0644.
The black box corresponds to the MSDP field of view. |
| Open with DEXTER |
![\begin{figure}
\par\includegraphics[width=8cm,clip]{4963fig2.ps}
\end{figure}](/articles/aa/full/2006/33/aa4963-06/Timg28.gif) |
Figure 2:
SOHO/MDI magnetogram on 2004 July 15 at 06:23 UT, showing NOAA 0644.
We observed with the MSDP the eastern part of the spot (the black box corresponds to the
MSDP field of view); the magnetic field found by MDI in this spot was between -1000 and 1000 Gauss, in agreement with our results (courtesy SOHO/MDI). |
| Open with DEXTER |
We observed the active region NOAA 0644
 (East
(East
 ,
North
,
North
 )
close to the disc center,
on 15st July 2004 between 6h 34mn 46s and 7h 15mn 21s UT. The duration of the analyzed sequence
is 41 mn with a mean time step of 60 s. The exposure time was 40 ms with Camera LaVision CCD (
)
close to the disc center,
on 15st July 2004 between 6h 34mn 46s and 7h 15mn 21s UT. The duration of the analyzed sequence
is 41 mn with a mean time step of 60 s. The exposure time was 40 ms with Camera LaVision CCD (
 pixels). The observation was performed in the NaD1 line (
 5896 Å)
with the Multichannel Subtractive Double Pass (MSDP) system (designed by P. Mein) operating on the
solar spectrograph (designed by Z. Mouradian) at the focus of the 50 cm refractor of the Pic du Midi
Observatory (Lunette Jean Rosch) as described by Mein (1981) and Mein (2002).
The pixel size on the CCD camera is 0
13 and 0
1 on reduced data. The spectral resolution
is 144 mÅ and 11 channels were recorded simultaneously. The elementary field of view is
5896 Å)
with the Multichannel Subtractive Double Pass (MSDP) system (designed by P. Mein) operating on the
solar spectrograph (designed by Z. Mouradian) at the focus of the 50 cm refractor of the Pic du Midi
Observatory (Lunette Jean Rosch) as described by Mein (1981) and Mein (2002).
The pixel size on the CCD camera is 0
13 and 0
1 on reduced data. The spectral resolution
is 144 mÅ and 11 channels were recorded simultaneously. The elementary field of view is
 ,
and
,
and
 after data reduction of the whole temporal
sequence due to shifts in the pointing of the refractor. Polarization experiment setup is based on the
one described by Malherbe et al. (2004), except that the ferroelectric crystal was replaced by a new nematic crystal.
after data reduction of the whole temporal
sequence due to shifts in the pointing of the refractor. Polarization experiment setup is based on the
one described by Malherbe et al. (2004), except that the ferroelectric crystal was replaced by a new nematic crystal.
Figures 1 and 2 show the general context
of our field of view relatively to Meudon spectroheliogram and MDI/SOHO observations.
Data analysis was performed using the standard MSDP software developed by P. Mein and available on line
at the BASS2000 data base (see http://bass2000.bagn.obs-mip.fr). The different steps to analyse
for each state of polarization have been described in a previous paper (Malherbe et al. 2004).
The images were corrected for dark current and gain, rigidly aligned, destretched
and filtered for p-modes in  space (threshold phase velocity = 4 km s-1) to remove
five-minute oscillations.
space (threshold phase velocity = 4 km s-1) to remove
five-minute oscillations.
We determine the wavelength shift of each profile I+V ()
and I-V ()
using the classical bisector technique:
the wavelength shift is the shift of the middle of a chord having
a full width of
 (
(
 mÅ for the chromosphere
or
mÅ for the chromosphere
or
 mÅ for the photosphere). If we call
  the
shift of I+V and
the
shift of I+V and  the shift of I-V, the dopplershift (i.e.
the radial velocity V//, (Fig. 4)) is given by
the shift of I-V, the dopplershift (i.e.
the radial velocity V//, (Fig. 4)) is given by
 .
.
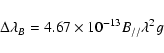
On the contrary, the Zeeman shift is proportional to
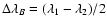 .
We calibrate the values of the magnetic field using the classical
weak field approximation, i.e.
.
We calibrate the values of the magnetic field using the classical
weak field approximation, i.e.
where B// is the magnetic field in Gauss,
 the Zeeman shift
in Å,
the wavelength of the line in Å and g the effective landé
factor of the line (1.33).
the Zeeman shift
in Å,
the wavelength of the line in Å and g the effective landé
factor of the line (1.33).
For the Sodium lines, we obtain approximately the following
correspondance between velocities and magnetic fields:
 Gauss.
According to Roudier et al. (2001), the two computed positions chords of half width 144 and 288 mÅ in the spectral line correspond to the height 327 and 170 km, values which were derived
from modelling the radiative transfer of NaD1 through the VAL-C atmospheric stratification with
no magnetic field.
![\begin{figure}
\par\includegraphics[width=12cm,clip]{4963fig3.ps}
\end{figure}](/articles/aa/full/2006/33/aa4963-06/Timg47.gif) |
Figure 3:
Effect of image accumulation on the determination of magnetic fields
( top: after summation of 20 determinations after destretching single; bottom: single
determination). The field of view is
 .
A single determination requires a couple of
images I+V and I-V. .
A single determination requires a couple of
images I+V and I-V. |
| Open with DEXTER |
![\begin{figure}
\par\includegraphics[width=11.5cm,clip]{4963fig4.ps}
\end{figure}](/articles/aa/full/2006/33/aa4963-06/Timg48.gif) |
Figure 4:
Quiet area
 at t=31 mn.
From top to bottom:
a) magnetic field B// at 144 mÅ (high photosphere). North polarities in white, South in dark;
b) intensity fluctuations (Filigree, bright features) at 144 mÅ (high photosphere);
c) line-of-sight velocity V// at 144 mÅ upflows are represented in white and downflows in dark (high photosphere);
d) continuum intensity of NaD1 (first channel of the MSDP with a small variation in wavelength giving a darker part in the bottom of that figure) (photosphere).
Isocontours of B// at 144 mÅ are plotted for
at t=31 mn.
From top to bottom:
a) magnetic field B// at 144 mÅ (high photosphere). North polarities in white, South in dark;
b) intensity fluctuations (Filigree, bright features) at 144 mÅ (high photosphere);
c) line-of-sight velocity V// at 144 mÅ upflows are represented in white and downflows in dark (high photosphere);
d) continuum intensity of NaD1 (first channel of the MSDP with a small variation in wavelength giving a darker part in the bottom of that figure) (photosphere).
Isocontours of B// at 144 mÅ are plotted for  150, 300 and 600 Gauss. Magnetic concentrations are
strongly correlated to bright features and filigree, and also to intergranular lanes (see right of the figure). 150, 300 and 600 Gauss. Magnetic concentrations are
strongly correlated to bright features and filigree, and also to intergranular lanes (see right of the figure). |
| Open with DEXTER |
The observing mode consists in bursts of
 images I+V and I-Vwith very short exposure time (40 ms) in order to reduce seeing effects.
Hence, the signal to noise ratio of individual images is small (about 100). It
can be increased after image selection, destretching and summing (Fig. 3).
images I+V and I-Vwith very short exposure time (40 ms) in order to reduce seeing effects.
Hence, the signal to noise ratio of individual images is small (about 100). It
can be increased after image selection, destretching and summing (Fig. 3).
Several calculations were done on a unique burst of
images
from which it was possible to select up to
 fairly good images
(in general it was never possible to extract more than
fairly good images
(in general it was never possible to extract more than
 to
to
 images). Before summing images, we corrected seeing induced translations and
deformations using a destretching method (November 1986).
images). Before summing images, we corrected seeing induced translations and
deformations using a destretching method (November 1986).
In order to estimate the noise on the magnetic field, we
select a small area of quiet sun, with no visible magnetic
structure, of
 (3600 pixels). In this area, the average value
of the magnetic field is almost zero, and we take the
standard deviation as an estimator of the noise.
(3600 pixels). In this area, the average value
of the magnetic field is almost zero, and we take the
standard deviation as an estimator of the noise.
We find the following results:
- at 144 mÅ, for a single determination from one couple I+V, I-V,
the noise is 60 Gauss. When we use 20 successive determinations
(within a few seconds), after destretching and summing, it reduces to 20 Gauss.
- at 288 mÅ, for a single determination from one couple I+V, I-V,
the noise is 85 Gauss. When we use 20 successive determinations
(within a few seconds), after destretching and summing, it reduces to 25 Gauss.
Obviously, when we use 20 determinations, we do not reduce the noise
by a factor sqrt(20)=4.5, but by a factor 3 only. The reason is that
the destretching procedure is not fully efficient and has an impact on
the spatial resolution of magnetic fields.
Before describing in some detail the evolution of magnetic features,
we first present the statistical properties of velocities and magnetic field
of our field of view.
Using the magnetic field as a selection criterion, we selected magnetic flux concentrations
greater than 60 Gauss, outside the sunspot (see example of Fig. 8),
in order to perform a statistical analysis of the bright features region.
Figures 5-7 can be compared
directly to Figs. 6 and 7 of Rimmele (2004) (scatter plot of B// vs. velocity and intensity for
magnetic flux concentration). For these figures positive velocity denotes downflow.
![\begin{figure}
\par\includegraphics[width=8cm,clip]{4963fig5.ps}\end{figure}](/articles/aa/full/2006/33/aa4963-06/Timg55.gif) |
Figure 5:
Velocities versus magnetic field (absolute value) at 288 mÅ (170 km), 5mn filtered for
|B//|>60 Gauss. Positive velocity denotes downflow. |
| Open with DEXTER |
In Fig. 5, like Rimmele (2004), we observe an increase of magnetic field amplitude in
the downflow. As |B//| increases, the velocities
remain stable around 0.7 km s-1 and do not turn to zero like observed by Rimmele (2004). The difference
can be attributed to the different spatial resolution of the observations and the angle of viewing
which contributes to mix the flux tube properties with those of its surrounding.
In Fig. 6, like Rimmele (2004), we find a linear increase of bright feature intensity with
the magnetic field.
Figure 7 shows scatter plot of velocity vs. intensity for the same pixels as the ones selected for
Figs. 5 and 6. A bimodal distribution is visible like Rimmele (2004) in his Fig. 7
but not with the same shape. The gray diamonds represent the high-flux points above 500 Gauss and the small
black dots represent the low-flux points with
|B//| <200 Gauss. For that last one the distribution is more
compact around 1.0 in intensity than found by Rimmele (2004) without increasing intensity for the upflowing motions.
For the high-flux points above 500 Gauss, we measure a mean velocity two times greater than found by Rimmele (2004)
and also we observe important downflows for the brightest one.
The difference between our plots and those of Rimmele (2004) can be due to the difference of spatial
resolution (0
35 for us, 0
2 for Rimmele) and to the difference, in small part, of the location
of his observation ( )
close to the disk center (our observation is done at ). The line of
sight velocities and intensities, of such small features, are affected in particular
for the small values of the magnetic field.
)
close to the disk center (our observation is done at ). The line of
sight velocities and intensities, of such small features, are affected in particular
for the small values of the magnetic field.
![\begin{figure}
\par\includegraphics[width=8cm,clip]{4963fig6.ps}
\end{figure}](/articles/aa/full/2006/33/aa4963-06/Timg57.gif) |
Figure 6:
Intensity at 144 mÅ versus magnetic field (absolute value)
at 288 mÅ (170 km) for
|B//|>60 Gauss. |
| Open with DEXTER |
![\begin{figure}
\par\includegraphics[width=8cm,clip]{4963fig7.ps}
\end{figure}](/articles/aa/full/2006/33/aa4963-06/Timg58.gif) |
Figure 7:
Velocity at 288 mÅ (170 km) versus intensity at 144 mÅ for
|B//| <200 Gauss (dots) and
|B//|>500 Gauss (diamonds).
Positive velocity denotes downflow. |
| Open with DEXTER |
The quality of our time sequence allows us to follow the properties
of the network bright features during their life.
Figures 9 and 10 show the time evolution of the
intensity (continuum and line core), magnetic field and Doppler velocity
(at 288 and 144 mÅ) of two bright features. These flux tubes are detected by
using the 144 mÅ intensity fluctuations (denoted as "core'' intensity).
In the first flux tube A (coordinates 463, 18), we note a quite constant
intensity both in the continuum and in the line core during all its life.
During all the sequence the magnetic field is always found positive
and constant around 700 Gauss and the Doppler velocity indicates a clear downflow
location with velocity -350 m/s at 144 mÅ and -700 m/s at 288 mÅ. The observed
velocity fluctuations are well correlated at different depth but do not seem to
correspond to magnetic field fluctuations (seeing effects).
The second flux tube B (coordinates 784, 43), is also quite constant in
intensity both in the continuum and in the line core during all its life.
This flux tube has always a negative magnetic field around -450 Gauss.
At t=16 mn and t=41 the different behaviours of the magnetic field at depth 288 mÅ (dot line) are not significant. The Doppler velocity are also found in majority in
the downflow location with velocity between 0 m/s and -350 m/s. Solar small fluctuations
in time are probably due to seeing effects which moves the flux tubes location (+ or -2 pixels).
There are only few measurements available for the magnetic field time evolution in
the bright feature. Indeed, this requires extremely high spatial resolution and high cadence
of magnetograms. De Pontieu (2002) describes small-scale emerging flux in the
photosphere showing an increasing magnetic flux during the emergence phase
(around 300 s) and a clear decrease in the adjacent dispersion phase
(around 420 s). The very recent work of Rouppe van der Voort et al. (2005, in their Fig. 5), shows a more or less stable magnetic field in flux tube during
at least around 15 min. The apparent magnetic field intensity fluctuations in their
figure seems to be generated by the seeing variations between the two instants of the
polarimetric measurements.
The measurement of the 20 bright features present in our field of view gives
the mean properties:
V144 = - 424 m/s and
|
B144| = 416 Gauss (
h=327 km)
V288 = - 573 m/s and
|B288| = 421 Gauss (h=170 km).
![\begin{figure}
\par\includegraphics[width=12cm,clip]{4963fig8.ps}\end{figure}](/articles/aa/full/2006/33/aa4963-06/Timg59.gif) |
Figure 8:
Observation at time t=14 mn, field of view of
 .
From top to bottom:
a) gradient of the absolute magnetic field between 144 and 288 mÅ. Positive gradient
(increasing field with height) in white, negative in dark;
b) magnetic field at 288 mÅ (170 km), after destretching and summing 20 pairs of images I+V, I-V. North polarities in white, South in dark;
c) magnetic field at 144 mÅ (327 km), after destretching and summing 20 pairs of images I+V, I-V;
d) intensity at 144 mÅ showing bright features and filigree, with the
gradient of the absolute value of the magnetic field
(this is the difference between the absolute value of the magnetic field at 144 and 288 mÅ, after reduction of the size of the
pixel to 1
in order to reduce the noise). Isocontours for 13 Gauss, 40 Gauss, .
From top to bottom:
a) gradient of the absolute magnetic field between 144 and 288 mÅ. Positive gradient
(increasing field with height) in white, negative in dark;
b) magnetic field at 288 mÅ (170 km), after destretching and summing 20 pairs of images I+V, I-V. North polarities in white, South in dark;
c) magnetic field at 144 mÅ (327 km), after destretching and summing 20 pairs of images I+V, I-V;
d) intensity at 144 mÅ showing bright features and filigree, with the
gradient of the absolute value of the magnetic field
(this is the difference between the absolute value of the magnetic field at 144 and 288 mÅ, after reduction of the size of the
pixel to 1
in order to reduce the noise). Isocontours for 13 Gauss, 40 Gauss,
 Gauss, Gauss,  Gauss, Gauss,  Gauss, Gauss,  Gauss, Gauss,  Gauss, Gauss,  Gauss, Gauss,
 Gauss, Gauss,  Gauss) with positive gradient (magnetic field increasing with height in absolute
value) for black and negative gradient (magnetic field decreasing with height) for white;
e) intensity at 144 mÅ showing bright features and filigree, with isocontours
of the the magnetic field
(isocontours for Gauss) with positive gradient (magnetic field increasing with height in absolute
value) for black and negative gradient (magnetic field decreasing with height) for white;
e) intensity at 144 mÅ showing bright features and filigree, with isocontours
of the the magnetic field
(isocontours for  Gauss, Gauss,  Gauss, Gauss,  Gauss, Gauss,  Gauss, Gauss,  Gauss, Gauss,
 Gauss, Gauss,
 Gauss, Gauss,
 Gauss, Gauss,
 Gauss, Gauss,
 Gauss). Gauss). |
| Open with DEXTER |
In the quiet area (see right of Fig. 8), the magnetic field does not vary significantly with height
(a few % only), but in bright features it has the tendency to increase gently with altitude,
except for the Moving Magnetic Feature (MMF) present near the sunspot. In any case, the gradient is small in bright
features and never exceeds 10 to 15% of the magnitude of the magnetic field. In the spot, the
situation is quite different, because the magnetic field decreases strongly with height, -200 Gauss
in comparison to a magnitude of 800 Gauss, thus 25% or more, corresponding to a gradient of
the order of 1 G/km. This Fig. 8 can be related to Figs. 1 and 4 of Eibe et al.
(2002) and the results seem to be in good agreement.
From a theoretical point of view, models predict an expansion of magnetic flux
tubes over height range of 300 km with a decrease of the magnetic field amplitude
(Solanki et al. 1999). This decrease is generally computed in models from various authors
(Bercik et al. 2002; Sheylag et al. 2004; Vögler et al. 2005)
and gives a decrease lying between 200 and 300 Gauss depending of the model
between the height of 327 and 170 km, corresponding to the heights of our observation.
In our previous work (Malherbe et al. 2004), the mean intensity of the magnetic field
measured in magnetic concentrations at 288 mÅ (170 km) and 144 mÅ (327 km) were 945 and 480 Gauss (absolute value) respectively, which was a decrease with the altitude compatible (or slightly greater) with model predictions.
In our data, we observe a clear depth effect on Doppler velocity but not in the magnetic
amplitude between the same altitudes at 327 and 170 km. The difference found between these
observations cannot be explained by the location of the target on the sun which are quite
identical in term of viewing angle, or by the sunspot ages (5 days for Malherbe et al. 2004, one
and between 5 to 15 days for the present one).
The magnetic structures width could be smaller in the wings of the line than in line core, as found
by Mein et al. (2006). We have noticed that at different locations the size of magnetic features at 288 mÅ is smaller or equal to the size of magnetic features at 144 mÅ. For a given image quality
(seeing) this could imply a smaller filling factor at the altitude of formation of the line wings than
in the line core which could lead to under evaluate the magnetic field. Then, this could be an explanation
of the invariance of the magnetic field with altitude that we oberve. Another possibility is that we observe
intrinsic properties of flux tube in which magnetic field decrease more slowly in altitude than expected
in active region. In addition, Rimmele (2004) indicates also a slower expansion rate with altitude than
predicted by Solanki et al. (1999).
![\begin{figure}
\par\includegraphics[width=12cm]{4963fig9.ps}
\end{figure}](/articles/aa/full/2006/33/aa4963-06/Timg60.gif) |
Figure 9:
Magnetic bright feature (A) time evolution, coordinates (463, 18) where V// <0 (downward)
and B// >0. B// in Gauss and V// in m/s. In the bottom plots, dot and solid lines represent
depth at 288 and 144 mÅ respectively. |
| Open with DEXTER |
![\begin{figure}
\par\includegraphics[width=12cm,clip]{4963fig10.ps}
\end{figure}](/articles/aa/full/2006/33/aa4963-06/Timg61.gif) |
Figure 10:
Magnetic bright feature (B) time evolution, coordinates (784, 43) where V//<0 (downward) and
B// <0. B// in Gauss and V// in m/s. In the bottom plots, dot and solid lines represent
depth at 288 and 144 mÅ respectively. |
| Open with DEXTER |
The simulations produce magnetic fields whose structures are very similar to magnetic
Sun (Stein et al. 1999; Cattaneo 1999; Emonet & Cattaneo 2001; Stein & Nordlund 2002;
Stein et al. 2002; Bercik et al. 2002; Stein & Nordlund 2003; Stein et al. 2003; Sheylag et al. 2004;
Komenko et al. 2005; Vögler et al. 2005). In particular, the numerically simulated
magnetograms are in good agreement with those observed on the sun (Sanchez Almeida et al. 2003).
Models strongly suggest that non-stationary velocities to be present in mature flux tubes
although strong downflows can exist during the field concentration phase (see Rimmele 2004).
However, models also predict, thin sheets of downflowing plasma at the egde of the flux tube.
Such events have been recently observed with high spatial resolution observations by Rimmele (2004) and
Rouppe van der Voort et al. (2005).
More precisely, the latter authors found that the plasma in magnetic elements is basically
at rest and sometimes, upflows at  150 m/s within localized concentrations of
small magnetic features. The stronger downflows are observed, like Rimmele, in narrow sheets
at the edges of the flux sheets.
150 m/s within localized concentrations of
small magnetic features. The stronger downflows are observed, like Rimmele, in narrow sheets
at the edges of the flux sheets.
In our observations, we do not observe the small upflows or plasma at rest in the flux tube
which is probably due to our spatial resolution around 0
35. The diffraction limit of
the telescope leads to mixing of information, as explained by Rimmele (2004), within the flux
tube and its surrounding where the downflows are strong. From our observation, we find that
each magnetic feature is associated with a strong and concentrated downflow which is in
good agreement with the simulation of Stein et al. (2002). The bright feature evolution shows a fairly
constant magnetic field along the sequence duration, while downflows may be stable or vary
(Figs. 9 and 10).
Regarding now the time evolution of the magnetic field, Stein et al. (2003) show that the surface
magnetic field saturate about one turnover time for their computational domain (around 60 mn)
although local dynamo action must exihibit an amplification phase followed by a diffusion
process to reconnect and alter the magnetic field and by a recirculation to continue the process.
Our measurement during 41 mn, of mature flux tubes, does not allow to give any more information
about the alteration of these flux tubes by the local convection. The magnetic field in the
measured flux tubes is always found fairly constant during all the sequence, this
is probably due to our observation of mature flux tubes. The shortness of our time sequence
does not allow us to describe all the time evolution of flux tube, longer sequences are necessary
for that goal.
![\begin{figure}
\par\includegraphics[width=12cm,clip]{4963fig11.ps}
\end{figure}](/articles/aa/full/2006/33/aa4963-06/Timg63.gif) |
Figure 11:
Time evolution of different parameters of the Moving Magnetic Feature (MMF):
B// in Gauss and V// in m/s.
Top left: MMF displacement in arcsec during the sequence;
top right: MMF magnetic field at 144 mÅ time evolution which is fairly constant
during the sequence;
bottom left: core intensity time evolution of the MMF which is is constant during the sequence;
bottom right: MMF Doppler velocity at 144 mÅ, time evolution. We note strong modification of the downflow amplitude between -0.6 km s-1 to -1.2 km s-1 during the sequence.
|
| Open with DEXTER |
![\begin{figure}
\par\includegraphics[width=12.5cm,clip]{4963fig12.ps}
\end{figure}](/articles/aa/full/2006/33/aa4963-06/Timg65.gif) |
Figure 12:
Moving Magnetic Feature (MMF), dark feature, time evolution (magnetic field). Field of view is
 ,
time step is 2 mn. North polarities in white, South in dark. ,
time step is 2 mn. North polarities in white, South in dark. |
| Open with DEXTER |
Let us examine the case of a particular solar magnetic feature during our
time sequence Fig. 12. A moving magnetic feature (MMF) is well visible
in the penumbra of the spot, with opposite magnetic polarity.
During the 41 mn of the sequence, the intensity of the MMF
at 144 mÅ remains almost constant, so that this feature is
easy to detect and horizontal motions can be determined
precisely. The horizontal drift velocity can be considered as a constant,
Fig. 11, of 0.8 km s-1. With such horizontal velocity, this MMF
corresponds to the faster class of the MMF described by Zhang et al. (2003)
with velocity greater than superganular outflow (0.5 km s-1).
On the contrary, the line-of-sight velocity derived from dopplershifts (see figure) is
not constant and lies in the range -0.6 to -1.2 km s-1 remaining always
downward motions. The magnetic field
does not exhibit significant variations around a mean value
of -300 Gauss (South Polarity, sunspot of North Polarity). The noise in quiet
regions was estimated at about 50-60 Gauss, here the noise is higher
because it is very hard to follow exactly the same pixel with
a time resolution of 1 mn due to seeing fluctuations.
The detection and the measurement of the magnetic field in the flux tubes is one
challenge of the nowadays Solar physics. Several authors (Koschinsky et al. 2001;
Domìnguez Cerdeña et al. 2003; Rimmele 2004; Berger et al. 2004; Stangl & Hirzberger 2005;
Rouppe van der Voort et al. 2005) have recently performed magnetic field measurements
at very high spatial resolution. However, due to the difficulty to get time sequence
with constant high quality, few of them had the possibility to observe the temporal
evolution of magnetic flux tubes which are highly linked to the turbulent-convective
plasma. The quality of our time sequence allows us to follow
the properties of the magnetic concentrations during their life, in intensity (continuum
and line core), magnetic field and Doppler velocity at two altitudes 327 km and 170 km in the photosphere.
A detailed examination of all the bright features visible
(in the NaD1 line) in our field of view reveals that all these features are always associated
with downflow motions. In our observations, we do not observe the small upflows or plasma at rest
in the flux tube and the stronger downflows, like Rimmele (2004), in narrow sheets at the edges
of the flux sheets, which is probably due to our spatial resolution around 0
35. From our
observation, we derived the mean properties of the flux tubes during their life.
During all the sequence the magnetic field is found more or less constant
like the intensity both in the continuum and in the line core. The observed velocity fluctuations
are well correlated at different depth but do not seem to correspond to magnetic field fluctuations
(seeing effects). This low fluctuation of the magnetic intensity is probably due to our observation of mature flux tubes.
From measurement of 20 bright features present in our field of view, we derived the mean properties
at the height 327 km of the velocity field
 m/s and absolute magnetic field value
B = 416 Gauss, and at 170 km
m/s and absolute magnetic field value
B = 416 Gauss, and at 170 km
 m/s and B = 421 Gauss. In our previous work (Malherbe et al. 2004),
the mean intensities of the magnetic field measured in magnetic concentrations at 170 km and 327 km were 945 and 480 Gauss respectively, which was a decrease with altitude compatible (or slightly
greater) with model prediction (Solanki et al. 1999). In our present analysis, we observe a clear depth
effect on Doppler velocity but not in the magnetic amplitude between the same altitudes at 327 and 170 km. The difference found between these observations is probably related to the difference of filling
factor of the magnetic structure at the two considered altitudes or due to the intrinsic properties
of flux tubes in different active regions.
m/s and B = 421 Gauss. In our previous work (Malherbe et al. 2004),
the mean intensities of the magnetic field measured in magnetic concentrations at 170 km and 327 km were 945 and 480 Gauss respectively, which was a decrease with altitude compatible (or slightly
greater) with model prediction (Solanki et al. 1999). In our present analysis, we observe a clear depth
effect on Doppler velocity but not in the magnetic amplitude between the same altitudes at 327 and 170 km. The difference found between these observations is probably related to the difference of filling
factor of the magnetic structure at the two considered altitudes or due to the intrinsic properties
of flux tubes in different active regions.
We are aware of the small statistic of bright features and the limitation of the conclusion concerning
flux tubes evolution properties deduced from this study and Malherbe et al. (2004). Both observations
have been performed in quiet sun close to active region. The next step now is to measure the time
evolution of the magnetic concentrations in the quiet sun at the disk centre of the Sun, from the birth
to the death of concentrated magnetic features, over a large field of view to get a significant
statistics. We hope to achieve this goal in 2007 with the improvement of the guiding system of our telescope.
New temporal sequences are necessary at higher spatial resolution and with better spectral resolution
in order to improve the determination of magnetic field gradients. New multislit beam shifters with 50 mÅ of spectral resolution will be available in the future in our spectrograph to acheive this goal.
Images and movies can be found at: http://helios.obspm.fr/malherbe/papers/04JUL15/index.html
More information about experiment setup (polarimeter, spectrograph, detector)
are given by http://helios.obspm.fr/malherbe/papers/index.html
Acknowledgements
This work was supported by the Centre National de la Recherche
Scientifique (CNRS, UMR 5572 and FRE 2461) and the Programme National Soleil
Terre (PNST). Special thanks are due to the Pic du Midi Observatory
staff for their technical assistance.We thank M. Rieutord for useful advice
and comments. We wish also to thank the anonymous referee
for helpfull comments and suggestions that improved the manuscript.
- Bercik, D. J.,
Nordlund, Å., & Stein, R. F. 2002, in Proceedings of SOHO
12 / GONG+ 2002. Local and global helioseismology: the present and
future, 27 October-1 November 2002, Big Bear Lake, CA, USA, ed. H.
Sawaya-Lacoste, ESA SP-517 (Noordwijk, Netherlands: ESA
Publications Division), 201
(In the text)
- Berger, T. E.,
Rouppe van der Voort, L. H. M., Löfdahl, M. G., et al. 2004,
A&A, 428, 613 [EDP Sciences] [NASA ADS] [CrossRef] (In the text)
- Cattaneo,
F. 1999, ApJ, 515, 39 [NASA ADS] [CrossRef] (In the text)
- De Pontieu,
B. 2002, ApJ, 569, 474 [NASA ADS] [CrossRef] (In the text)
- Domìnguez
Cerdeña, I., Kneer, F., & Sànchez Almeida, J. 2003,
ApJ, 582, L55 [NASA ADS] [CrossRef] (In the text)
- Eibe, T., Aulanier,
G., Faurobert, M., Mein, P., & Malherbe, J.-M. 2002, A&A,
381, 290 [EDP Sciences] [NASA ADS] [CrossRef] (In the text)
- Emonet, Th.,
& Cattaneo, F. 2001, ApJ, 560, L197 [NASA ADS] [CrossRef] (In the text)
- Komenko, E.
V., Sheylag, S., Solanki, S. K., & Vögler, A. 2005,
A&A, 442, 1059 [EDP Sciences] [NASA ADS] [CrossRef] (In the text)
-
Koschinsky, M., Kneer, F., & Hirzberger, J. 2001, A&A, 365,
588 [EDP Sciences] [NASA ADS] [CrossRef] (In the text)
- Malherbe,
J.-M., Roudier, Th., Mein, P., Moity, J., & Muller, R. 2004,
A&A, 427, 745 [EDP Sciences] [NASA ADS] [CrossRef] (In the text)
- Mein, P. 1981,
Proceedings of the japan france seminar on solar physics (Henoux
and Moriyama Editors), 285
(In the text)
- Mein, P. 2002,
A&A, 381, 271 [EDP Sciences] [NASA ADS] [CrossRef] (In the text)
- Mein, P., et al.
2006, A&A, submitted
(In the text)
- November,
L. 1986, Appl. Opt. 25(3), 392
- Rimmele, T.
R. 2004, ApJ, 604, 906 [NASA ADS] [CrossRef] (In the text)
- Roudier, Th.,
Eibe, M. T., Malherbe, J. M., et al. 2001, A&A, 368, 652 [EDP Sciences] [NASA ADS] [CrossRef] (In the text)
- Rouppe van der
Voort, L. H. M., Hansteen, V. H., Carlsson, M., et al. 2005,
A&A, 435, 327 [EDP Sciences] [NASA ADS] [CrossRef] (In the text)
- Sanchez
Almeida, J., Emonet, T., & Cataneo, F. 2003, ApJ, 585, 536 [NASA ADS] [CrossRef] (In the text)
- Sheylag, S.,
Schussler, M., Solanki, S. K., Berdyugina, S. V., &
Vögler, A. 2004, A&A, 427, 335 [EDP Sciences] [NASA ADS] [CrossRef] (In the text)
- Solanki, S.
K., Finsterle, W., Rüedi, I., & Livingston, W. 1999,
A&A, 347, 27 [NASA ADS] (In the text)
- Stangl, S.,
& Hirzberger, J. 2005, A&A, 432, 319 [EDP Sciences] [NASA ADS] [CrossRef] (In the text)
- Stein, R. F.,
Georgobiani, D., Bercik, D. J., Brandenburg, A., & Nordlund,
Å. 1999, Stellar Structure: Theory and Test of Connective
Energy Transport, ASP Conference Series, 173, ed. A. Gimenez, E. F.
Guinan, & B. Montesinos (San Francisco: Astronomical Society of
the Pacific), 193
(In the text)
- Stein, R. F.,
& Nordlund, Å. 2002, Solar Surface Magneto-Convection and
Dynamo Action, in Magnetic Coupling of the Solar Atmosphere, IAU
Coll., 188, ESA Publ. SP-505, 83
(In the text)
- Stein, R. F.,
Bercik, D., Nordlund, Å., & Aring. 2002, Solar Convection
and Magneto-Convection Simulations, Il Nuovo Cimento C, Geophys.
Space Phys., 25, 513
(In the text)
- Stein, R. F.,
& Nordlund, Å. 2003, Solar Surface Magneto-Convection, in
Modeling Stellar Atmospheres, ed. N. Piskunov, W. W. Weiss, &
D. F. Gray, ASP IAU Symp., 210, 169
(In the text)
- Stein, R. F.,
Bercik, D., & Nordlund, Å. 2003, in Current Theoretical
Models and High Resolution Solar Observations: Preparing for ATST,
ed. A. A. Pevtsov, & H. Uitenbroek, ASP Conf. Ser., 286,
121
(In the text)
- Vögler, A.,
Sheylag, S., Schüssler, M., et al. 2005, A&A, 429,
335 [EDP Sciences] [NASA ADS] [CrossRef] (In the text)
- Zhang, Jun,
Solanki, S. K., Wang, & Jingxiu 2003, A&A, 399, 755 [EDP Sciences] [NASA ADS] [CrossRef] (In the text)
Copyright ESO 2006
![\begin{figure}
\par\includegraphics[width=8cm,clip]{4963fig1.ps}
\end{figure}](/articles/aa/full/2006/33/aa4963-06/img27.gif)
![\begin{figure}
\par\includegraphics[width=8cm,clip]{4963fig2.ps}
\end{figure}](/articles/aa/full/2006/33/aa4963-06/img28.gif)
![\begin{figure}
\par\includegraphics[width=11.5cm,clip]{4963fig4.ps}
\end{figure}](/articles/aa/full/2006/33/aa4963-06/img48.gif)
![\begin{figure}
\par\includegraphics[width=8cm,clip]{4963fig5.ps}\end{figure}](/articles/aa/full/2006/33/aa4963-06/img55.gif)
![\begin{figure}
\par\includegraphics[width=8cm,clip]{4963fig6.ps}
\end{figure}](/articles/aa/full/2006/33/aa4963-06/img57.gif)
![\begin{figure}
\par\includegraphics[width=8cm,clip]{4963fig7.ps}
\end{figure}](/articles/aa/full/2006/33/aa4963-06/img58.gif)
![\begin{figure}
\par\includegraphics[width=12cm,clip]{4963fig8.ps}\end{figure}](/articles/aa/full/2006/33/aa4963-06/img59.gif)
![\begin{figure}
\par\includegraphics[width=12cm]{4963fig9.ps}
\end{figure}](/articles/aa/full/2006/33/aa4963-06/img60.gif)
![\begin{figure}
\par\includegraphics[width=12cm,clip]{4963fig10.ps}
\end{figure}](/articles/aa/full/2006/33/aa4963-06/img61.gif)
![\begin{figure}
\par\includegraphics[width=12cm,clip]{4963fig11.ps}
\end{figure}](/articles/aa/full/2006/33/aa4963-06/img63.gif)