A&A 455, 645-652 (2006)
DOI: 10.1051/0004-6361:20065194
E. Vanhollebeke1 - J. A. D. L. Blommaert1 - M. Schultheis2 - B. Aringer3 - A. Lançon4
1 - Instituut voor Sterrenkunde,K.U.Leuven,
Celestijnenlaan 200B,3001 Leuven,Belgium
2 - CNRS UMR6091, Observatoire de Besançon,
BP 1615, 25010 Besançon, France
3 - Institut für Astronomie,Türkenschanzstrasse 17,1180 Wien,Austria
4 - Observatoire Astronomique,11 rue de l'Université,67000 Strasbourg,France
Received 13 March 2006 / Accepted 18 April 2006
Abstract
Context. Based on the expansion velocities of their circumstellar shells, Galactic centre (GC) OH/IR stars can be divided into two groups that are kinematically different and therefore believed to have evolved from different stellar populations.
Aims. We studied the metallicity distribution of the OH/IR stars population in the GC on the basis of a theoretical relation between EW(Na), EW(Ca), and EW(CO) and the metallicity.
Methods. For 70 OH/IR stars in the GC, we obtained near-IR spectra. The equivalent line-widths of Na I, Ca I, 12CO(2, 0), and the curvature of the spectrum around 1.6 ![]() m due to water absorption were determined.
m due to water absorption were determined.
Results. The near-IR spectrum of OH/IR stars is influenced by several physical processes. OH/IR stars are variable stars suffering high mass-loss rates. The dust that is formed around the stars strongly influences the near-IR spectra and reduces the equivalent line-widths of Na,i And Ca I. A similar effect is caused by the water content in the outer atmosphere of the OH/IR star. Because of these effects, it is not possible to determine the metallicities of these stars with our low-resolution near-infrared spectroscopy.
Key words: stars: AGB and post-AGB - stars: late-type - stars: mass-loss - Galaxy: bulge - Galaxy: center - infrared: stars
Lindqvist et al. (1992a) studied the spatial and kinematic properties of
their OH/IR sample and divided the stars into two groups on the basis
of their outflow velocities. The OH/IR stars with low expansion
velocities (
![]() km s-1) have a larger spread in
latitude and a larger velocity dispersion with respect to the Galactic
rotation than the group with higher expansion velocities. This was
also found by Baud et al. (1981) for OH/IR stars in the Galactic
disk. The low-expansion velocity stars are expected to be older
objects with larger peculiar motions, whereas the other group may have
a different formation history; it might be a later addition to the GC,
possibly via a merger. The outflow velocity of the circumstellar shell
is related to the luminosity of the star and to the properties of the
dust in the circumstellar shell (Elitzur et al. 2003; Habing et al. 1994).
km s-1) have a larger spread in
latitude and a larger velocity dispersion with respect to the Galactic
rotation than the group with higher expansion velocities. This was
also found by Baud et al. (1981) for OH/IR stars in the Galactic
disk. The low-expansion velocity stars are expected to be older
objects with larger peculiar motions, whereas the other group may have
a different formation history; it might be a later addition to the GC,
possibly via a merger. The outflow velocity of the circumstellar shell
is related to the luminosity of the star and to the properties of the
dust in the circumstellar shell (Elitzur et al. 2003; Habing et al. 1994).
Several groups have been searching for the infrared counterparts of the OH maser sources (Blommaert et al. 1998; Wood et al. 1998; Ortiz et al. 2002; Jones et al. 1994). It would be expected that the "older'' stars have lower luminosities than the high-expansion group. Blommaert et al. (1998) found that the high expansion velocities group contains higher luminosity stars but that there was also a large overlap in the luminosity distributions of the 2 groups. Ortiz et al. (2002) also compared the measured luminosities using a larger number of stars and did not find any evidence of a distinction on the basis of luminosities between the 2 groups. The disadvantage of the latter study is that the luminosities were not corrected for variability and that the luminosities spread over a wider range. Nevertheless, it seems that the differences in luminosities between the 2 groups, if they exist, are not very big. If the luminosity is not sufficient for explaining the differences in expansion velocities then it is expected that differences in the gas-to-dust ratios and thus metallicities of the stars must exist. It was demonstrated by Wood et al. (1992) for OH/IR stars in the Large Magellanic Cloud and by Blommaert et al. (1993) for OH/IR stars in the outer Galaxy that the expansion velocities are low, even though the OH/IR stars have high luminosities. In both the LMC and in the outer Galaxy, it is expected that the stars indeed have low metallicities. The next logical step would be to investigate the metallicities of GC OH/IR stars.
Schultheis et al. (2003) obtained near-IR spectra of 107 sources with mid-infrared excess selected from the ISOGAL survey (Omont et al. 2003), including 15 OH/IR sources. With an empirical formula based on the near-infrared spectroscopy of K and M giants (Ramírez et al. 2000; Frogel et al. 2001), Schultheis et al. (2003) tentatively estimated [Fe/H] for all of the ISOGAL sources. Although Schultheis et al. (2003) indicate that the Ramírez et al. (2000) formula does not actually measure metallicity for an individual spectrum of a strongly variable star, it was found that it might still be used to find an average metallicity.
In this paper we discuss our attempt to apply the results of Schultheis et al. (2003) on medium-resolution near-IR spectra on a sample of GC OH/IR stars. We take a look at the influence of the water content on the atomic lines Na I and Ca I, discuss how periodicity can influence the water content and therefore also the near-IR spectrum, and we study a grid of dust models and show that hot dust also has an influence on the near-IR spectrum.
The sample, observations, and data-reduction are described in the next section. In Sect. 3, we explain our method of analysis and compare spectra we have in common with other authors. The problems one encounters analysing near-IR spectra of OH/IR stars will be discussed in Sect. 4. Finally in Sect. 5 we summarise and come to the conclusions.
The sample consists of 70 OH/IR stars located in the GC region. Almost all stars were selected from Lindqvist et al. (1992b) and Sjouwerman et al. (1998). Our sample also includes the 15 OH/IR stars observed by Schultheis et al. (2003) so that we can compare our results and investigate the effect of the variability of this type of stars. We also selected the three "high-velocity'' OH/IR stars that were detected in the direction of the GC (van Langevelde et al. 1992). As we wanted to apply the metallicity versus EW(Na), EW(Ca), and EW(CO) calibration used in Ramírez et al. (2000) and Frogel et al. (2001) to our sample, we also observed 11 stars from Ramírez et al. (1997, K-band spectra of 43 luminosity class III stars from K0 to M6) and Ramírez et al. (2000, K-band spectra of more than 110 M giants in the Galactic bulge (GB)). Finally, to investigate the effects of the variability of our long period variable stars (LPVs) on our analysis, we measured variable stars from Lançon & Wood (2000, spectra of cool, mostly variable, giant, and supergiant stars) (see Tables A.1-Table A.3).
The near-IR spectra were obtained with the 3.58 m NTT (ESO) at la Silla, Chile
between June 28-30, 2003 using the red grism of the SOFI
spectrograph. This resulted in spectra from 1.53 ![]() m up to 2.52
m up to 2.52
![]() m. Before the actual spectrum was obtained, the instrument was
used in imaging mode to acquire the star in the slit. Several spectra
were taken with the star in different places along the slit. Standard
stars of spectral types O to G were observed as close as possible to
the object stars' airmass in order to correct for telluric absorption
features.
m. Before the actual spectrum was obtained, the instrument was
used in imaging mode to acquire the star in the slit. Several spectra
were taken with the star in different places along the slit. Standard
stars of spectral types O to G were observed as close as possible to
the object stars' airmass in order to correct for telluric absorption
features.
The data was reduced using the ESO-Munich Image Data Analysis
System (ESO-MIDAS). The images were first corrected for cosmic ray
hits. Several spectra of the same target along the slit were obtained
and subtracted from each other to correct for the sky level. The
images were flat-fielded using dome flats. A Gaussian fit
perpendicular to the dispersion direction was used to subtract a
one-dimensional spectrum out of the two-dimensional image: columns
that
fall within the FWHM of the Gaussian fit were added to the
spectrum (3-4 columns on average). A correction for distortion along
the slit was unnecessary. During the extraction process, a correction
for bad pixels was made,
they were left out of the spectrum, and no averaging was done around these
pixels. The wavelength calibration was based on the spectrum of a
xenon lamp. This image was also flat-fielded using the dome flats and
corrected for bad pixels in the same way as the other spectra. The
wavelength calibration resulted in a dispersion of typically 10.13
Å/pixel and
![]() .
.
The standard stars
were reduced in the same way. Thereafter they were divided by the
Kurucz-model that corresponds to each one's spectral type. The resulting
curve was used to correct the objects for telluric lines and also to
correct for the instrumental response function. Different curves for
different airmasses were made in order to correct for the airmass.
The dereddening law used is based on Cardelli et al. (1989), ![]() values came from Schultheis et al. (1999). The resulting spectra are
shown in Figs. B.1 to B.8.
values came from Schultheis et al. (1999). The resulting spectra are
shown in Figs. B.1 to B.8.
Table 1: Definition of band passes for continuum and features (Schultheis et al. 2003).
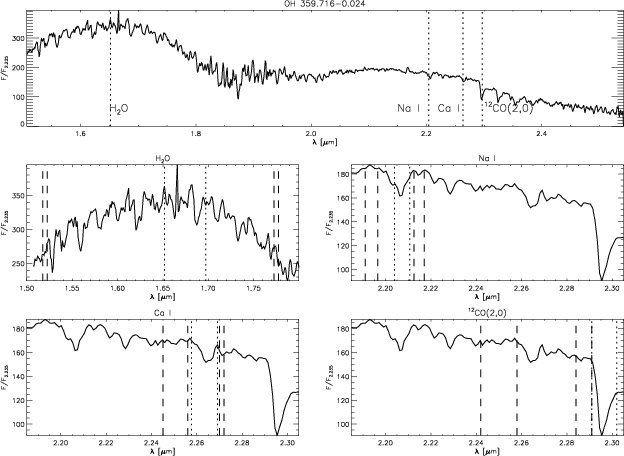 |
Figure 1: An overview of the chosen definition of band passes for continuum and features. The top figure shows the overall spectrum for a typical OH/IR stars. The dotted lines indicate the central positions of the features. The other 4 figures show for each line the selected passband for the feature (dotted lines) and the selected passband for the continuum (dashed lines). (For the 12CO(2, 0) the feature's first dotted line overlaps with the last dashed line from the continuum.) |
| Open with DEXTER | |
Ramírez et al. (1997) discuss how the equivalent-width
measurements of Na I and Ca I in medium-resolution
spectra contain contributions from other elements such as Sc, Ti, V,
Si, and S. Thus, it turns out that a significant contribution of the
Na I and Ca I features is due to other species. In the
studied spectral region (1.53-2.52 ![]() m), the CN molecule causes a
noisy continuum (Origlia et al. 1993), introducing a pseudo-continuum
opacity, which is clearly shown in the high-resolution spectrum of RX
Boo (an M8 III star) in Wallace & Hinkle (1996). According to
Ramírez et al. (1997), the continuum bands that were used to determine
the EW(Ca) are affected by CN absorption for stars with
m), the CN molecule causes a
noisy continuum (Origlia et al. 1993), introducing a pseudo-continuum
opacity, which is clearly shown in the high-resolution spectrum of RX
Boo (an M8 III star) in Wallace & Hinkle (1996). According to
Ramírez et al. (1997), the continuum bands that were used to determine
the EW(Ca) are affected by CN absorption for stars with
![]() <
3000 K. However, synthetic CN spectra based on hydrostatic
MARCS models for giant stars (for a description of such
models see Aringer et al. (1997), in our case we assumed
<
3000 K. However, synthetic CN spectra based on hydrostatic
MARCS models for giant stars (for a description of such
models see Aringer et al. (1997), in our case we assumed
![]() [cm/s
2]) = 0.0, solar mass, and elemental abundances) show
that CN is important in all cool objects below 4000 K, and even gets
weaker below 3000 K.
[cm/s
2]) = 0.0, solar mass, and elemental abundances) show
that CN is important in all cool objects below 4000 K, and even gets
weaker below 3000 K.
The effective temperature has a strong impact
on the Ca I and Na I features: as
![]() decreases, the
equivalent widths of both features increase. Tables
A.4, A.5, and A.6 give an overview of what the respective Na I,
Ca I,
and 12CO(2, 0) lines in a medium-resolution spectrum are
really made of. The tables are based on the high-resolution spectrum
of RX Boo in Wallace & Hinkle (1996). For cooler
oxygen-rich stars (Lançon & Wood 2000), such as OH/IR stars, H2O absorption, instead of CN absorption, becomes very important (see
Sect. 4.3).
decreases, the
equivalent widths of both features increase. Tables
A.4, A.5, and A.6 give an overview of what the respective Na I,
Ca I,
and 12CO(2, 0) lines in a medium-resolution spectrum are
really made of. The tables are based on the high-resolution spectrum
of RX Boo in Wallace & Hinkle (1996). For cooler
oxygen-rich stars (Lançon & Wood 2000), such as OH/IR stars, H2O absorption, instead of CN absorption, becomes very important (see
Sect. 4.3).
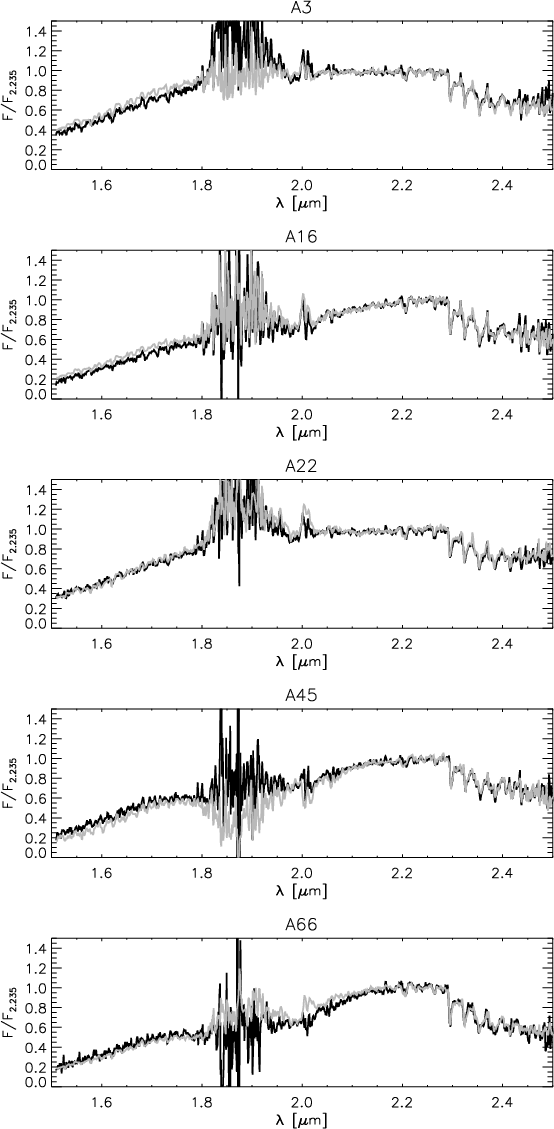 |
Figure 2:
RGB stars in common with Schultheis et al. (2003); black
line: this work, gray line: Schultheis et al. (2003). The features
between 1.8 and 1.9 |
| Open with DEXTER | |
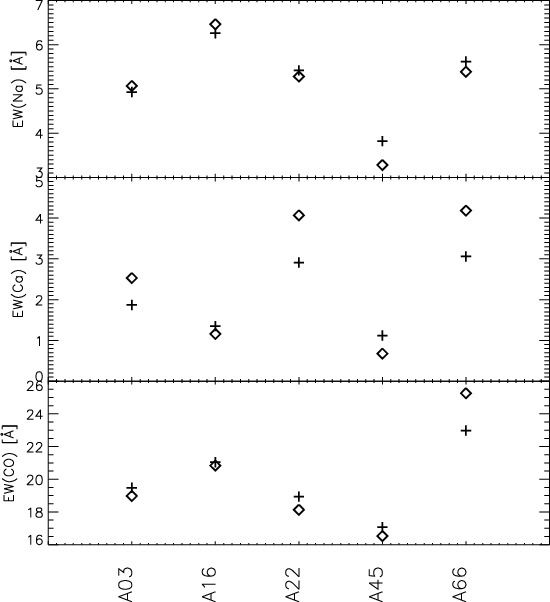 |
Figure 3: Equivalent line width measurements for the candidate RGB stars in common with Schultheis et al. (2003). The plus-signs are taken from Schultheis et al. (2003), the diamonds from this work. |
| Open with DEXTER | |
We have 5 candidate Red Giant Branch (RGB) stars in common with Schultheis et al. (2003). These candidate RGB stars are probably genuine ones, since we see no significant difference between the Schultheis et al. (2003) observations of these stars and our own. Stars on the RGB are expected to show weak variations compared to OH/IR stars and Miras.
Schultheis et al. (2003) observed the
stars with the same instrument (SOFI), using the same grism. This
results in spectra with the same resolution as our spectra. The
time difference between these observations is about 3 years. The spectra
(normalised at 2.235 ![]() m) are compared in Fig. 2, and Table 2 gives the mean values and standard deviations for the
stars we have in common. The absolute average differences in equivalent
line widths for these RGB stars are consistent with scatter due to
formal errors (
m) are compared in Fig. 2, and Table 2 gives the mean values and standard deviations for the
stars we have in common. The absolute average differences in equivalent
line widths for these RGB stars are consistent with scatter due to
formal errors (![]() 1 Å). One
expects these errors to come from data-reduction issues and changing of
observing conditions during the night. The
absolute average differences are:
1 Å). One
expects these errors to come from data-reduction issues and changing of
observing conditions during the night. The
absolute average differences are:
![]() Å for EW(Na),
Å for EW(Na),
![]() Å for EW(Ca), and 0
Å for EW(Ca), and 0
![]() Å for EW(CO) (see also
Fig. 3).
Å for EW(CO) (see also
Fig. 3).
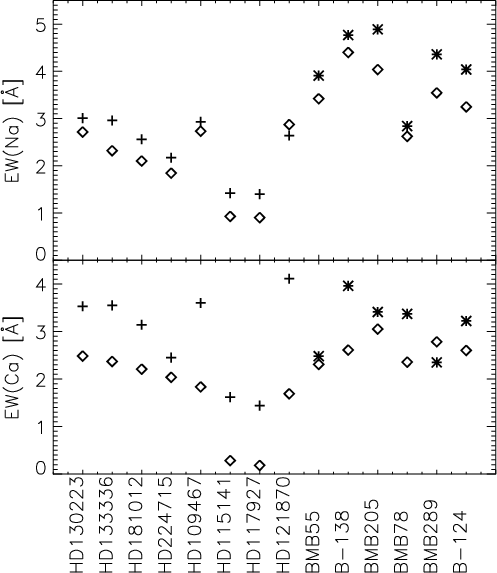 |
Figure 4: Equivalent line width measurements for the stars in common with Ramírez et al. (1997) and Ramírez et al. (2000). The plus-signs are taken from Ramírez et al. (1997), the stars are from Ramírez et al. (2000) and the diamonds are from this work. |
| Open with DEXTER | |
We have 8 late-type giants in common with Ramírez et al. (1997) and
6 red giants situated in the Bulge with Ramírez et al. (2000). A
comparison was only made for EW(Na) and EW(Ca), since
Ramírez et al. (1997) uses different continuum pass bands for obtaining
EW(CO). Tables 3 and 4 give the mean values for the compared
equivalent line widths. The absolute average differences with
Ramírez et al. (1997) are: 0.39
![]() 0.13 Å for EW(Na) and 1.29
0.13 Å for EW(Na) and 1.29 ![]() 0.41 Å for EW(Ca). The
absolute average differences with Ramírez et al. (2000) are 0.59
0.41 Å for EW(Ca). The
absolute average differences with Ramírez et al. (2000) are 0.59 ![]() 0.23 Å for EW(Na) and 0.66
0.23 Å for EW(Na) and 0.66 ![]() 0.35 Å for EW(Ca). The
difference in EW(Na) (Ramírez et al. 2000,1997) and EW(Ca)
(Ramírez et al. 2000) is again consistent with scatter due to formal
errors. There is no obvious reason why the difference for EW(Ca)
(Ramírez et al. 1997) is larger than
0.35 Å for EW(Ca). The
difference in EW(Na) (Ramírez et al. 2000,1997) and EW(Ca)
(Ramírez et al. 2000) is again consistent with scatter due to formal
errors. There is no obvious reason why the difference for EW(Ca)
(Ramírez et al. 1997) is larger than ![]() 1 Å (see also Fig. 4), although we
have to keep in mind that there is a difference in resolution between
our spectra and the spectra of Ramírez et al. (2000,1997), which
can influence the difference between the measured equivalent line
widths. The data from Ramírez et al. (2000) can be downloaded from the
internet. After rebinning the data to our lower resolution, the
following values could be measured:
1 Å (see also Fig. 4), although we
have to keep in mind that there is a difference in resolution between
our spectra and the spectra of Ramírez et al. (2000,1997), which
can influence the difference between the measured equivalent line
widths. The data from Ramírez et al. (2000) can be downloaded from the
internet. After rebinning the data to our lower resolution, the
following values could be measured:
![]() for the EW(Na) and
for the EW(Na) and
![]() for the EW(Ca), which resembles the values we
found better (see Table 3). A similar
test for Ramírez et al. (1997) could not be done.
for the EW(Ca), which resembles the values we
found better (see Table 3). A similar
test for Ramírez et al. (1997) could not be done.
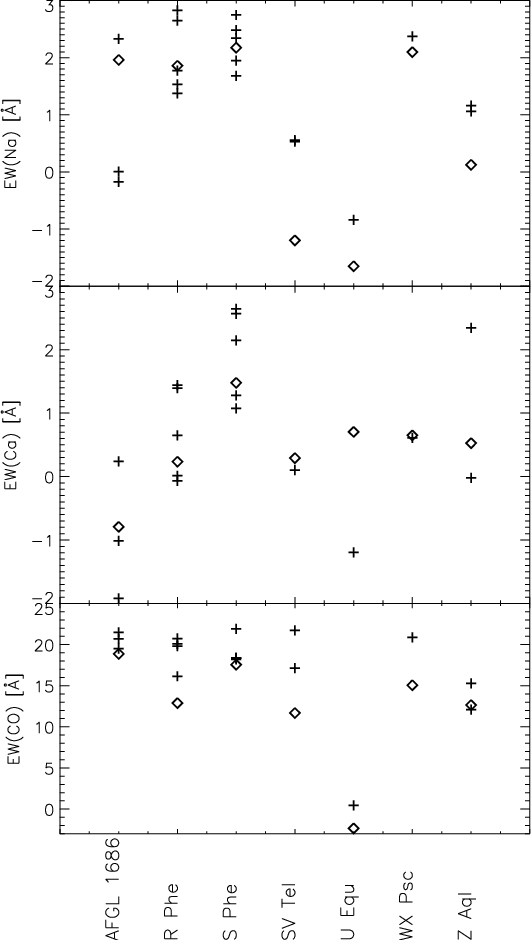 |
Figure 5: Variations in the equivalent widths for stars in common with Lançon & Wood (2000). The plus-signs indicate values taken from Lançon & Wood (2000), the diamonds those from this work. |
| Open with DEXTER | |
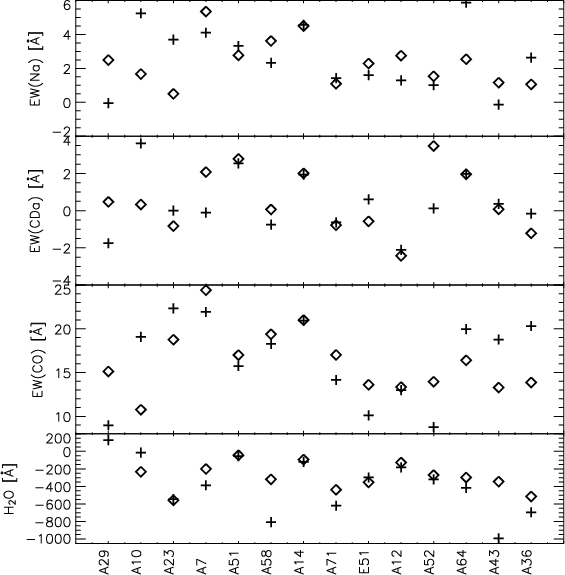 |
Figure 6: Equivalent line-width measurements for the OH/IR stars in common with Schultheis et al. (2003). The plus-signs indicate values taken from Schultheis et al. (2003), the diamonds those from this work. |
| Open with DEXTER | |
We have 7 luminous cool stars in common with Lançon & Wood (2000).
Three of these stars (WX Psc, AFGL 1686, and U Equ) are OH/IR stars
(Lançon & Wood 2000), which (not situated in the GC) are
used as a comparison for the equivalent line width measurements. The
4 other stars have periods
in the range of 120 to 270 days. Some of the stars were observed
several times by Lançon & Wood (2000). The differences in equivalent
line widths between the measurements based on the available spectra of
Lançon & Wood (2000) and our measurements are shown
in Fig. 5. The differences seen in
this plot are large in
comparison with the differences seen in Figs. 3 and 4, especially
for EW(CO), and can not be
explained by formal errors alone. The variability of the stars is
responsible for the large variations in the equivalent line widths
(see Sect. 4.4). Our measured equivalent
line widths do fall within the range of equivalent line widths based
on the spectra of Lançon & Wood (2000, see Fig. 5#. We can expect that the OH/IR
stars that we have in common with Schultheis et al. (2003) will show
similar variations in their equivalent line widths, as illustrated
in Fig. 6. The mean
absolute differences for the OH/IR stars in common with Schultheis et al. (2003)
concerning the equivalent line widths are: 1.56 ![]() 1.17 Å for
EW(Na), 1.14
1.17 Å for
EW(Na), 1.14 ![]() 1.16 Å for EW(Ca), 3.60
1.16 Å for EW(Ca), 3.60 ![]() 2.47 Å for
EW(CO) and 171.81
2.47 Å for
EW(CO) and 171.81 ![]() 193.03 Å for the water
absorption. These variations are caused by the variability of these
OH/IR stars, as will be explained in the following section.
193.03 Å for the water
absorption. These variations are caused by the variability of these
OH/IR stars, as will be explained in the following section.
Table 2: Mean values for the equivalent line widths for the stars in common with Schultheis et al. (2003).
Table 3: Mean values for the equivalent line widths for the stars in common with Ramírez et al. (1997).
Table 4: Mean values for the equivalent line widths for the stars in common with Ramírez et al. (2000).
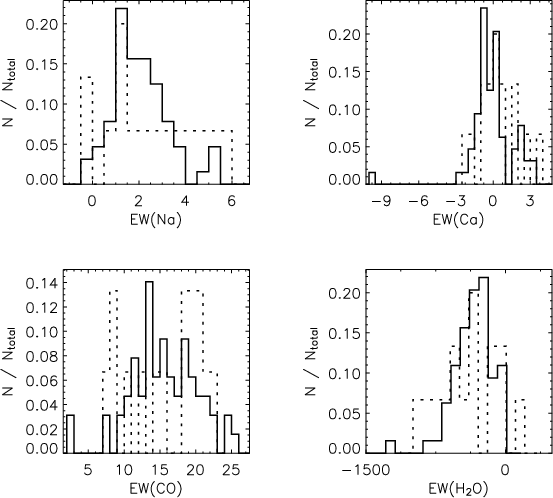 |
Figure 7: Histograms for EW(Ca), EW(Na), EW(CO) and the water absorption for the OH/IR stars from this work (full line) and the OH/IR stars from Schultheis et al. (2003) (dotted line). All x-axes are in the same unit Å. |
| Open with DEXTER | |
 |
Figure 8: OH/IR star for which the Na I and Ca I lines could not be measured. The dotted lines indicate the Na I feature and the dashed lines the selected continuum points. The dashed-dotted lines indicate the Ca I feature with its corresponding continuum (dashed-triple-dotted). |
| Open with DEXTER | |
Figure 7 gives an overview of the equivalent line
widths for Na I, Ca I, and 12CO(2, 0) (see
Sect. 3.1 and Table 1). The
fourth histogram also gives the amount of
water. Only the OH/IR stars are considered in this figure. Notice that
the EW(Na), EW(Ca), EW(CO), and the EW(H2O) are all in the same unit
Å. The EW(H2O) are all negative values, indicating water absorption
in the spectrum around 1.6 ![]() m, as can be seen from the spectra of
the OH/IR stars in Fig. B.1. A negative value for
EW(Ca) and EW(Na) indicates that the line could not been measured,
since we
do not expect these lines in emission. Figure 8
gives an example of this. It is especially clear for Ca I why
the feature could not be measured: the second continuum band pass shows
a very deep feature, which causes the flux measurement in the feature
to be higher than in the continuum. This is also the case for the
Na I feature, but here the first continuum band pass causes it
(less clear than for the Ca I feature).
m, as can be seen from the spectra of
the OH/IR stars in Fig. B.1. A negative value for
EW(Ca) and EW(Na) indicates that the line could not been measured,
since we
do not expect these lines in emission. Figure 8
gives an example of this. It is especially clear for Ca I why
the feature could not be measured: the second continuum band pass shows
a very deep feature, which causes the flux measurement in the feature
to be higher than in the continuum. This is also the case for the
Na I feature, but here the first continuum band pass causes it
(less clear than for the Ca I feature).
Figure 2 in Ramírez et al. (2000) gives a 1-5 Å range for EW(Ca) and
a 2-6 Å range for EW(Na) for a sample of red giants in the
GB. Figure 7 shows that
our ranges for the equivalent widths for both Ca I and
Na I are lower. Histograms for the equivalent line widths of
Na I, Ca I, and 12CO(2, 0), while the water
amount for the 15 OH/IR stars in Schultheis et al. (2003)
is also shown in Fig. 7 (dotted line). Their
average equivalent widths are: 0.42 ![]() 1.56 Å for EW(Ca), 2.50
1.56 Å for EW(Ca), 2.50
![]() 1.90 Å for EW(Na), and 16.01
1.90 Å for EW(Na), and 16.01 ![]() 5.16 Å for EW(CO). The
equivalent widths for the OH/IR stars in this work are: 0.08
5.16 Å for EW(CO). The
equivalent widths for the OH/IR stars in this work are: 0.08 ![]() 1.88 Å for EW(Ca), 2.11
1.88 Å for EW(Ca), 2.11 ![]() 1.27 Å for EW(Na), and 15.60
1.27 Å for EW(Na), and 15.60 ![]() 4.69 Å for EW(CO). The largest difference is seen for EW(Ca); a lot
of the OH/IR stars in this work and in Schultheis et al. (2003) have no
measurable Ca I lines.
4.69 Å for EW(CO). The largest difference is seen for EW(Ca); a lot
of the OH/IR stars in this work and in Schultheis et al. (2003) have no
measurable Ca I lines.
The equivalent line widths of Na I, Ca I, and 12CO(2, 0) are determined as described in Sect. 3.1. The values in Tables A.1, A.2, and A.3 are given in Å. A positive value indicates absorption and a negative value indicates emission. One immediately notices all the negative values for EW(Ca). One does not expect the Ca I and the Na I lines to be in emission. Inspecting the spectra for these stars (Figs. B.1 to B.4) shows that for a lot of stars the Ca I lines seem to disappear in the continuum. This effect is also noticeable for Na I in some stars.
In the rest of this section we discuss the physical effects that can lead to the Ca I and sometimes the Na I to appearing in emission.
| |
Figure 9:
Equivalent line widths for the different models. The x-axis
indicates the mass-loss rate, and the y-axis the equivalent line
widths for Na I ( left) and Ca I ( right). The different
symbols indicate the different dust temperatures. Crosses:
|
| Open with DEXTER | |
OH/IR stars are AGB stars in their final phase on the AGB that are
believed to be progenitors of Planetary Nebulae
(e.g. Habing 1996; Cohen et al. 2005).
These stars have high mass-loss rates between
![]() and
and
![]() .
It is likely that the dust formed around the star
has an influence on the near-IR spectrum (Tej et al. 2003).
.
It is likely that the dust formed around the star
has an influence on the near-IR spectrum (Tej et al. 2003).
To study the effect of dust on the Na I and Ca I lines, the dust
radiative transfer model of Groenewegen (1993) was used. In this
model, the radiative transfer equation and the radiative equilibrium
equation for the dust are solved simultaneously in spherical
geometry (Groenewegen et al. 1994). For the dust properties we assume
silicate dust (Volk & Kwok 1988) of radius a=0.02 ![]() m and a specific dust density of
m and a specific dust density of
![]() g/ cm3. As the
input model we used a blackbody
with
g/ cm3. As the
input model we used a blackbody
with
![]() K and with the Ca I and Na I lines
imposed upon it. A dust-to-gas ratio of
K and with the Ca I and Na I lines
imposed upon it. A dust-to-gas ratio of
![]() and an outflow
velocity of v = 15 km s-1 were assumed. For a grid of
mass-loss and dust temperature the models indicate the
influence of dust on these lines. Typical AGB mass-loss rates (between
and an outflow
velocity of v = 15 km s-1 were assumed. For a grid of
mass-loss and dust temperature the models indicate the
influence of dust on these lines. Typical AGB mass-loss rates (between
![]() and
and
![]() )
and dust
temperatures (
)
and dust
temperatures (
![]() and 750 K) were used. The
model with no mass-loss is used as a reference model.
and 750 K) were used. The
model with no mass-loss is used as a reference model.
Figure 9 shows the effect of the increasing dust amount
on the equivalent line widths of Na I and Ca I. For both
lines a similar trend can be seen in which the equivalent line widths
decrease for increasing mass-loss rates. The effect is stronger
for higher dust temperatures, except at the
![]() mass-loss
rate where the Na I and Ca I lines become undetectable for
the three dust temperatures. This effect is also stronger with increasing
wavelength and affects the Ca I more than the Na I.
Unfortunately, we do know neither the
temperature of the dust, nor the mass-loss rate for
our individual sources. We can only demonstrate here the possible influence
of the dust on the measured near-infrared spectrum.
Surprisingly, negative values for EW(Ca) were measured for these
models. This is
merely due to the chosen continuum: the change in the continuum's
slope is so drastic that it causes negative equivalent line-width
measurements.
mass-loss
rate where the Na I and Ca I lines become undetectable for
the three dust temperatures. This effect is also stronger with increasing
wavelength and affects the Ca I more than the Na I.
Unfortunately, we do know neither the
temperature of the dust, nor the mass-loss rate for
our individual sources. We can only demonstrate here the possible influence
of the dust on the measured near-infrared spectrum.
Surprisingly, negative values for EW(Ca) were measured for these
models. This is
merely due to the chosen continuum: the change in the continuum's
slope is so drastic that it causes negative equivalent line-width
measurements.
These effects are reflected in Fig. 10
where the EW(Ca) and the EW(Na) can be seen in comparison with our
determination of the water absorption. We see that the RGB stars, with
little water absorption, have higher EW(Ca) and the EW(Na) values
than the LPVs and OH/IR stars. This effect seems stronger for
Ca I where we basically have no more
detections for EW(H2O) below -300 Å. For the
Na I line the decrease is more gradual with increasing water
absorption. Of course the effect of dust and other factors
(such as pulsation amplitude,
![]() )
on the spectra is also
included in these figures and cannot be distinguished from the effect
that the water absorption has.
)
on the spectra is also
included in these figures and cannot be distinguished from the effect
that the water absorption has.
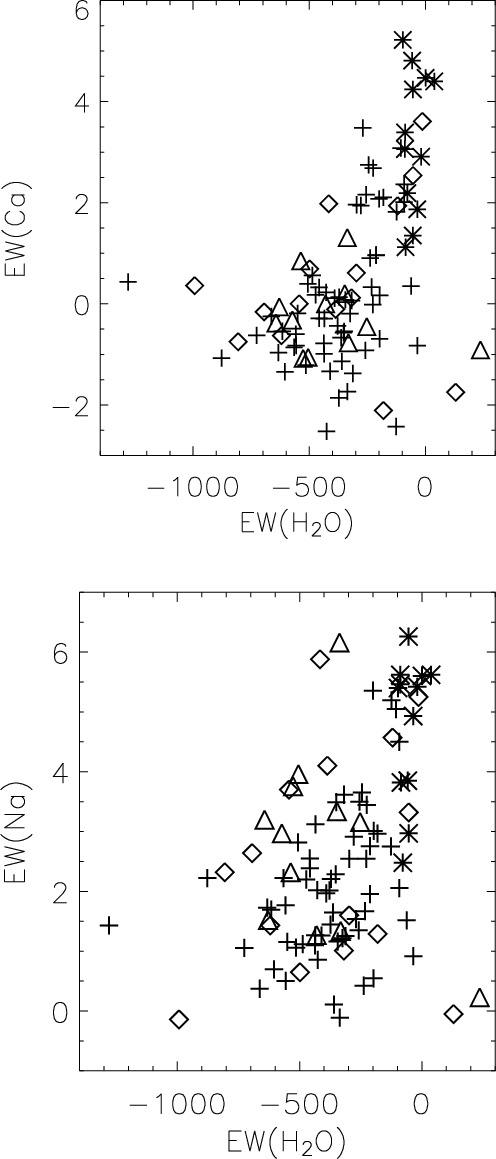 |
Figure 10: Upper panel: EW(Ca) vs. EW(H2O), lower panel: EW(Na) vs. EW(H2O). The OH/IR in this work are the crosses, RGB (Schultheis et al. 2003): stars, OH/IR (Schultheis et al. 2003): diamonds, LPV (Schultheis et al. 2003): triangles. All equivalent line widths are given in the same unit Å. |
| Open with DEXTER | |
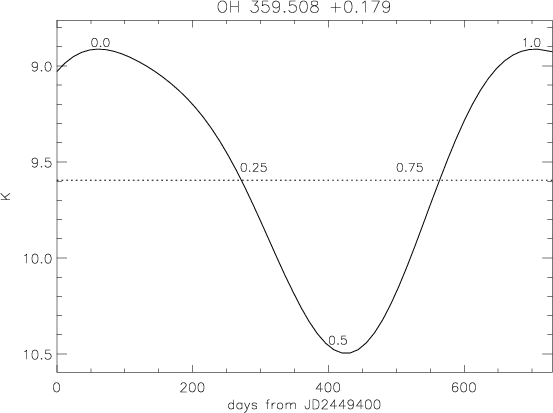 |
Figure 11:
Determination of the phase |
| Open with DEXTER | |
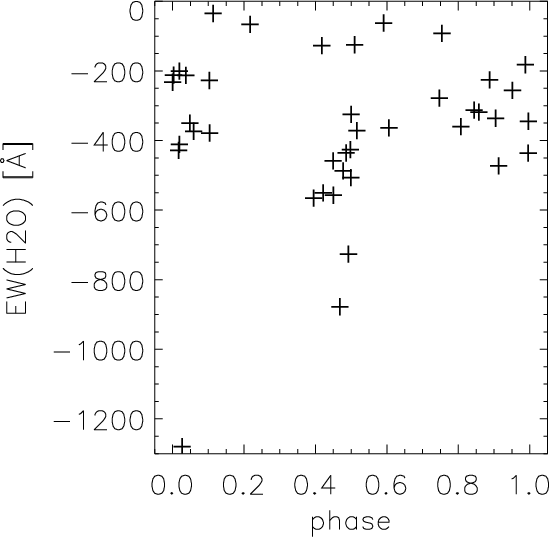 |
Figure 12: The phase at time of observation versus the equivalent line width of water absorption. |
| Open with DEXTER | |
Figure 6 shows the differences in the measured absorption for water clearly for the stars we have in common with Schultheis et al. (2003). The water absorption is expected to be largely correlated with the phase for a given star: the most intense water features are seen at minimum light (Tej et al. 2003; Lançon & Wood 2000; Bessell et al. 1996).
Wood et al. (1998) determined periods for 80
GC OH/IR stars. We retrieved K light curves for 41 out of
the 50 stars
in common with our sample. The lightcurves were extrapolated using the
fundamental period and the first harmonic (Wood 2004) to
determine the phase (=![]() when the star was observed in our
campaign. The value of
when the star was observed in our
campaign. The value of ![]() has been calculated in a non-traditional
way, such that the maxiumum of the lightcurve is 0 and that the
minimum is always at
has been calculated in a non-traditional
way, such that the maxiumum of the lightcurve is 0 and that the
minimum is always at
![]() .
The values of 0.25/0.75 were fixed
when the lightcurve reaches
.
The values of 0.25/0.75 were fixed
when the lightcurve reaches
![]() .
The other values for
.
The other values for ![]() were
then interpolated between the fixed ones (see Fig. 11).
were
then interpolated between the fixed ones (see Fig. 11).
Figure 12 shows the
phase ![]() versus the equivalent line-width of water.
The expected correlation can be seen in this figure, but not as clearly as
anticipated. Figure 12 indicates that the water
absorption is highest for all but one star for
versus the equivalent line-width of water.
The expected correlation can be seen in this figure, but not as clearly as
anticipated. Figure 12 indicates that the water
absorption is highest for all but one star for ![]() ,
which
indicates the light minimum. For the other phases there is a large
spread and no clear trend, which is expected as the individual stars
have different parameters.
,
which
indicates the light minimum. For the other phases there is a large
spread and no clear trend, which is expected as the individual stars
have different parameters.
 |
Figure 13: Comparison of the expansion velocities with the equivalent line widths of Na I, Ca I, 12CO(2, 0), and the water absorption. The dotted vertical line separates the 2 groups of OH/IR stars. |
| Open with DEXTER | |
Lindqvist et al. (1992b) determined the expansion velocities
![]() for their sample of OH/IR stars close to the GC. As mentioned
in Sect. 1, they divided the sample into two
groups based on the expansion velocities. The first group with the
lowest expansion velocities are kinematically different and show
larger dispersions in their radial velocities.
for their sample of OH/IR stars close to the GC. As mentioned
in Sect. 1, they divided the sample into two
groups based on the expansion velocities. The first group with the
lowest expansion velocities are kinematically different and show
larger dispersions in their radial velocities.
With our spectra we wanted to see whether we
could find metallicity differences between the two kinematically different
groups. As shown in the previous sections, this is not possible
using the relationship based on the equivalent line widths of
Na I, Ca I, and 12CO(2, 0) in
nonvariable stars with low mass-loss rates
(see Ramírez et al. 2000; Schultheis et al. 2003; Frogel et al. 2001). We still wanted
to investigate whether we find differences in the equivalent line
widths of the individual lines for the two groups.
Figure 13 shows the comparison between
the expansion velocities and the equivalent line widths of
Na I, Ca I, 12CO(2, 0), and the water
absorption around 1.6 ![]() m, for our sample of OH/IR
stars. Table 5 gives the mean
values with standard deviation for the measured equivalent line widths
and the water indication for the both groups. Figure 13 and Table 5
seem to indicate that the OH/IR stars in the first group have smaller
EW(Na) and a larger spread for the water
absorption. Based on the numbers in Table 5, there is no difference
between the EW(CO) for both groups. Concerning Ca I, the
majority of the OH/IR stars in the first group have no measurable
equivalent line widths. Since the water absorption has a larger spread
for this group and because of the dependence seen in Fig. 10, it is consistent that we measure negative EW(Ca)
for the majority of these stars.
m, for our sample of OH/IR
stars. Table 5 gives the mean
values with standard deviation for the measured equivalent line widths
and the water indication for the both groups. Figure 13 and Table 5
seem to indicate that the OH/IR stars in the first group have smaller
EW(Na) and a larger spread for the water
absorption. Based on the numbers in Table 5, there is no difference
between the EW(CO) for both groups. Concerning Ca I, the
majority of the OH/IR stars in the first group have no measurable
equivalent line widths. Since the water absorption has a larger spread
for this group and because of the dependence seen in Fig. 10, it is consistent that we measure negative EW(Ca)
for the majority of these stars.
Table 5: Mean values for the two groups of OH/IR stars.
Decin (2000) indicates that the linestrength of H2O increases with decreasing metallicity. This could explain why we see stronger water absorption for the OH/IR stars in the first group, provided these OH/IR stars are older and have lower metallicities than the stars in the second group, as suggested by kinematics and outflow velocities.
We obtained near-IR data (1.53-2.52 ![]() m) with SOFI on the NTT
for 70 OH/IR stars located in the GC. The spectra were analysed based
on the equivalent line widths of Na I, Ca I, and
12CO(2, 0). The curvature of the spectrum around
1.6
m) with SOFI on the NTT
for 70 OH/IR stars located in the GC. The spectra were analysed based
on the equivalent line widths of Na I, Ca I, and
12CO(2, 0). The curvature of the spectrum around
1.6 ![]() m indicates the amount of water.
The equivalent line widths of Na I, Ca I, and
12CO(2, 0) were found to have low values in comparison to
the GC static giant stars. For a large fraction of the OH/IR stars, we
even found that Ca I lines could not be detected.
m indicates the amount of water.
The equivalent line widths of Na I, Ca I, and
12CO(2, 0) were found to have low values in comparison to
the GC static giant stars. For a large fraction of the OH/IR stars, we
even found that Ca I lines could not be detected.
We discuss different elements which can influence the determination of the equivalent line widths in the near-infrared spectra. The OH/IR stars have a variable amount of water, which especially influences the Ca I lines. The water lines just beside the Ca I line depress the continuum, causing the Ca I lines to disappear in the spectrum. The effect is also noticeable for Na I but is not as strong.
We also discuss the effect of the circumstellar dust on the
near-infrared spectrum. By using the radiative transfer model
(Groenewegen 1993), it became clear that for the highest
mass-loss rates the dust has the same effect on the Ca I and
Na I lines as the water content: the lines become weaker and in
the extreme case of mass-loss rates of the order of
![]() even disappear in the continuum and are no longer measurable. For the
lower mass-loss rates (
even disappear in the continuum and are no longer measurable. For the
lower mass-loss rates (![]()
![]() ), the decrease in the
equivalent line widths depends strongly on the dust temperature. Since
we do not know the exact dust temperature and the mass-loss rates of
these OH/IR stars, we cannot distinguish between the possible effects
that weaken the lines.
The different effects discussed above prevent us from finding a clear
distinction between the two groups of OH/IR stars.
), the decrease in the
equivalent line widths depends strongly on the dust temperature. Since
we do not know the exact dust temperature and the mass-loss rates of
these OH/IR stars, we cannot distinguish between the possible effects
that weaken the lines.
The different effects discussed above prevent us from finding a clear
distinction between the two groups of OH/IR stars.
Acknowledgements
M.S. is supported by an APART fellowship. We want to thank P.R. Wood, who kindly provided us with the K lightcurves for the OH/IR stars.
Table A.1: Log of the stars observed on 28/06/03.
Table A.2: Log of the stars observed on 29/06/03.
Table A.3: Log of the stars observed on 30/06/03.
Table A.4: Contribution of other species to the equivalent line-width measurement of Na I. Based on Wallace & Hinkle (1996).
Table A.5: Contribution of other species to the equivalent line-width measurement of Ca I. Based on Wallace & Hinkle (1996).
Table A.6: Contribution of other species to the equivalent line-width measurement of 12CO(2, 0). Based on Wallace & Hinkle (1996).
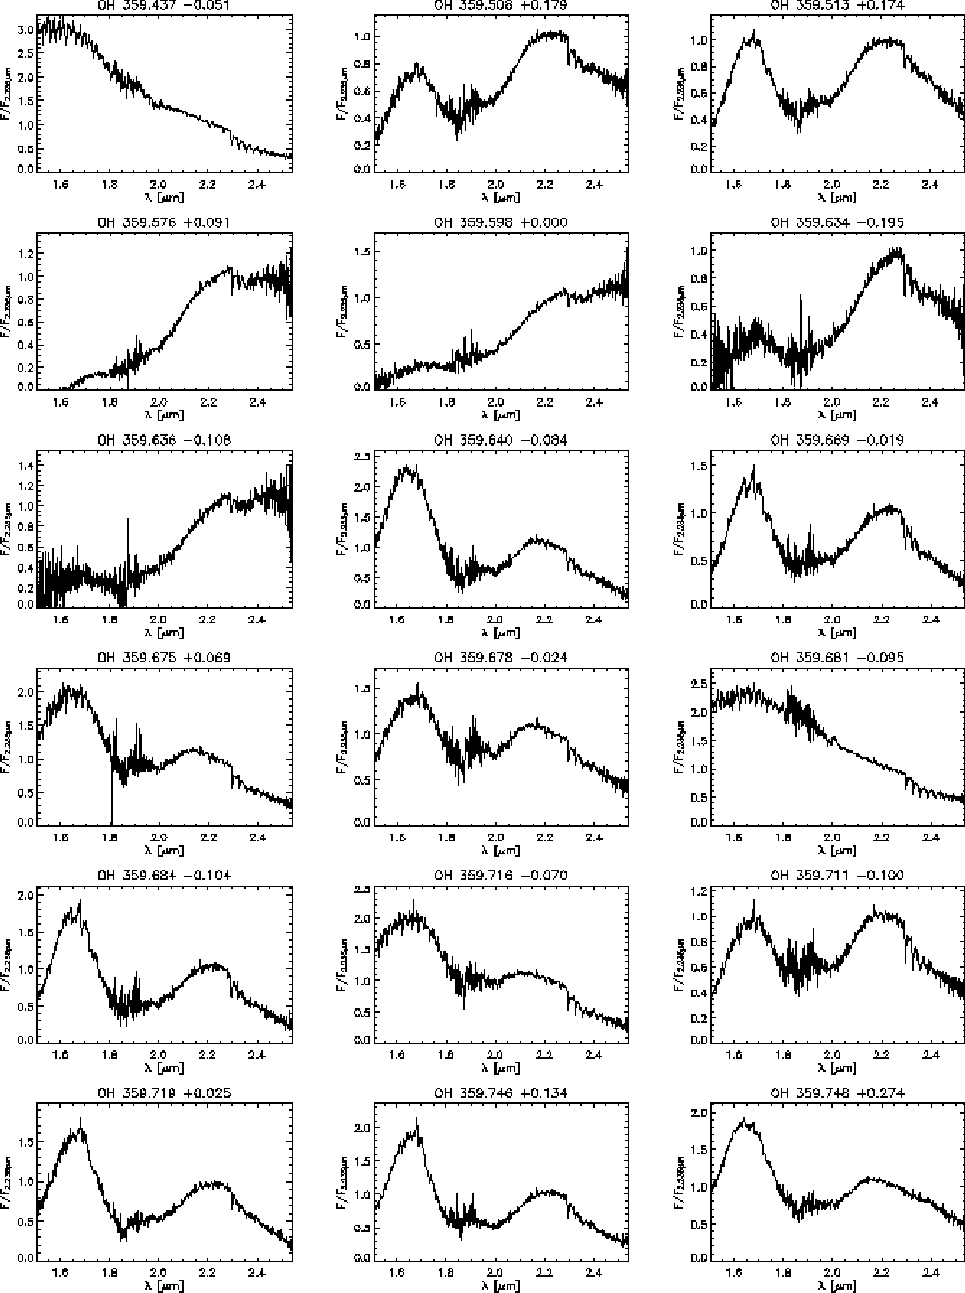 |
Figure B.1: OH/IR stars. OH 359.437-0.051 is possibly a mismatch. |
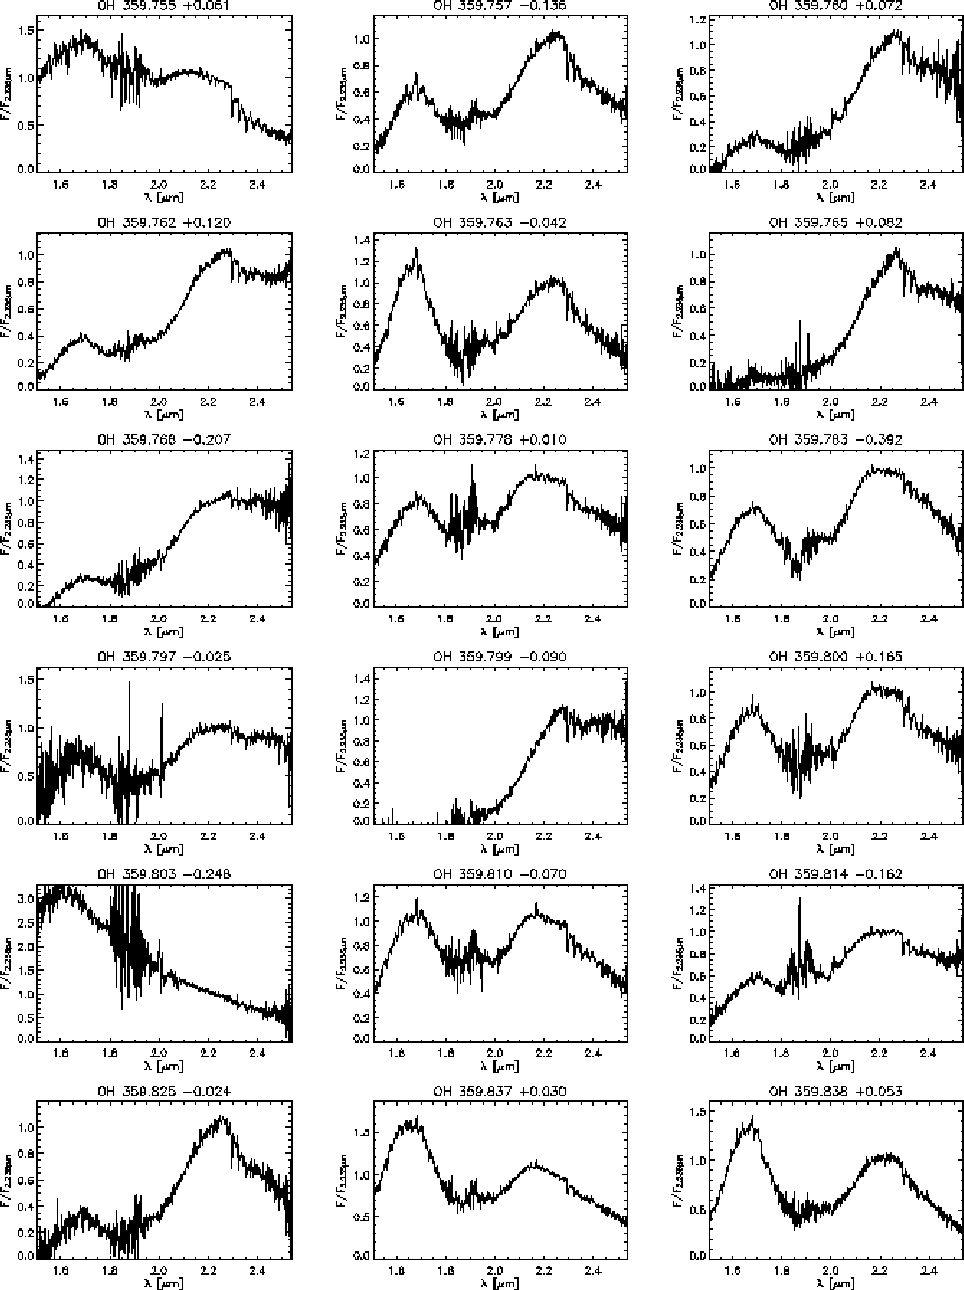 |
Figure B.2: OH/IR stars - continued. OH 359.803-0.248 is possibly a mismatch. |
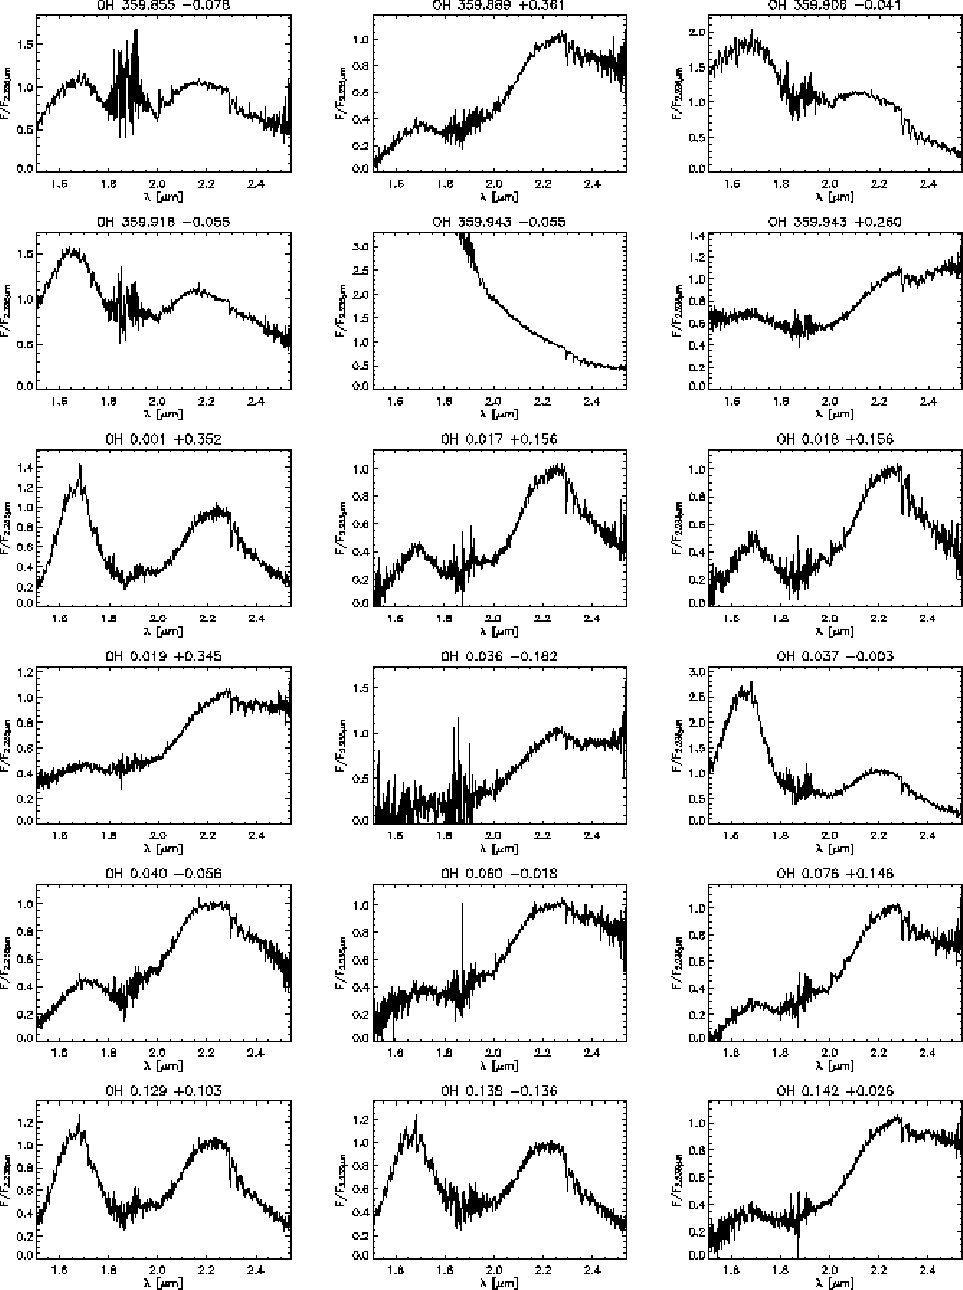 |
Figure B.3: OH/IR stars - continued. OH 359.943-0.055 is possibly a mismatch. |
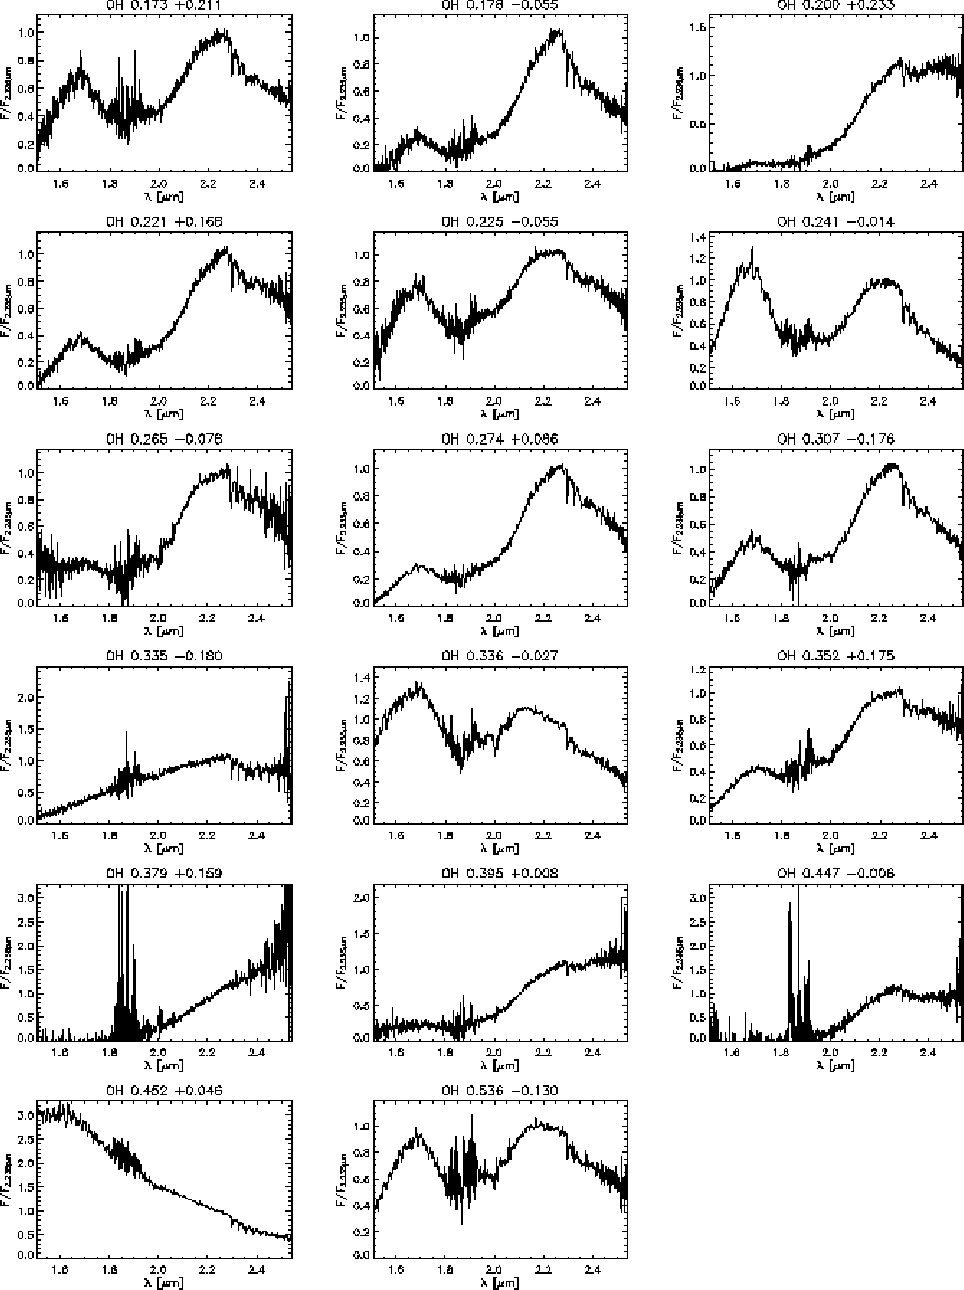 |
Figure B.4: OH/IR stars - continued. OH 0.452+0.046 is possibly a mismatch. |
| |
Figure B.5: High-velocity OH/IR stars (van Langevelde et al. 1992). |
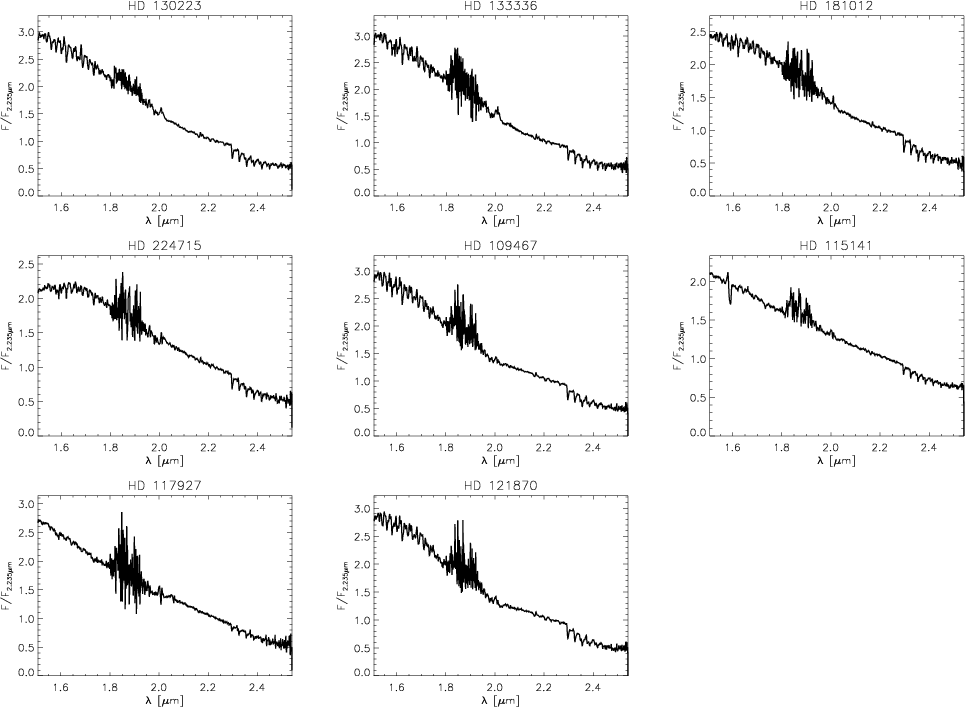 |
Figure B.6: Stars in common with Ramírez et al. (1997). |
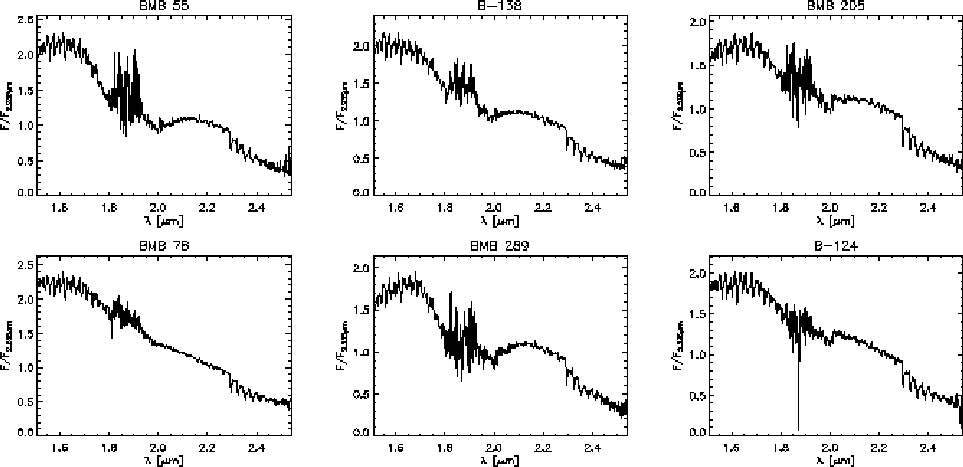 |
Figure B.7: Stars in common with Ramírez et al. (2000). |
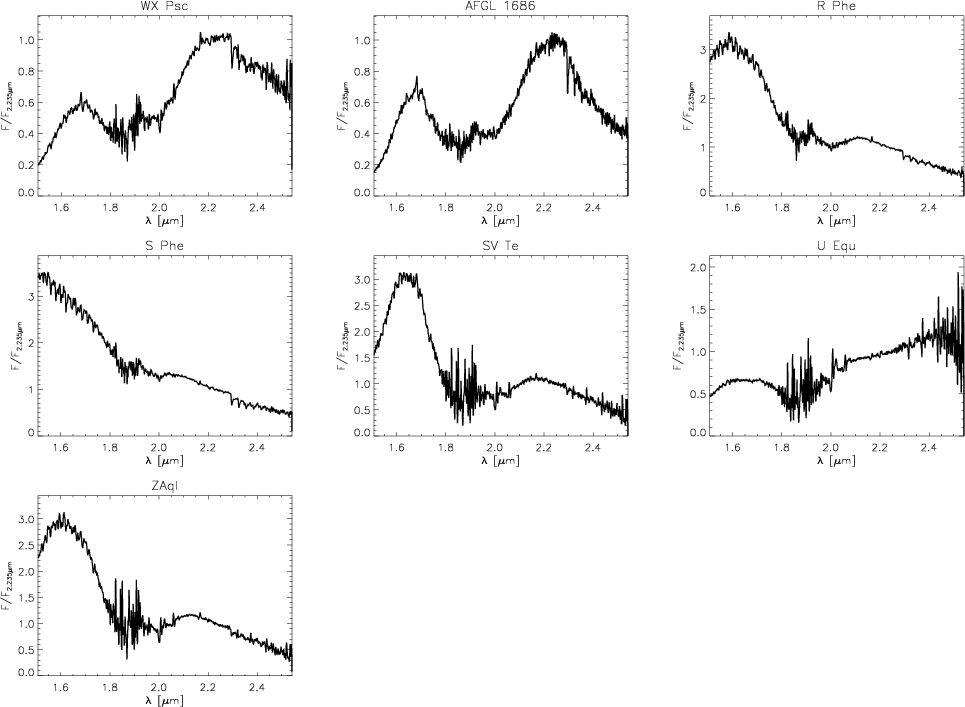 |
Figure B.8: Stars in common with Lançon & Wood (2000). |