1 - THEMIS, CNRS-UPS 853, C/ vía Láctea s/n, 38200 La Laguna, Tenerife, Spain
2 - High Altitude Observatory, National Center for Atmospheric Research, PO Box 3000, Boulder, CO 80307-3000, USA
A&A 454, 663-668 (2006)
DOI: 10.1051/0004-6361:20054657
A. López Ariste 1 - S. Tomczyk 2 - R. Casini 2
1 - THEMIS, CNRS-UPS 853, C/ vía Láctea s/n, 38200 La Laguna, Tenerife, Spain
2 -
High Altitude Observatory, National Center for Atmospheric
Research, PO Box 3000, Boulder, CO 80307-3000, USA![]()
Received 7 December 2005 / Accepted 6 March 2006
Abstract
Context. The Mn line at 553 nm shows strong spectral features in both intensity and polarization profiles due to the hyperfine structure of the atom. These features, their presence or absence, are known to be dependent on the magnetic regime to which the Mn atom is subject.
Aims. Our objective is to disentangle strong kilo-Gauss (kG) fields from relatively weak hecto-Gauss (hG) fields in the quiet sun, and compute relative filling factors on the resolution element.
Methods. We observed the 553 nm Mn line in a quiet sun area with the Advanced Stokes Polarimeter, and we introduce an in-line ratio between different spectral features. Filling factors can be retrieved from the measurement of this ratio and the total longitudinal flux.
Results. In the photospheric network the kG dominate the magnetic flux, although out of the higher concentration areas the hG fields dominate in surface coverage. For the internetwork (granules and lanes confounded) the hG are dominant both in surface and total flux.
Key words: polarization - line: profiles - Sun: magnetic fields - Sun: photosphere
The solar dynamo generates the solar global magnetic field in its many manifestations. At the level of the solar photosphere, active regions with their polarity laws through the solar cycles can be seen as one of the most evident signatures of the acting of the solar dynamo. Flux losses from active regions at the end of their lifespan can be seen to migrate towards the poles where the remnant of magnetic flux disappears at the beginning of each new cycle. The migration of magnetic flux occurs through quiet sun regions, but not in a homogeneous manner. Quiet sun is dominated by convective flows that result in the granular and supergranular structures visible in dopplergrams. The migrating magnetic flux is trapped in these flows and, at the photosphere's level, it is advected towards the supergranular lanes, usually referred to as the network. It is this magnetic network that is visible in full-sun and/or low-sensitivity magnetograms and whose signal goes into the magnetic butterfly diagrams revealing the migration of magnetic flux through the solar cycle.
The previous sketch of the photospheric activity gets troubled by simulations
of the convective flow at the photosphere's level in the presence of weak
(when compared to the involved kinetic energies) magnetic
fields. Computer simulations have led to the prediction of a local dynamo (as opposed to
the global dynamo referred above) driven by the turbulent flow and able to
generate or, at least, concentrate and amplify the magnetic field in small
regions (Cattaneo 1999; Cattaneo et al. 2003). This field thus generated is characterized by its
mixed polarities,
but it will nevertheless be driven by the advective motions into the magnetic
network and contribute to the migrating flux present in those regions. Can we
disentangle the effects of this hypothetical local dynamo from the actual
flux directly related to the solar cycle? The answer to these questions and
other similar ones lies in the thorough observation and measuring of network
and internetwork![]() fields.
fields.
This observational activity relies on the spectropolarimetric techniques and has concentrated in two main paths. On the one hand, the measurement of Hanle effect polarimetric signals, insensitive to mixed polarities, has revealed a pervasive and apparently turbulent field with strengths of 30-60 G when granules and intergranules are confounded (Manso Sainz et al. 2004; Bommier et al. 2005) and weaker fields in the granules than intergranules when using molecular Hanle effect to disentangle both regions (Trujillo Bueno et al. 2004). Such fields could arguably be mostly related to the aforementioned local dynamo (Okunev et al. 2005). The Hanle effect signals saturate for the studied cases for field strengths of the order of 100 G, and just the combined use of molecular and atomic lines sensitive to the Hanle effect allowed Trujillo Bueno et al. (2004) to constrain higher field strengths to some extent. This unfortunate fact has encouraged work in the traditional path: the use of Zeeman effect. Zeeman effect cancels out in the presence of perfectly matched mixed polarities, and thus it will show signal only for unmatched fields. With these characteristics one is tempted to attribute the fields detected through Zeeman effect to the migrating flux. This is, of course, an unrealistic simplification of a more complex picture.
The present work aims at contributing to this effort through the study of new spectral lines whose Stokes profiles are sensitive to the Zeeman effect in a manner different than the usually observed Fe lines, thanks to the effects of hyperfine structure. Unlike Fe lines, such as those at 630 nm, the Mn line we study in this paper changes spectral form with field strength and amplitude with magnetic flux. The combination of both features allows for example to disentangle strong fields filling minute regions from weak fields pervading a full area, or the distribution of both regimes in the resolution element. Through this analysis we mitigate some of the drawbacks of the Zeeman effect, and in particular of the difficulties to measure field strengths with some of those lines (Martínez González et al. 2006). Also, with these Mn lines the conditions for cancellation due to mixed polarities are more constraining since it is not sufficient that the total flux should be zero: the partial flux computed for the different regimes should be zero as well.
Thanks to this new tool we are able to get information in this work on the distribution of strong kilo-Gauss (kG) fields respect to relatively weak (hecto-Gauss, hG) fields in the network and the internetwork (without discrimination between granules and intergranular lanes) using a single line and a very crude algorithm. Although the results are not completely unexpected, they arise from a completely independent method to what has been previously used.
In the next section we present the observations. Section 3 is devoted to describe the Mn line under scrutiny and to devise a crude algorithm to compute the relative presence of strong and weak fields. In Sect. 4 we apply the technique to the photospheric network and internetwork.
The Advanced Stokes Polarimeter (Elmore et al. 1992) at the DST was used from June 2nd through June 6th, 2002 to observe a series of lines of Mn 1 with full Stokes polarimetry. The set of lines was proposed by López Ariste et al. (2002) because of its strong hyperfine coupling. Since the purpose of the campaign was to check for the presence of the theoretically predicted signals in the Stokes profiles, we observed a sunspot, a plage and a quiet region for each one of the Mn 1 lines in the list.
The DST low-order adaptive optics system (Rimmele et al. 1999) was used whenever possible. Its main interest for us was not to provide us with high spatial resolution, but rather to stabilize the image as much as possible and in consequence to improve the polarimetry by diminishing the chances of seeing-induced crosstalk. The spatial resolution was given by the width of the spectrograph slit placed at 0.8 arcsec. We will not claim in this paper spatial resolutions better than 1 arcsec.
Only the Mn 1 line at 5537 Å (observed on June 2nd) is used in this study. The reasons for this limitation lay on the better understanding we posses of the polarization patterns of this line at this moment, combined with the clear signals seen on the data which make easier both data analysis and interpretation.
A scan of 100 steps and 1 arcsec per step was done over a quiet region at
heliospheric longitude
![]() and latitude
and latitude
![]() at 14:12 UT
on June 2nd, 2002. Figure 1 shows a magnetogram of that region. This magnetogram is generated from the observed amplitude of the Stokes V profile of the strongest Fe line next to the Mn target line. We have not included a scale in
at 14:12 UT
on June 2nd, 2002. Figure 1 shows a magnetogram of that region. This magnetogram is generated from the observed amplitude of the Stokes V profile of the strongest Fe line next to the Mn target line. We have not included a scale in
![]() next to this table because of
atomic reasons to be discussed below. In spite of lacking a scale, the image fulfills the
purpose of indicating the presence and localization in the scanned region
of the photospheric magnetic network. The Fe lines in the observed spectral
domain observed are not magnetically very sensitive when
compared to other lines usually observed for magnetograms. Only the strongest
magnetic elements of the photospheric network are therefore visible, rather than the full net.
next to this table because of
atomic reasons to be discussed below. In spite of lacking a scale, the image fulfills the
purpose of indicating the presence and localization in the scanned region
of the photospheric magnetic network. The Fe lines in the observed spectral
domain observed are not magnetically very sensitive when
compared to other lines usually observed for magnetograms. Only the strongest
magnetic elements of the photospheric network are therefore visible, rather than the full net.
![\begin{figure}
\par\includegraphics[width=7.65cm,clip]{4657fig1.ps}\end{figure}](/articles/aa/full/2006/29/aa4657-05/img6.gif) |
Figure 1: Magnetogram of the scanned region. The gray scale indicates the amplitude of the Stokes V profile of the strongest Fe line present in the observed spectral domain. |
| Open with DEXTER | |
The spectrograph setup resulted in an observed spectral resolution of 14 mÅ per pixel. The spectral region observed included 3 main lines: the target Mn I line at 5537.8 Å and two Fe I lines. The weakest one at 5539.3 Å corresponds to the
transition
![]() of multiplet 871, with an effective Landé factor of 1.666, the strongest one is a perfect blend of two transitions, one
the
of multiplet 871, with an effective Landé factor of 1.666, the strongest one is a perfect blend of two transitions, one
the
![]() of multiplet 839 with effective Landé factor of 1.166,
and the second the
of multiplet 839 with effective Landé factor of 1.166,
and the second the
![]() of multiplet 1064 with effective
Landé factor 2.0. The unfortunate coincidence of the two transitions on the
same wavelength brings up the problem of the net effective Landé factor of
the observed line. At the moment of writing this paper we lack information on
the distribution of populations among the levels involved in those
transitions. We are therefore unable to give the contribution of each
transition to the observed line and in consequence the response of the line to
magnetic fields. Because of this reason we avoided giving a scale for magnetic
fluxes in Fig. 1. In what follows we will present the data with two values for the magnetic flux computed using this line. They correspond to the maximum and minimum effective
Landé factors, 1.166 and 2.0, possible. The true value lies somewhere
between the two
of multiplet 1064 with effective
Landé factor 2.0. The unfortunate coincidence of the two transitions on the
same wavelength brings up the problem of the net effective Landé factor of
the observed line. At the moment of writing this paper we lack information on
the distribution of populations among the levels involved in those
transitions. We are therefore unable to give the contribution of each
transition to the observed line and in consequence the response of the line to
magnetic fields. Because of this reason we avoided giving a scale for magnetic
fluxes in Fig. 1. In what follows we will present the data with two values for the magnetic flux computed using this line. They correspond to the maximum and minimum effective
Landé factors, 1.166 and 2.0, possible. The true value lies somewhere
between the two![]() .
.
Figure 2 shows an example of the spectral domain observed. We measured a noise in polarization slightly better than 10-3 of the intensity of the continuum, which is a typical value for the ASP.
![\begin{figure}
\par\includegraphics[width=7.6cm,clip]{4657fig2.ps}\end{figure}](/articles/aa/full/2006/29/aa4657-05/img10.gif) |
Figure 2: Example of the spectral domain observed with the target Mn I line at 5537 Å on the left showing the line asymmetries attributed to the hyperfine coupling, and the two Fe I lines used for reference. |
| Open with DEXTER | |
López Ariste et al. (2002) solved the polarized radiative transfer equation for the Mn I line at 5537 Å including hyperfine coupling. For our line of interest, one can see in their results that a transition occurs around 600 G. Stronger fields place the atomic system in the incomplete Paschen-Back regime, meaning that just the atomic fine structure is visible in the Stokes profiles. For comparison, the Stokes V profile presents in this regime the typical 2-lobe antisymmetric pattern. On the other hand, for fields weaker than 600 G, the hyperfine structure introduces changes in the distribution of polarized components and, as a result, the main lobes of Stokes V get narrower and a new feature appears near the core of the line. All these changes are illustrated in Fig. 4 of López Ariste et al. (2002) that we reproduce here for comprehensiveness.
![\begin{figure}
\par\includegraphics[width=8.2cm,clip]{4657fig3.ps}\end{figure}](/articles/aa/full/2006/29/aa4657-05/img11.gif) |
Figure 3:
Examples of Stokes V ( left) and Q ( right) profiles normalized to
the continuum intensity for the Mn 1 line at 5537.7 Å. Three cases of the same spectral line are displaced horizontally by 1 Å for clarity purposes. They are computed using Milne-Eddington atmospheres with constant magnetic field strengths of, from left to right, 100, 600 and 900 G. The dotted horizontal lines are placed at |
| Open with DEXTER | |
It is apparent that the observation or non-observation of both the new feature in the core of the Stokes V profile and the narrowing of the lobes constitute a diagnostic of the presence or absence of weak hG fields.
If the observed Stokes V profile presents the aforementioned features one can also attempt to determine the relative contribution of the weak field to the observed flux (its filling factor). Because of the low amplitude of the Stokes V profile in the observed regions in general, the use of inversion techniques has proved to be difficult. This an ongoing effort that will be presented in a future paper. We decided in the meantime to look for some straightforward technique that could give us some insight into the distribution of weak and strong fields in the observed regions.
In the Zeeman effect, the amplitude of the Stokes V lobes is proportional to the longitudinal net flux, all field strengths considered. Because of the same reasons, the amplitude of the spectral feature near the center of the Stokes V line is, whenever present, proportional to the longitudinal flux corresponding to the magnetic fields contributing to that feature, i.e., fields up to 600 G in strength. The ratio between both amplitudes carries in consequence some information about the relative ratio between the fields weaker than 600 G and the sum of all magnetic fields present in the resolution element.
It is that general idea that one can try to convert into an algorithm to measure the relative contributions of weak and strong fields. From synthetic Stokes V profiles, we determine what the ratio between the HFS feature amplitude (with that name we shall refer from now on to that spectral feature appearing in the Stokes V profile for fields under 600 G) and the main lobe amplitude is. The result is shown in Fig. 4.
![\begin{figure}
\par\includegraphics[width=7.4cm,clip]{4657fig4.ps}\end{figure}](/articles/aa/full/2006/29/aa4657-05/img12.gif) |
Figure 4: Ratio between the main lobe of Stokes V and the HFS feature for synthetic profiles of increasing field strength. |
| Open with DEXTER | |
Because of the crudeness of our technique we cannot expect to provide
information for the full distribution of field strengths. Consequently we
propose a toy model for the distribution of magnetic fields in the resolution
element. We consider a zero field atmosphere in which we find embedded a magnetic field of 1500 G filling a factor
![]() of the resolution
element and a second field of 320 G filling
of the resolution
element and a second field of 320 G filling
![]() of the pixel.
We used 1500 G for the strong component because it is a traditional figure for
the strength of the unresolved magnetic field out of active regions
(Stenflo 1973). The choice of the 320 G value responds to the need of a field
below 600 G, and the ability to explain the smallest ratio we observed (2.25) without
compromising the toy model we propose here. The two values can be changed at
will within the constrains of respecting the strong field and weak field
definitions of the present case, and the observational constraints.
of the pixel.
We used 1500 G for the strong component because it is a traditional figure for
the strength of the unresolved magnetic field out of active regions
(Stenflo 1973). The choice of the 320 G value responds to the need of a field
below 600 G, and the ability to explain the smallest ratio we observed (2.25) without
compromising the toy model we propose here. The two values can be changed at
will within the constrains of respecting the strong field and weak field
definitions of the present case, and the observational constraints.
We observe in Fig. 4 that a field of 320 G results in a ratio of
amplitudes of 2.25. The measure in a given profile of a ratio
of 2.25 should in consequence be interpreted in the proposed model as the
strong field being absent from that region. Ratios bigger than 2.25
will correspond to the presence of both fields and, calling r that ratio, we easily see
that
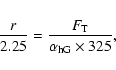
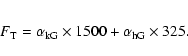
The presented algorithm is highly dependent on the quality of the measure of the two amplitudes and, in particular, of the amplitude of the HFS feature because of its smallness. The result is also dependent on the measure of the ratio for the case of a 325 G field. This ratio of 2.25 taken from Fig. 4 varies with line width: a broadened line results in a smeared feature. It is therefore important to compute this ratio for line widths similar to the observed ones. But other than this dependence, the ratio is a good and sound observable only dependent on the stated magnetic parameters.
We have divided the observed region in two distinct parts: the magnetic network and the internetwork. The network presents, in most of the cases, enough polarization signal as to allow a study point by point. In the case of the internetwork very seldom we can ascertain signals in individual pixels and we should rely on averaging procedures to get profiles with enough S/N ratio.
Figures 5 and 6 show a set of illustrative examples of the profiles seen in the network. They are profiles from individual pixels. They summarize the main conclusion we draw for the network: in the strongest magnetic cores of the photospheric network (Muller 1983) there is no clear signature of the presence of fields below 600 G (hG fields). Stokes V shows a 2 lobe anti-symmetric profile, as can be seen in the selected examples of Fig. 5. But when one explores the profiles out of those strong cores we find tantalizing signs of hG fields (Fig. 6). The HFS feature can be appreciated in the examples altogether with narrower Stokes V lobes. The referred features may seem too near the noise level to be trusted but, as we shall see later, noise, when Gaussian in nature, behaves in a manner that very seldom will simultaneously create the 2 features with realistic amplitudes, wavelength positions and shapes. If the previous statement is true for any single case, it is even more when we find many cases showing the same kind of signs.
| |
Figure 5:
Stokes V profiles from network points ( from left to right) 5 (445-764
|
| Open with DEXTER | |
| |
Figure 6:
Stokes V profiles from network points 4 (142-243
|
| Open with DEXTER | |
The use of the algorithm sketched in the previous section to the profiles
from the network is certainly handicapped by the low amplitude of the HFS feature, whenever observable. The results for the two filling factors in the
9 particular cases studied are shown in Fig. 7. They follow the main lines given after examining the individual profiles: the network points with very strong fluxes
(above
![]() )
do show a presence of the kG component. But
everywhere else, the filling factors of the hG fields are a factor 10 or more bigger than those of the kG fields. The actual ratio between the filling factor changes with
the actual values of field strength chosen to represent the two regimes, but
the trend uncovered in the previous lines is mostly independent of that.
)
do show a presence of the kG component. But
everywhere else, the filling factors of the hG fields are a factor 10 or more bigger than those of the kG fields. The actual ratio between the filling factor changes with
the actual values of field strength chosen to represent the two regimes, but
the trend uncovered in the previous lines is mostly independent of that.
![\begin{figure}
\par\includegraphics[width=7.65cm,clip]{4657fig7.ps}\end{figure}](/articles/aa/full/2006/29/aa4657-05/img21.gif) |
Figure 7: Filling factors for the kG (diamonds) and the hG (crosses) components as a function of the longitudinal flux density in profiles of the network. |
| Open with DEXTER | |
The analysis of the internetwork is hampered by signals below the noise in the present conditions. Socas-Navarro et al. (2004) proved nevertheless that the signal is still there, below noise level, in their studies of the weak magnetic fields with the 630 nm Fe lines. The coherent addition of data from wide areas brings up an average Stokes V profile of the integrated region, while noise, which always adds in an incoherent manner, is reduced. A problem in doing this is polarity. Socas-Navarro et al. (2004) proposed a criterion to integrate the unsigned Stokes V based upon the most probable polarity as seen in the wing region of the line, where the Stokes V lobe would lie. In synthetic tests those authors proved that with their criterion they could recover the actual polarity and the true average profile in most of the cases. Similar results on the addition of coherent profiles buried under incoherent noise can be recalled from another field of application of spectropolarimetric techniques. In Zeeman Doppler Imaging of rapidly rotating stars the integrated Stokes V profile from star-spots is clearly under the noise level of current instruments in most of the cases. A solution to this situation is to observe the full visible spectrum of the star and add coherently the Stokes V signals. The noise adds incoherently and gets reduced following poissonian laws, while the signal adds coherently and becomes detectable (Semel & Li 1996).
We applied the Socas-Navarro et al. (2004) technique to the stronger Fe line in our spectral domain and summed over full internetwork regions. For every pixel in the region a polarity was chosen in order to
increase the total signal on the wing of the strong Fe line. Despite the criterion
concerning exclusively this line we see that the Stokes V signal
also appears above noise and grows coherently for both the Mn and the weaker Fe lines. This comes as a confirmation that we are coherently adding the correct
polarities in most of the cases, and that the recovered profiles are thus of
solar origin. Since we are summing granules and intergranules without distinction,
despite their different velocities, we tried for each pixel up to 16 Doppler
shifts of the observed V: ![]() 2 pixel with 0.25 pixel steps (corresponding
to
2 pixel with 0.25 pixel steps (corresponding
to ![]() 1.3 km s-1 with steps of 160 m/s), and only kept the one that
increased the absolute amplitude of the red wing of the Fe line. This further
correction doesn't change much the resulting profiles, nevertheless.
1.3 km s-1 with steps of 160 m/s), and only kept the one that
increased the absolute amplitude of the red wing of the Fe line. This further
correction doesn't change much the resulting profiles, nevertheless.
The first region added is roughly the full observed scan, excluding those
points showing Stokes V signals in the strong Fe line above 0.1% of the
continuum intensity (corresponding to about 10 G of longitudinal flux density). This threshold
implies that we are not considering all the points of the magnetic network discernible in the
magnetograph. But the parts of the network not visible in the magnetograph
because of the poor magnetic sensitivity of our line are included in the
average. The resulting V profile is shown in Fig. 8. It is obvious
that the Mn line shows the typical features of hG fields with a ratio of 2.6 for an average longitudinal flux density of between 4.7 and
![]() .
As a first conclusion, the Mn line in the internetwork is dominated by fields below the 600 G
threshold.
.
As a first conclusion, the Mn line in the internetwork is dominated by fields below the 600 G
threshold.
![\begin{figure}
\par\includegraphics[width=7.65cm,clip]{4657fig8.ps}\end{figure}](/articles/aa/full/2006/29/aa4657-05/img23.gif) |
Figure 8: Average Stokes V profile of the full observed region. |
| Open with DEXTER | |
Smaller sub-regions of scanned area produce more or less conspicuous features in the Mn line related to hG fields. And although in some particular cases the noise level is near enough the referred signals as to cast a doubt on that statement, it is difficult for the majority of cases to deny the presence of the hG fields.
| |
Figure 9: Average Stokes V profiles for two different internetwork regions. |
| Open with DEXTER | |
To improve our confidence in these results we performed a simulation to see if noise alone can produce the observed features with a high enough probability to be significant to our results. The simulation consisted in synthesizing four Mn Stokes V profiles for four different field strengths: 300 G, 500 G, 1000 G and 1500 G. The filling factor was computed to give for the four cases the same longitudinal flux, and therefore the same Stokes V amplitude in the main lobes. The other parameters for the synthesis of the line were identical in the four cases. One hundred different realizations of Gaussian noise with fwhm bigger than the Stokes V amplitude of the profiles were created. When combined we produced, for every particular case of field strength, 100 observations of the Stokes V profile masked by a noise bigger than the maximum amplitude. These 100 profiles represented the observations on the internetwork. We next added the 100 profiles coherently as to bring the Stokes V profile out of the noise with the same criterion used for the observations. The results are seen in Fig. 10. In the cases with field strengths of 1000 G and 1500 G, whose Stokes V profiles do not show an HFS feature, we find that at worst one pixel noise peaks out of the expected profile. For the 2 other cases (300 G and 500 G), the HFS features are still present over several pixels and do not get masked by noise; furthermore the typical narrowing of the main lobes is also maintained. These results have been tested with many different noise realizations, of which we only show here a representative example. We therefore conclude that it is statistically improbable that the observed spectral features in the real data are due to noise alone. We are highly confident that they correspond to the actual presence in the profiles of the spectral features associated to hyperfine structure, even if their amplitudes are near to noise levels.
![\begin{figure}
\par\includegraphics[width=7.55cm,clip]{4657f10.ps}\end{figure}](/articles/aa/full/2006/29/aa4657-05/img25.gif) |
Figure 10: Synthetic profiles of the specified field strengths (300, 600, 1000 and 1500 G respectively) are polluted with several realizations of a Gaussian noise of amplitude slightly bigger than the signal itself. The sum of all the realizations simulates the addition procedure performed on the observations. The experiment results in that the HFS spectral features survive the addition of noise and, conversely, noise cannot reproduce those features on its own. |
| Open with DEXTER | |
The algorithm to determine filling factors with our toy model of magnetic field distributions is easier to apply in the internetwork, since the HFS feature stands out more clearly from the observed profiles. Figure 11 shows the filling factors of both magnetic fields for the 10 sub-regions considered over the scanned area. The results are straightforward, the kG fields are at best marginally present over the regions observed.
![\begin{figure}
\par\includegraphics[width=7.8cm,clip]{4657f11.ps}\end{figure}](/articles/aa/full/2006/29/aa4657-05/img26.gif) |
Figure 11: Filling factors for the kilogauss (diamonds) and the hG (crosses) components of the magnetic atmosphere in internetwork regions. |
| Open with DEXTER | |
The main purpose of this work was to advance the use of spectral lines altered by hyperfine structure as tools to measure magnetic field distributions beyond the spatial resolution of the observations. In recent times a considerable effort has been devoted to the analysis of just a few spectral lines (the pair of Fe I lines at 630 nm and the IR line of Fe at 1.56 microns). These lines are certainly extremely interesting and their sensitivity to different aspects of solar magnetism fully justifies the efforts on the interpretation of their Stokes profiles. But recent works also caution towards the risk of excessive over-interpretation of those lines in the quiet sun (Martínez González et al. 2006). The use of more spectral lines as a check of the results and as a source of new constraints on magnetic models appears justified (Semel 1981). The Mn line studied in this work is a clear example of how a single line can provide, despite a yet very crude analysis, information on the sub-pixel distribution of magnetic fields in the quiet sun, information which otherwise has only be attained through quasi-simultaneous observations of the infrared and the visible lines, or through sophisticated and delicate inversions of visible lines.
The results shown here agree with the main trends on quiet sun magnetism
(Lites 2002; Keller et al. 1994; de Wijn et al. 2005). In the photospheric network we find a predominance of
fields in the kG regime at the strongest magnetic cores as seen in the
magnetograms of longitudinal flux. Out of these cores, however,
the mixture of kG fields with hG fields is apparent in the profiles. The latter dominate
the pixel (estimated size of 1 arcsec) surface distribution for longitudinal
fluxes below
![]() ,
but fill similar volumes for fluxes above that
threshold. In terms of contribution to the total observed flux nevertheless
the network is still mostly dominated by fields in the kG regime.
,
but fill similar volumes for fluxes above that
threshold. In terms of contribution to the total observed flux nevertheless
the network is still mostly dominated by fields in the kG regime.
In the internetwork, we had to average over large regions to build up signal coherently over noise. Thus we only get information on the average properties of the solar atmosphere in that region. In particular we disregarded here the possibility of adding separately granules and granular lanes. Recent works by Domínguez Cerdeña et al. (2003a); Lites & Socas-Navarro (2004); Domínguez Cerdeña et al. (2003b); Trujillo Bueno et al. (2004); Socas-Navarro & Lites (2004) show that the magnetic behaviour of those two regions is disparate enough to make this distinction important: while on granules different authors agree on the presence of weak, hG fields, on the granular lanes the fields in the kG regime seem more abundant although different authors diverge in their contribution to the total flux and in the actual total flux observed in those regions. In this work we cannot contribute to this divergence of opinions because of the averaging over granules and lanes indistinctly. The results we obtain are nevertheless still interesting. The filling factors of the two field regimes differ by at least one order of magnitude, probably more. If the lanes are filled with kG fields, our results can only be interpreted as those fieldsoccupying an average area 10 times smaller than the area filled by the hG fields, granules and lanes confounded.
It is obvious nevertheless that, when granules and lanes are differentiated, the studied Mn line will provide valuable insight in the presence and distribution of kG fields in those two distinct regions. This we shall address in a future work. In the meantime we had to limit ourselves to a model with 2 field regimes. MHD simulations of the quiet sun show continuous distributions of field strength. This is the goal of measurements of magnetic fields in the quiet sun: to determine the PDF of the field strength and compare it with the different scenarios for magneto-convection and turbulent dynamos arising from numerical simulations.
Finally, we should not forget that all analysis based on the Zeeman effect, and regardless of the presence of hyperfine structure contributions to it, can only probe net fields. Mixed polarities in the same regime with zero net flux do not contribute to the Zeeman effect. The contribution of Mn lines showing the HFS spectral features studied in this work allows us to disentangle mixed polarities of different field strengths regimes, even if the final total flux approaches zero (and photon noise permitting!), but not mixed polarities in the same field regime. The final picture of quiet sun magnetism will only be revealed by the combination of Zeeman measurements with Hanle measurements. Hanle signals strengthen independently of mixed polarities but, unfortunately, saturate around 100 G for most of the studied cases and thus they cannot provide the complete picture on their own.
Acknowledgements
This paper improved thanks to discussions with the solar group of the IAC and in particular with M. J. Martínez González.