![[*]](/icons/foot_motif.gif) , Bonn University,
Auf dem Hügel 71, 53121 Bonn, Germany
, Bonn University,
Auf dem Hügel 71, 53121 Bonn, Germany
A&A 453, L39-L42 (2006)
DOI: 10.1051/0004-6361:20065525
LETTER TO THE EDITOR
T. H. Reiprich
Argelander Institute for Astronomy (AIfA), Bonn University,
Auf dem Hügel 71, 53121 Bonn, Germany
Received 29 April 2006 / Accepted 18 May 2006
Abstract
Context. The 3rd year WMAP results mark a shift in best fit values of cosmological parameters compared to the 1st year data and the concordance cosmological model.
Aims. We test the consistency of the new results with previous constraints on cosmological parameters from the HIFLUGCS galaxy cluster sample and the impact of this shift on the X-ray luminosity-gravitational mass relation.
Methods. The measured X-ray luminosity function combined with the observed luminosity-mass relation are compared to mass functions predicted for given cosmological parameter values.
Results. The luminosity function and luminosity-mass relation derived previously from HIFLUGCS are in perfect agreement with mass functions predicted using the best fit parameter values from the 3rd year WMAP data (
 )
and inconsistent with the concordance cosmological model (
)
and inconsistent with the concordance cosmological model (
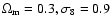 ), assuming a flat Universe. Trying to force consistency with the concordance model requires artificially decreasing the normalization of the luminosity-mass relation by a factor of 2.
Conclusions. The shift in best fit values for
 and
and  has a significant impact on predictions of cluster abundances. The new WMAP results are now in perfect agreement with previous results on the
 relation determined from the mass function of HIFLUGCS clusters and other X-ray cluster samples (the "low cluster normalization''). We conclude that - unless the true values of
and
differ significantly from the 3rd year WMAP results - the luminosity-mass relation is well described by their previous determination from X-ray observations of clusters, with a conservative upper limit on the bias factor of 1.5. These conclusions are currently being tested directly in a complete follow-up program of all HIFLUGCS clusters with Chandra and XMM-Newton.
relation determined from the mass function of HIFLUGCS clusters and other X-ray cluster samples (the "low cluster normalization''). We conclude that - unless the true values of
and
differ significantly from the 3rd year WMAP results - the luminosity-mass relation is well described by their previous determination from X-ray observations of clusters, with a conservative upper limit on the bias factor of 1.5. These conclusions are currently being tested directly in a complete follow-up program of all HIFLUGCS clusters with Chandra and XMM-Newton.
Key words: cosmological parameters - cosmic microwave background - dark matter - X-rays: galaxies: clusters - galaxies: clusters: general
,
and the amplitude of density fluctuations, expressed as
,
in the Universe. This has long been known and the method has been
applied often to constrain cosmological parameters
(e.g., Pierpaoli et al. 2003; Bahcall & Cen 1993; Henry & Arnaud 1991; Bahcall & Cen 1992; Voevodkin & Vikhlinin 2004). In practice, this
test requires detailed knowledge about the number density of clusters and their
gravitational mass. The number density as a function of, e.g., X-ray luminosity
can be measured relatively easily while the accurate determination of the
cluster mass is difficult and subject to systematic errors.
For instance, mass determinations based on galaxy velocity dispersion and X-ray
emission of the intracluster gas may be affected if the cluster is undergoing a
merger event (e.g., Reiprich et al. 2004; Randall et al. 2002), gravitational lensing masses may be
affected by projection effects (e.g., Clowe et al. 2004).
In the era of precision cosmology and with the realization of very tight
constraints on cosmological parameters especially from cosmic microwave
background measurements (e.g., Spergel et al. 2003), these difficulties have lead
to the idea to turn the argument around and assume the cosmological model to be
known precisely and use the abundance of clusters to study cluster physics.
For example, the
X-ray luminosity-gravitational mass (
 )
relation may be
derived by combining the measured X-ray luminosity function with the
assumed cluster mass function.
)
relation may be
derived by combining the measured X-ray luminosity function with the
assumed cluster mass function.
In the last years, a broad consensus has developed that we live in a concordance
Universe (
 ,
,
 ,
,
 ), based on consistent
measurements from a multitude of completely independent observations (from
cosmic microwave background, distant supernovae type Ia, large scale structure,
galaxy clusters, etc., e.g., Bahcall et al. 1999; Turner 2002b; Wang et al. 2002; Turner 2002a); although the
constraint remained somewhat controversial (e.g., Wang et al. 2003).
Then, the case was further strengthend when the 1st year
results from WMAP returned more evidence for a flat Universe for reasonable
values of the Hubble constant, and best fit values that are very close to the
concordance values (
), based on consistent
measurements from a multitude of completely independent observations (from
cosmic microwave background, distant supernovae type Ia, large scale structure,
galaxy clusters, etc., e.g., Bahcall et al. 1999; Turner 2002b; Wang et al. 2002; Turner 2002a); although the
constraint remained somewhat controversial (e.g., Wang et al. 2003).
Then, the case was further strengthend when the 1st year
results from WMAP returned more evidence for a flat Universe for reasonable
values of the Hubble constant, and best fit values that are very close to the
concordance values (
 ,
,
Spergel et al. 2003, their Table 2).
,
,
Spergel et al. 2003, their Table 2).
Although the best fit
and
values changed only
within the uncertainties between the WMAP 1st year and 3rd year data, this has
nonetheless dramatic consequences for predictions of cluster abundances, since
these are very sensitive to even small changes in these values. This is
illustrated in Fig. 1 where the cluster mass functions for the
concordance cosmology and the new best fit values (
,
Spergel et al. 2006; from now on referred to as "new cosmology'') are compared.
Also shown are data points from the HIFLUGCS mass function, determined with
individual mass measurements for 63 galaxy clusters, assuming the intracluster
gas to be in hydrostatic equilibrium with the gravitational potential
(Reiprich & Böhringer 2002). The concordance model predicts more than 200 galaxy clusters in the survey volume while the new cosmology predicts  50 clusters. It is to be expected that this change in best fit cosmology has
significant consequences when deriving the cluster
relation by
combining the measured luminosity function with the predicted mass function. The
aim of this Letter is to illustrate these consequences and suggest a
current best estimate of the
relation.
50 clusters. It is to be expected that this change in best fit cosmology has
significant consequences when deriving the cluster
relation by
combining the measured luminosity function with the predicted mass function. The
aim of this Letter is to illustrate these consequences and suggest a
current best estimate of the
relation.
![\begin{figure}
\par\includegraphics[width=7.3cm,clip]{5331fig1.ps}\end{figure}](/articles/aa/full/2006/27/aa5525-06/img17.gif) |
Figure 1:
Galaxy cluster mass functions. Filled circles: HIFLUGCS data (63 clusters); dashed line: best fit to HIFLUGCS data; upper solid line: predicted by
concordance model (
), which was a very good fit to the
WMAP 1st year data; lower solid line: predicted by best fit to the WMAP 3rd year
data (
 ). The concordance model predicts too many (>200) clusters in the survey volume while the new cosmology predicts about
the correct number. Adapted from Reiprich (2005, Fig. 10.87). ). The concordance model predicts too many (>200) clusters in the survey volume while the new cosmology predicts about
the correct number. Adapted from Reiprich (2005, Fig. 10.87). |
| Open with DEXTER | |
 -
-
 relation
The observed cluster -
relation was first studied in detail by
Reiprich & Böhringer (2002, RB02) using the X-ray flux-limited HIFLUGCS sample.
It is difficult to accurately simulate the X-ray luminosity of galaxy clusters
(e.g. Frenk et al. 1999) but it is reassuring that high resolution cosmological
hydrodynamical simulations that include cooling and non-gravitational heating
are able to reproduce this observed
relation
(e.g., Tornatore et al. 2003).
Since the scatter in this relation is finite, RB02 (Sect. 4.2), as
well as Reiprich (2001, Sect. 6.4) and Ikebe et al. (2002, Sect. 2.3)
mention explicitly that the normalization might be slightly biased high because,
in a flux-limited sample, clusters with higher luminosity for a given mass have a
higher likelihood to be included in the sample. In a recent detailed study,
Stanek et al. (2006) quantify this bias by predicting the
relation using cluster number counts and the scatter in the
luminosity-temperature relation, assuming the cluster mass function in a
concordance Universe (
,
,
). They find the
normalization measured by RB02 is biased high by a factor of 2 -
a significant bias.
The mass function measured with HIFLUGCS is not consistent with a concordance
Universe (Fig. 1). RB02 found the relation
 ,
which surprisingly implied
,
which surprisingly implied
 for a fiducial
,
and
discussed this "low cluster normalization'' for the first time in
detail.
This relation is shown in Fig. 2. Also shown are the results from
the COBE 4 year data (Bunn & White 1997) and the WMAP 3rd year best fit value. The new
WMAP result lies exactly at the intersection of the COBE and HIFLUGCS results. The
fact that the WMAP value lies exactly on the HIFLUGCS curve also
implies that the new cosmology predicts the correct cluster abundance. This
suggests that the normalization of the
relation measured for
the HIFLUGCS clusters may actually not be biased very strongly.
for a fiducial
,
and
discussed this "low cluster normalization'' for the first time in
detail.
This relation is shown in Fig. 2. Also shown are the results from
the COBE 4 year data (Bunn & White 1997) and the WMAP 3rd year best fit value. The new
WMAP result lies exactly at the intersection of the COBE and HIFLUGCS results. The
fact that the WMAP value lies exactly on the HIFLUGCS curve also
implies that the new cosmology predicts the correct cluster abundance. This
suggests that the normalization of the
relation measured for
the HIFLUGCS clusters may actually not be biased very strongly.
![\begin{figure}
\par\includegraphics[width=7.3cm,clip]{5331fig2.ps}\end{figure}](/articles/aa/full/2006/27/aa5525-06/img20.gif) |
Figure 2:
The best fit model to the WMAP 3rd year data lies exactly at the
intersection of the
relations from HIFLUGCS and COBE. COBE
relation from Bunn & White (1997), calculated using a code provided by T. Kitayama.
Adapted from Reiprich (2003). |
| Open with DEXTER | |
To test this quantitatively, we determined "quasi-mass functions'' from the
HIFLUGCS luminosity function. In detail, the availability of individually measured
masses for all HIFLUGCS clusters was ignored and the mass for each cluster was
instead estimated from its luminosity and the
relation (M|L in
Table 8 of RB02). With these "masses'', the quasi-mass function was constructed.
Then, predicted mass functions were fit to the quasi-mass function, following
the procedure described in detail in RB02, resulting in best fit
values
 and
and
 - almost precisely the values favored by the new
cosmology (Fig. 3).
Since Stanek et al. (2006) argue that the normalization of the HIFLUGCS -
relation is
overestimated by a factor of 2, we divided the normalization by 2 and repeated
the above procedure. The new best fit values were
and
- almost precisely the values favored by the new
cosmology (Fig. 3).
Since Stanek et al. (2006) argue that the normalization of the HIFLUGCS -
relation is
overestimated by a factor of 2, we divided the normalization by 2 and repeated
the above procedure. The new best fit values were
and
 ;
i.e., almost exactly the concordance cosmology assumed by
Stanek et al. (2006). Therefore, assuming the new cosmology from the WMAP 3rd year
data, we conclude that the factor of 2 bias found by Stanek et al. (2006) is due to
assuming the "wrong'' cosmological model. This conclusion is qualitatively
consistent with their relation
;
i.e., almost exactly the concordance cosmology assumed by
Stanek et al. (2006). Therefore, assuming the new cosmology from the WMAP 3rd year
data, we conclude that the factor of 2 bias found by Stanek et al. (2006) is due to
assuming the "wrong'' cosmological model. This conclusion is qualitatively
consistent with their relation
 (note that the
"
(note that the
" '' in the relation they give in their abstract and in their derivation in
Sect. 4.2 seems to be a typo), which implies a factor of 3 reduction in
normalization when going from
to
.
Note that in a revised version of their paper, Stanek et al. will offer a
"compromise'' solution, assuming
'' in the relation they give in their abstract and in their derivation in
Sect. 4.2 seems to be a typo), which implies a factor of 3 reduction in
normalization when going from
to
.
Note that in a revised version of their paper, Stanek et al. will offer a
"compromise'' solution, assuming
 (for
(for
 ), resulting in
moderate scatter in the
relation and a smaller bias (A. Evrard,
priv. comm.).
), resulting in
moderate scatter in the
relation and a smaller bias (A. Evrard,
priv. comm.).
![\begin{figure}
\par\includegraphics[width=7.3cm,clip]{5331fig3.ps}\end{figure}](/articles/aa/full/2006/27/aa5525-06/img28.gif) |
Figure 3:
Quasi-mass functions estimated from luminosity function and
luminosity-mass relations.
Filled circles:
relation as measured with HIFLUGCS;
open squares: normalization of this relation artificially divided by a factor
of 2. The solid lines indicate the respective best fit mass functions:
(
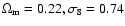 )
and ( )
and (
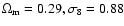 ); the former result
is very close to the new cosmology favored by WMAP and the latter very close
to the concordance model. ); the former result
is very close to the new cosmology favored by WMAP and the latter very close
to the concordance model. |
| Open with DEXTER | |
The absence of a strong bias found here also implies that the
intrinsic scatter in the
relation may indeed be relatively small.
Assume, unrealistically, that there is zero intrinsic scatter. This would imply
a bias factor of 1 (i.e., no bias at all) for cluster samples drawn from a given
mass distribution,
regardless of how the sample was selected, because all clusters with a given
mass have exactly the same luminosity. The larger the scatter the larger the
bias in flux-limited samples, therefore, a small bias indicates small scatter.
Zhang et al. (2006) use 14 clusters from an almost volume-complete sample.
As mentioned in Reiprich (2001), in truly volume-limited samples there should be no
bias in the normalization of the
relation, regardless of the amount
of intrinsic scatter. In their
XMM-Newton analysis Zhang et al. confirm normalization and
scatter of the RB02 luminosity-mass relation, corroborating our result here
that the bias is small.
Note that we do not argue here that the bias factor in the
normalization of the -
relation estimated from flux-limited samples
is exactly 1 (see our references above), but rather that a bias factor of 2 as found by Stanek et al. (2006) is a strong overestimate unless the new WMAP results
are "wrong'' or unless another competing systematic effect conspires to hide a
bias this large.
That the intrinsic scatter is indeed larger than zero is,
e.g., indicated by the observed segregation of cooling core clusters towards the
high luminosity side for a given mass in the
relation (Y. Chen et al., in prep.; Reiprich & Sarazin 2003) and by temporary luminosity increases in major
mergers predicted by simulations (e.g., Randall et al. 2002). We are currently
studying these effects in more detail with better data.
To derive an upper limit on the bias allowed by the WMAP 3rd year data we used
the largest
and
values consistent with the quoted
uncertainties:
 and
and
 (Spergel et al. 2006, note that we combined the
uncertainties in
(Spergel et al. 2006, note that we combined the
uncertainties in
 and h in a worst case fashion, to be
conservative). Then the quasi-mass function fit
procedure was repeated for varying bias factors. The largest bias factor for
which the 1-
and h in a worst case fashion, to be
conservative). Then the quasi-mass function fit
procedure was repeated for varying bias factors. The largest bias factor for
which the 1- error ellipse is still consistent with
and
is 1.5. Therefore, we conclude that the bias factor
error ellipse is still consistent with
and
is 1.5. Therefore, we conclude that the bias factor  ,
unless
and/or
are larger than allowed by
the WMAP 3rd year data. Without being less conservative, a tighter constraint on
the bias parameter seems currently not feasible with this method because of the
existing uncertainties in
and
and the strong sensitivity of the
cluster mass function on these parameters.
,
unless
and/or
are larger than allowed by
the WMAP 3rd year data. Without being less conservative, a tighter constraint on
the bias parameter seems currently not feasible with this method because of the
existing uncertainties in
and
and the strong sensitivity of the
cluster mass function on these parameters.
Despite the very good agreement with the new WMAP results, it should be noted that in their ROSAT and ASCA analysis RB02 had to use rather simplifying assumptions in their determination of cluster masses. For instance, the intracluster medium was assumed to be isothermal throughout the entire cluster volume and for some clusters only a relatively small number of photons was available for the determination of the gas density profile. With the new generation of X-ray satellites these limitations can be overcome. Therefore, we are currently following-up all HIFLUGCS clusters with Chandra (Hudson et al., in prep.; Reiprich et al. 2006) and XMM-Newton (Nenestyan et al., in prep.). This should allow us to get a realistic estimate of the intrinsic scatter directly.
and
between WMAP
1st year and WMAP 3rd year data has a significant effect on predictions of
cluster abundances because they are very sensitive to even small changes
in these parameters.
 and
,
as favored by the WMAP 3rd
year data.
and
,
we find that the
expected bias in normalization when determining the cluster
luminosity-mass relation from flux-limited samples is small - much
smaller than the factor of 2 claimed previously.
and
,
the largest values allowed
by the new WMAP data, we derive a conservative upper limit on the bias
factor of 1.5.
-debate, which seems to have resulted in a loss
of trust in cosmological constraints derived from clusters within the cosmology
community. Now that other well-respected methods like those that rely on
measurements of anisotropies in the cosmic microwave background also tend
to find lower values of ,
we hope that trust in clusters will
be restored. Clusters are ideally suited to address the new fundamental
questions in cosmology (e.g., Mohr 2005): planned X-ray cluster surveys like
those to be performed with eROSITA are expected to yield up to 100 000 clusters out to large redshifts. The resulting detailed measurements of the
evolution of cosmic structure are among the most promising routes to pin down
the nature and evolution of dark energy.
and
,
as favored by the WMAP 3rd
year data.
and
,
we find that the
expected bias in normalization when determining the cluster
luminosity-mass relation from flux-limited samples is small - much
smaller than the factor of 2 claimed previously.
and
,
the largest values allowed
by the new WMAP data, we derive a conservative upper limit on the bias
factor of 1.5.
-debate, which seems to have resulted in a loss
of trust in cosmological constraints derived from clusters within the cosmology
community. Now that other well-respected methods like those that rely on
measurements of anisotropies in the cosmic microwave background also tend
to find lower values of ,
we hope that trust in clusters will
be restored. Clusters are ideally suited to address the new fundamental
questions in cosmology (e.g., Mohr 2005): planned X-ray cluster surveys like
those to be performed with eROSITA are expected to yield up to 100 000 clusters out to large redshifts. The resulting detailed measurements of the
evolution of cosmic structure are among the most promising routes to pin down
the nature and evolution of dark energy.
Acknowledgements
We thank the anonymous referee for quick and useful comments. T.H.R. acknowledges support by the Deutsche Forschungsgemeinschaft through Emmy Noether Research Grant RE 1462.