![\begin{figure}
\par\includegraphics[width=7.3cm,clip]{5331fig1.ps}\end{figure}](/articles/aa/full/2006/27/aa5525-06/img17.gif) |
Figure 1:
Galaxy cluster mass functions. Filled circles: HIFLUGCS data (63 clusters); dashed line: best fit to HIFLUGCS data; upper solid line: predicted by
concordance model (
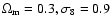 ), which was a very good fit to the
WMAP 1st year data; lower solid line: predicted by best fit to the WMAP 3rd year
data ( ), which was a very good fit to the
WMAP 1st year data; lower solid line: predicted by best fit to the WMAP 3rd year
data (
 ). The concordance model predicts too many (>200) clusters in the survey volume while the new cosmology predicts about
the correct number. Adapted from Reiprich (2005, Fig. 10.87). ). The concordance model predicts too many (>200) clusters in the survey volume while the new cosmology predicts about
the correct number. Adapted from Reiprich (2005, Fig. 10.87). |
| Open with DEXTER | |
In the text
![\begin{figure}
\par\includegraphics[width=7.3cm,clip]{5331fig2.ps}\end{figure}](/articles/aa/full/2006/27/aa5525-06/img20.gif) |
Figure 2:
The best fit model to the WMAP 3rd year data lies exactly at the
intersection of the
 relations from HIFLUGCS and COBE. COBE
relation from Bunn & White (1997), calculated using a code provided by T. Kitayama.
Adapted from Reiprich (2003).
relations from HIFLUGCS and COBE. COBE
relation from Bunn & White (1997), calculated using a code provided by T. Kitayama.
Adapted from Reiprich (2003). |
| Open with DEXTER | |
In the text
![\begin{figure}
\par\includegraphics[width=7.3cm,clip]{5331fig3.ps}\end{figure}](/articles/aa/full/2006/27/aa5525-06/img28.gif) |
Figure 3:
Quasi-mass functions estimated from luminosity function and
luminosity-mass relations.
Filled circles:
 relation as measured with HIFLUGCS;
open squares: normalization of this relation artificially divided by a factor
of 2. The solid lines indicate the respective best fit mass functions:
( relation as measured with HIFLUGCS;
open squares: normalization of this relation artificially divided by a factor
of 2. The solid lines indicate the respective best fit mass functions:
(
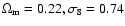 )
and ( )
and (
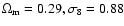 ); the former result
is very close to the new cosmology favored by WMAP and the latter very close
to the concordance model. ); the former result
is very close to the new cosmology favored by WMAP and the latter very close
to the concordance model. |
| Open with DEXTER | |
In the text