 |
Figure 1: Comparison of the atomic parameters S2 and D2 for all the transitions considered in the present analysis. Different symbols are used to distinguish lines of different ions: open circles for Fe I, filled circles for Fe II, asterisks for Cr II, open triangles for O II, and filled triangles for N II. |
| Open with DEXTER | |
In the text
![\begin{figure}
\par\resizebox{15.5cm}{!}{\includegraphics[clip]{4353-2a.eps}\hsp...
...[clip]{4353-2b.eps}\hspace*{8mm}\includegraphics[clip]{4353-2c.eps}}\end{figure}](/articles/aa/full/2006/26/aa4353-05/Timg116.gif) |
Figure 2: Contribution of the intrinsic ( left), Doppler ( centre), and magnetic ( right) parts of the profiles of the lines of Fe I observed in HD 116114 to their second-order moment about their centre ( see text). The dashed line is the term of the least-squares fit of the observations corresponding to that contribution. The relative weights of the different lines in the regression analysis yielding this best fit line are illustrated by the sizes of the dots representing them. |
| Open with DEXTER | |
In the text
![\begin{figure}
\par\resizebox{15.5cm}{!}{\includegraphics[clip]{4353-3a.eps}\hsp...
...[clip]{4353-3b.eps}\hspace*{8mm}\includegraphics[clip]{4353-3c.eps}}\end{figure}](/articles/aa/full/2006/26/aa4353-05/Timg133.gif) |
Figure 3: Same as Fig. 2 for the lines of Fe I observed in HD 133792. Note that the ordinate range is nearly one order of magnitude smaller than in Fig. 2. |
| Open with DEXTER | |
In the text
 |
Figure 4: The values for the Cr II lines analysed in HD 94660 of the three independent variables appearing in the right-hand sides of Eqs. (15) and (16) are plotted against each other, pair by pair, as a check of possible mutual correlations between these variables. |
| Open with DEXTER | |
In the text
 |
Figure 5: Plot of the estimated error of the second-order moment of the profiles of the lines of Fe II observed in HD 94660 against the ratio of the second-order moment of these lines to their equivalent width. |
| Open with DEXTER | |
In the text
 |
Figure 6: Same as Fig. 2 for the lines of Fe I observed in HD 91375. |
| Open with DEXTER | |
In the text
 |
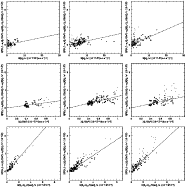
Figure 7: Contribution of the intrinsic ( top row), Doppler ( centre row), and magnetic ( bottom row) parts of the profiles of the lines of Fe I ( left column), Fe II ( centre column) and Cr II ( right column), observed in HD 116458 to their second-order moment about their centre ( see text). The dashed line is the term of the least-squares fit of the observations of each ion corresponding to that contribution. The relative weights of the different lines in the regression analysis yielding this best fit line are illustrated by the sizes of the symbols representing them. |
| Open with DEXTER | |
In the text
 |
Figure 8:
Same as Fig. 2, for the lines of Fe II
observed in HD 116458, after exclusion from the sample of
those for which
|
| Open with DEXTER | |
In the text