A&A 452, 387-395 (2006)
DOI: 10.1051/0004-6361:20054571
B. Meneux1 - O. Le Fèvre1 - L. Guzzo2 - A. Pollo1,2 - A. Cappi3 - O. Ilbert4 - A. Iovino5 - C. Marinoni5,6 - H. J. McCracken7,8 - D. Bottini9 - B. Garilli9 - V. Le Brun1 - D. Maccagni9 - J. P. Picat10 - R. Scaramella11 - M. Scodeggio9 - L. Tresse1 - G. Vettolani12 - A. Zanichelli12 - C. Adami1 - S. Arnouts1 - M. Arnaboldi13 - S. Bardelli3 - M. Bolzonella4 - S. Charlot7,14 - P. Ciliegi3 - T. Contini10 - S. Foucaud15 - P. Franzetti9 - I. Gavignaud10,16 - B. Marano4 - A. Mazure1 - R. Merighi3 - S. Paltani17,18 - R. Pellò10 - L. Pozzetti3 - M. Radovich13 - G. Zamorani3 - E. Zucca3 - M. Bondi12 - A. Bongiorno4 - G. Busarello13 - O. Cucciati2,14 - L. Gregorini12 - F. Lamareille10 - G. Mathez10 - Y. Mellier7,8 - P. Merluzzi13 - V. Ripepi13 - D. Rizzo10
1 -
Laboratoire d'Astrophysique de Marseille, UMR 6110 CNRS, Université de Provence, BP 8, 13376 Marseille Cedex 12, France
2 -
INAF - Osservatorio Astronomico di Brera, via Bianchi 46, 23807 Merate, Italy
3 -
INAF - Osservatorio Astronomico di Bologna, via Ranzani,1, 40127 Bologna, Italy
4 -
Università di Bologna, Dipartimento di Astronomia, via Ranzani, 1, 40127 Bologna, Italy
5 -
INAF - Osservatorio Astronomico di Brera, via Brera 28, Milan, Italy
6 -
Centre de Physique Theorique, UMR 6207 CNRS, Université de Provence, case 907, 13288 Marseille, France
7 -
Institut d'Astrophysique de Paris, Université Pierre et Marie Curie, UMR 7095, 98 bis Bvd Arago, 75014 Paris, France
8 -
Observatoire de Paris, LERMA, 61 Avenue de l'Observatoire, 75014 Paris, France
9 -
INAF - IASF Milano, via Bassini 15, 20133 Milano, Italy
10 -
Laboratoire d'Astrophysique de l'Observatoire Midi-Pyrénées (UMR 5572), 14 avenue E. Belin, 31400 Toulouse, France
11 -
INAF - Osservatorio Astronomico di Roma, via di Frascati 33, 00040 Monte Porzio Catone, Italy
12 -
IRA - INAF, via Gobetti 101, 40129 Bologna, Italy
13 -
INAF - Osservatorio Astronomico di Capodimonte, via Moiariello 16, 80131 Napoli, Italy
14 -
Max Planck Institut fur Astrophysik, 85741 Garching, Germany
15 -
School of Physics & Astronomy, University of Nottingham, Nottingham NG7 2RD, UK
16 -
European Southern Observatory, Karl-Schwarzschild-Strasse 2, 85748 Garching bei Munchen, Germany
17 -
Integral Science Data Centre, ch. d'Écogia 16, 1290 Versoix, Switzerland
18 -
Geneva Observatory, ch. des Maillettes 51, 1290 Sauverny, Switzerland
19 -
Universitá di Milano-Bicocca, Dipartimento di Fisica, Piazza delle Scienze 3, 20126 Milano, Italy
Received 22 November 2005 / Accepted 11 February 2006
Abstract
We measure
the evolution of clustering for galaxies with different spectral types
from 6495 galaxies with
![]() and measured spectroscopic
redshifts in the first epoch VIMOS-VLT Deep Survey (VVDS). We divide our
sample into four classes, based on the fit of well-defined galaxy spectral
energy distributions on observed multi-color data.
We measure the projected correlation function
and measured spectroscopic
redshifts in the first epoch VIMOS-VLT Deep Survey (VVDS). We divide our
sample into four classes, based on the fit of well-defined galaxy spectral
energy distributions on observed multi-color data.
We measure the projected correlation function
![]() and estimate the best-fit
parameters for a power-law real-space correlation function
and estimate the best-fit
parameters for a power-law real-space correlation function
![]() .
We find the clustering of early-spectral-type galaxies to be markedly
stronger than that of late-type galaxies at all redshifts up to
.
We find the clustering of early-spectral-type galaxies to be markedly
stronger than that of late-type galaxies at all redshifts up to
![]() .
At
.
At ![]() ,
early-type galaxies display a correlation length
,
early-type galaxies display a correlation length
![]() h-1 Mpc, while late types have
h-1 Mpc, while late types have
![]() h-1 Mpc.
For the latest class of star-forming blue galaxies, we are able
to push our clustering measurement to an effective redshift
h-1 Mpc.
For the latest class of star-forming blue galaxies, we are able
to push our clustering measurement to an effective redshift ![]() ,
for luminous galaxies (
,
for luminous galaxies (
![]() ). The clustering of
these objects increases up to
). The clustering of
these objects increases up to
![]() h-1 Mpc for
z=[1.2,2.0].
The relative bias between early- and late-type galaxies within our magnitude-limited survey
remains approximately constant with
h-1 Mpc for
z=[1.2,2.0].
The relative bias between early- and late-type galaxies within our magnitude-limited survey
remains approximately constant with
![]() from z=0 to z=1.2.
This result is in agrement with the local findings and fairly robust against different
way of classifying red and blue galaxies. When compared to the expected linear growth
of mass fluctuations, a natural interpretation of these observations is that:
(a) the assembly of massive early type galaxies is already mostly complete in the densest
dark matter halos at
from z=0 to z=1.2.
This result is in agrement with the local findings and fairly robust against different
way of classifying red and blue galaxies. When compared to the expected linear growth
of mass fluctuations, a natural interpretation of these observations is that:
(a) the assembly of massive early type galaxies is already mostly complete in the densest
dark matter halos at ![]() ;
(b) luminous late-type galaxies are located in higher-density, more clustered regions of
the Universe at
;
(b) luminous late-type galaxies are located in higher-density, more clustered regions of
the Universe at
![]() than their local low luminous counterpart, indicating that
star formation activity is progressively increasing, going back in time, in the higher-density peaks that
today are mostly dominated by old galaxies.
than their local low luminous counterpart, indicating that
star formation activity is progressively increasing, going back in time, in the higher-density peaks that
today are mostly dominated by old galaxies.
Key words: surveys - galaxies: evolution - cosmology: large scale structure of Universe - cosmology: observations
The measurement of the evolution of the clustering of galaxies is one the
key elements to understand the evolution of the Universe and the
formation of the large-scale structures of the Universe. In the current paradigm, the
structures we observe today in the large-scale distribution of galaxies
are the result of the gravitational amplification of primordial
overdensities in the dark matter density field. Smaller scales
are supposed to collapse first, with virialized structures as galaxies,
groups and clusters subsequently built up via multiple merging,
at a rate of growth essentially governed by the value of the mean
matter density
![]() .
In this hierarchical formation scenario,
the evolution of the clustering of dark matter halos is now well
understood both analytically (Mo & White 1996; Sheth & Tormen 1999) and from N-body
simulations (Kauffmann et al. 1999a; Springel et al. 2005; Jenkins et al. 1998).
.
In this hierarchical formation scenario,
the evolution of the clustering of dark matter halos is now well
understood both analytically (Mo & White 1996; Sheth & Tormen 1999) and from N-body
simulations (Kauffmann et al. 1999a; Springel et al. 2005; Jenkins et al. 1998).
The visible component of galaxies is expected to assemble via the
collapse of baryonic matter within the dark matter halos. A naive
picture would let to conclude that galaxies follow the underlying
dark matter density field.
The formation and evolution of galaxies is, however, driven by physical
processes such as cooling, star formation and feedback, which are
not easily linked
to the underlying dark matter halos (Kauffmann et al. 1999a).
Rather, a general prediction of most current models is that galaxy
formation is favored in higher-density regions. Objects forming
in regions of larger-than-average density collapse first and,
looking back in time,
are found to inhabit higher and higher density peaks (i.e., they
are more biased). Recent direct measurements of the evolution
of galaxy bias up to a redshift ![]() (Marinoni et al. 2005)
provide supporting evidence to this biased picture of galaxy formation.
(Marinoni et al. 2005)
provide supporting evidence to this biased picture of galaxy formation.
Although being well known since more that 25 years, the origin of the relationship between galaxy morphological (or almost equivalently, spectral) type and local structure is still not fully understood (e.g. Smith et al. 2005; Postman et al. 2005; Dressler 1980). Whether the higher fraction of early-type galaxies in high- density regions is established ab initio (the so-called nature hypothesis), or rather produced by environmental effects during the life of the galaxy (nurture) is still debated. A practical effect of the morphology-density relation is that early- and late-type galaxies trace differently the density field, with the former class being more clustered (i.e. more biased) than the latter. In addition, more luminous galaxies (which are preferentially early-types) are more clustered than less luminous ones, with the two parameters - luminosity and spectral type - playing together in a subtle way (Norberg et al. 2002; Guzzo et al. 1997; Benoist et al. 1996; Loveday Tresse & Maddox 1999; Iovino et al. 1993; Zehavi et al. 2002; Madgwick et al. 2003). Since the amount of biasing should be related to the mass and formation history of a galaxy, one therefore expects the evolution of the clustering of galaxies with different morphological types to contain important clues on the assembly of the baryonic mass and the origin of galaxy types.
Large deep surveys consistently show that the clustering of
the overall galaxy population evolves slowly with time
(Le Fèvre et al. 2005b; Coil et al. 2004). Measurements from the VIMOS-VLT Deep Survey
(VVDS, Le Fèvre et al. 2005b) indicate that the clustering amplitude of
![]() galaxies increases by a factor
galaxies increases by a factor
![]() from z=1.5 to
the present epoch. However, little is known about
the clustering evolution of different galaxy types
above
from z=1.5 to
the present epoch. However, little is known about
the clustering evolution of different galaxy types
above ![]() .
In the CFRS sample, no significant
difference was observed between the clustering of red and blue
galaxies up to
.
In the CFRS sample, no significant
difference was observed between the clustering of red and blue
galaxies up to ![]() (Le Fèvre et al. 1996), although the sample
was too small to reach firm conclusions.
Red galaxies at
(Le Fèvre et al. 1996), although the sample
was too small to reach firm conclusions.
Red galaxies at
![]() in the CNOC2 survey were
found to have a clustering amplitude
in the CNOC2 survey were
found to have a clustering amplitude ![]() 5 times higher than blue
galaxies (Carlberg et al. 1997).
Results from the CADIS survey using photometric redshifts indicate
that up to
5 times higher than blue
galaxies (Carlberg et al. 1997).
Results from the CADIS survey using photometric redshifts indicate
that up to ![]() early spectral type galaxies are more clustered,
with a correlation amplitude 2.1 times larger than late type
at z = [0.75-1.07] (Phleps & Meisenheimer 2003).
A more recent and accurate estimate at
early spectral type galaxies are more clustered,
with a correlation amplitude 2.1 times larger than late type
at z = [0.75-1.07] (Phleps & Meisenheimer 2003).
A more recent and accurate estimate at
![]() (Phleps et al. 2005)
confirms the same trend among red and blue galaxies with
(Phleps et al. 2005)
confirms the same trend among red and blue galaxies with
![]() h-1 Mpc and
h-1 Mpc and
![]() h-1 Mpc.
At even higher redshifts, the measurement of type is substituted by
the selection of specific sub-populations, e.g. Daddi et al. (2003)
measure a strong
clustering of extremely red (J-K) galaxies at
h-1 Mpc.
At even higher redshifts, the measurement of type is substituted by
the selection of specific sub-populations, e.g. Daddi et al. (2003)
measure a strong
clustering of extremely red (J-K) galaxies at
![]() ,
arguing that these may represent the progenitors of massive
elliptical galaxies at lower redshifts.
,
arguing that these may represent the progenitors of massive
elliptical galaxies at lower redshifts.
In this paper we make an attempt to quantify accurately the contribution
of different galaxy types to the observed evolution of clustering
using the VVDS first epoch survey. The accuracy of
spectroscopic redshifts is used to project the correlation function
![]() in narrow velocity intervals and to measure the
correlation length r0 and the slope
in narrow velocity intervals and to measure the
correlation length r0 and the slope ![]() of the real space
correlation function as a function of redshift up to
of the real space
correlation function as a function of redshift up to ![]() .
.
We describe the sample and our galaxy classification in Sect. 2,
and the method used to compute the real space correlation function
in Sect. 3. The clustering measurements are presented in Sect. 4,
and then discussed in Sect. 5.
We use a cosmology with
![]() ,
,
![]() ,
throughout the paper. All distances, given in comoving units,
and absolute magnitudes are computed with h=1 (which denotes
H0/100 km s-1 Mpc-1).
,
throughout the paper. All distances, given in comoving units,
and absolute magnitudes are computed with h=1 (which denotes
H0/100 km s-1 Mpc-1).
We used the galaxy classification introduced by Zucca et al. (2005) to study the evolution of the luminosity function per galaxy type from the first epoch VVDS data. The classification has been obtained from the B to I band multi-wavelength dataset available in the VVDS-02h field (Le Fèvre et al. 2004a; McCracken et al. 2003), and the spectroscopic redshifts (Le Fèvre et al. 2005a). The U band, which does not cover all the field (Radovich et al. 2003) was not used in order to get a homogeneous classification on the sky. Rest-frame colors have been matched to the empirical set of spectral energy distribution (SED) templates described in Arnouts et al. (1999), made of four observed spectra (Coleman Wu & Weedman 1980, CWW hereafter) and two starburst SEDs computed with GISSEL (Bruzual & Charlot 1993).
The original spectroscopic sample of 6495 galaxies was divided into
four spectral classes from early-type (type 1) to
irregular/star-forming galaxies (type 4) based on the CWW templates.
The latest type also includes galaxies with SEDs well represented
by starburst templates. The properties of these four classes
of galaxies are summarized in Table 1 and
their redshift distributions are shown in Fig. 1.
As a result of the VVDS I-band selection, we are increasingly loosing red early-type galaxies for
redshifts
![]() (Fig. 2) because galaxies are
selected from their rest frame UV flux at these redshifts, but
late type galaxies continue to be identified up to the highest redshifts
discussed in this paper.
(Fig. 2) because galaxies are
selected from their rest frame UV flux at these redshifts, but
late type galaxies continue to be identified up to the highest redshifts
discussed in this paper.
Table 1: The four VVDS galaxy types.
![\begin{figure}
\par\includegraphics[width=8cm,clip]{4571fg1.ps}
\end{figure}](/articles/aa/full/2006/23/aa4571-05/img35.gif) |
Figure 1: Redshift distribution of the four galaxy types. |
| Open with DEXTER | |
![\begin{figure}
\par\includegraphics[width=8cm,clip]{4571fg2.ps}
\end{figure}](/articles/aa/full/2006/23/aa4571-05/img36.gif) |
Figure 2: Rest-frame color (B-I)AB for early-type galaxies (types 1 and 2) and late-type galaxies (type 3 and 4) computed from the best fit of our multi-wavelength dataset with PEGASE.2 templates (Fioc & Rocca-Volmerange 1997). |
| Open with DEXTER | |
As described in Zucca et al. (2005),
the evolution of the global luminosity function in the VVDS
is strongly driven by type 4 galaxies, which evolve
by ![]() -2 mag from
-2 mag from ![]() and present a steep
faint end luminosity function slope. Conversely, the luminosity
function of early type galaxies remains stable over this
redshift range. The relative distribution
of absolute magnitudes per type presented in Fig. 3
is the result of this evolution.
and present a steep
faint end luminosity function slope. Conversely, the luminosity
function of early type galaxies remains stable over this
redshift range. The relative distribution
of absolute magnitudes per type presented in Fig. 3
is the result of this evolution.
![\begin{figure}
\par\includegraphics[width=8cm,clip]{4571fg3.ps}
\end{figure}](/articles/aa/full/2006/23/aa4571-05/img37.gif) |
Figure 3: B-band luminosity distribution MB(AB) for early-type galaxies (types 1 and 2) and late-type galaxies (types 3 and 4). |
| Open with DEXTER | |
In summary, the type classification used in this paper is a spectral classification based on a set of spectral templates covering from early type galaxies to late and star-forming galaxies. Although it is tempting to associate spectral type to morphological type, and a close relationship exists between them, the spectral classification used in this paper is more closely related to a color classification from "red'' to "blue'' galaxies.
The method to recover the correlation length r0 and the slope ![]() of the real-space correlation
function is well detailed in the paper of Pollo et al. (2005).
We are focusing here on the most critical
aspects of the method when applied
to compute the clustering properties
as a function of galaxy type.
of the real-space correlation
function is well detailed in the paper of Pollo et al. (2005).
We are focusing here on the most critical
aspects of the method when applied
to compute the clustering properties
as a function of galaxy type.
We computed the bi-dimensional two-point correlation function
![]() for each galaxy type, in different redshift bins chosen to maximize
the number of objects hence the signal to noise ratio of the
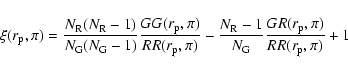
clustering measurement. This was estimated using the Landy & Szalay (1993) estimator
for each galaxy type, in different redshift bins chosen to maximize
the number of objects hence the signal to noise ratio of the
clustering measurement. This was estimated using the Landy & Szalay (1993) estimator
The real-space correlation function ![]() represents the excess
probability for a given pair of galaxies to be observed at a separation r (Peebles 1980). It can be derived from
represents the excess
probability for a given pair of galaxies to be observed at a separation r (Peebles 1980). It can be derived from
![]() using the formalism of Davis & Peebles (1983), computing
using the formalism of Davis & Peebles (1983), computing
![]() ,
the projection
of
,
the projection
of
![]() along the line of sight.
along the line of sight.
In order to correct for the observational biases introduced by the VVDS observing strategy in the VVDS-02h field, we used the same correction scheme explained in Pollo et al. (2005). The main biases are the incompleteness in redshift measurement and the complex geometry of the field. This results in a spatial sampling that changes as a function of position in the field. To account for galaxies with unknown redshift (either unobserved or discarded because of a low redshift quality flag), the observed galaxies are given a weight. The goal of this weight is to recover the true number of galaxy pairs at a given angular scale.
The computation of this local weight takes into account the local number of galaxies (with and without a redshift) around a given galaxy in the spectroscopic sample. The parent photometric sample used for this computation must have the same properties as the spectroscopic one. For instance, the weight computed for the early type galaxies from the spectroscopic sample must make a reference only to the early type galaxies in the underlying complete photometric sample, without including other galaxy types. In this approach, the parent photometric catalogue used to compute the weight must therefore only contain galaxies with the same properties as those of the spectroscopic sample.
Photometric redshifts of all the galaxies in the VVDS-02h have been derived from BVRI photometry (Le Fèvre et al. 2004a; McCracken et al. 2003), and ugriz bands from the CFHT Legacy Survey. Details are presented in Ilbert et al. (in prep.). The photometric redshifts and rest-frame magnitudes were then used to give a spectral type to all these galaxies, according to the method explained in Sect. 2.2. The complete parent photometric catalogue was then divided in four catalogues, one for each type. Note that the photometric redshifts are only used to define a spectral type to each galaxy in the whole photometric catalog in order to compute the weights associated to each galaxy type, in addition to the spectroscopically measured galaxies. Photometric redshifts are not directly used here in the computation of the correlation function.
Even if our spectroscopic sample is the largest to date at this depth,
and despite the angular size of the VVDS-02h (1750 arcmin2),
the uncertainties associated to the measurement
of the power-law parameters of the real-space correlation function ![]() are largely dominated by the cosmic variance.
are largely dominated by the cosmic variance.
To assess this, we have constructed 50 VVDS-02h mock surveys from
the GalICS simulation (Blaizot et al. 2005). GalICS is a semi-analytic
model for galaxy evolution post-processed to a large cosmological
N-body simulation. These mock surveys are quasi-independent and are
built applying all the VVDS-02h observing biases: the complex geometry
of the field, the spectroscopic selection function, the redshift
measurement accuracy, the incompleteness
(see Pollo et al. 2005, for more information).
We use the clustering variance in the mock
samples to quantify the cosmic variance expected on the correlation
length r0 and the slope ![]() of the real-space correlation
function.
of the real-space correlation
function.
Our method to assign a spectral type to a given galaxy does not work
so well with the GalICS simulations. We were not able to recover a
realistic redshift distribution for the four spectral types using
the CFH12k BVRI apparent magnitudes produced by GalICS. For example,
there were no type 1 (elliptical) galaxies beyond ![]() in most of the
50 GalICS cones. Conversely, the galaxy type classification given
in for GalICS data do not match ours. This "Morphological'' type
classification is based on rest-frame B-band (bulge+burst)-to-disc
luminosity ratio. This provides a huge "spiral'' class (on average
in most of the
50 GalICS cones. Conversely, the galaxy type classification given
in for GalICS data do not match ours. This "Morphological'' type
classification is based on rest-frame B-band (bulge+burst)-to-disc
luminosity ratio. This provides a huge "spiral'' class (on average
![]() 90% of the full dataset), and two equivalent (in number of
objects) "elliptical'' and "lenticular'' classes. These two last
classes could match our type 1 class. But then, this is quite
difficult to divide the huge "spiral'' class in our 3 later types.
90% of the full dataset), and two equivalent (in number of
objects) "elliptical'' and "lenticular'' classes. These two last
classes could match our type 1 class. But then, this is quite
difficult to divide the huge "spiral'' class in our 3 later types.
Computing error measurements from a bootstrap resampling method
slightly under-estimates the real variance: if we consider the full
VVDS-02h data set (Le Fèvre et al. 2005b), the relative errors computed
from GalICS are
![]() times greater than error computed
from bootstrap resampling. We expect similar factor when dividing
our sample per spectral type.
times greater than error computed
from bootstrap resampling. We expect similar factor when dividing
our sample per spectral type.
Therefore the approach that has been chosen to compute measurement errors consists in taking randomly, in each of the 50 mock VVDS-02h surveys, a proportion of galaxies equal to that found in the VVDS-02h spectroscopic sample for a given spectral class. Even if the clustering measured is the one of the "full'' population with higher incertainties, the statistic of each "type'' is representative of the real one. The variance from field to field is artificially increased by a broader range of clustering properties in the simulated data, and therefore, this method is very conservative in the way that it is expected to produce errors for the observed data larger than in reality.
![\begin{figure}
\par\includegraphics[width=8.5cm,clip]{4571fg4.ps}
\end{figure}](/articles/aa/full/2006/23/aa4571-05/img54.gif) |
Figure 4:
(Left) Correlation function
|
| Open with DEXTER | |
![\begin{figure}
\par\includegraphics[width=8.2cm,clip]{4571fg5.ps}
\end{figure}](/articles/aa/full/2006/23/aa4571-05/img55.gif) |
Figure 5: Same as Fig. 4 for galaxies with type 3. |
| Open with DEXTER | |
![\begin{figure}
\par\includegraphics[width=8.5cm,clip]{4571fg6.ps}
\end{figure}](/articles/aa/full/2006/23/aa4571-05/img56.gif) |
Figure 6: Same as Fig. 4 for galaxies with type 4. |
| Open with DEXTER | |
![\begin{figure}
\par\includegraphics[width=8.5cm,clip]{4571fg7.ps}
\end{figure}](/articles/aa/full/2006/23/aa4571-05/img57.gif) |
Figure 7: Same as Fig. 4 for galaxies with types 3 and 4. |
| Open with DEXTER | |
Table 2:
Measurement of the clustering length for galaxy subsamples
ranging from z=0.2 to z=2, letting the slope ![]() free or
fixing the slope to the average value measured for a given type.
The absolute
MBAB magnitude and number of objects
are indicated.
free or
fixing the slope to the average value measured for a given type.
The absolute
MBAB magnitude and number of objects
are indicated.
The projection
![]() has been fitted by a power-law on scales
has been fitted by a power-law on scales
![]() h-1 Mpc. The values of the correlation
length r0 and the slope
h-1 Mpc. The values of the correlation
length r0 and the slope ![]() of the real-space correlation function
are summarized in Table 2.
A clear difference in clustering strength is observed
between the 3 classes of galaxies: T1&2, T3 and T4.
We find that on average the
clustering strength of early type galaxies is 1.8 times larger than
the clustering strength of type 4 galaxies. This is observed
over the full redshift range
of the real-space correlation function
are summarized in Table 2.
A clear difference in clustering strength is observed
between the 3 classes of galaxies: T1&2, T3 and T4.
We find that on average the
clustering strength of early type galaxies is 1.8 times larger than
the clustering strength of type 4 galaxies. This is observed
over the full redshift range
![]() and
this result is significant.
The probability that the correlation lengths of these two populations
are the same is indeed only 2.3% for the redshift bin z = [0.2, 0.5],
2.7% for z = [0.5, 0.7], 2.2% for z = [0.7, 0.9], and 14.5% for z = [0.9, 1.2].
and
this result is significant.
The probability that the correlation lengths of these two populations
are the same is indeed only 2.3% for the redshift bin z = [0.2, 0.5],
2.7% for z = [0.5, 0.7], 2.2% for z = [0.7, 0.9], and 14.5% for z = [0.9, 1.2].
The evolution of the clustering length for the different classes of galaxies
is presented in Fig. 8. An overall
increase in the clustering of all galaxy types is observed up to ![]() .
In the range z = [0.9, 1.2], there is a slight indication for a
weakening in the clustering of early type galaxies.
The clustering length of late type / star-forming galaxies continues to rise up to
redshift
.
In the range z = [0.9, 1.2], there is a slight indication for a
weakening in the clustering of early type galaxies.
The clustering length of late type / star-forming galaxies continues to rise up to
redshift ![]() 2.
2.
![\begin{figure}
\par\includegraphics[width=7.5cm,clip]{4571fg8.ps}
\end{figure}](/articles/aa/full/2006/23/aa4571-05/img142.gif) |
Figure 8:
Correlation length r0 as a function of redshift for early (T1&2) and late (T3&4) type galaxies.
Here the slope |
| Open with DEXTER | |
Since it is not possible to measure directly the real-space correlation function of the mass, any attempt to measure the bias b from galaxy samples has either to assume the knowledge of the background cosmological parameters (e.g. Marinoni et al. 2005), or to obtain the mass variance from other observables like the Cosmic Microwave Background (e.g. Lahav et al. 2002).
The simplest definition of
the bias b that links linearly the mass density field ![]() of the mass to
the galaxy density field n is (for a fixed scale R over which
of the mass to
the galaxy density field n is (for a fixed scale R over which ![]() and n are measured)
and n are measured)
This is in agreement with what is found locally for nearly the same color-selected
populations. For example Wild et al. (2005) using the 2dFGRS find on the same
8 h-1 Mpc scale,
![]() .
Moreover, at higher redshifts, this result is in agreement
with what has been found in a previous
VVDS study (Marinoni et al. 2005),
from the same data but using a different method.
.
Moreover, at higher redshifts, this result is in agreement
with what has been found in a previous
VVDS study (Marinoni et al. 2005),
from the same data but using a different method.
![\begin{figure}
\par\includegraphics[width=7.4cm,clip]{4571fg9.ps}
\end{figure}](/articles/aa/full/2006/23/aa4571-05/img158.gif) |
Figure 9:
Relative bias between populations of galaxies for a 8 h-1 Mpc scale:
|
| Open with DEXTER | |
![\begin{figure}
\par\includegraphics[width=7.4cm,clip]{4571fg10.ps}
\end{figure}](/articles/aa/full/2006/23/aa4571-05/img159.gif) |
Figure 10:
Correlation length r0 as a function of redshift for the red and blue samples.
Here the slope |
| Open with DEXTER | |
Table 3: Relative bias between early-type and late-type galaxies (from spectral type classification), and "red'' vs. "blue'' galaxies (separated using the color bi-modality).
It has become clear in recent years that the galaxy rest-frame colors show a bimodal distribution (Strateva et al. 2001), i.e. that in a (rest-frame) color-magnitude diagram galaxies tend to segregate between a "red sequence'' (similar, but less tight than that observed for cluster galaxies) and a "blue cloud''. This behavior seems also to be present at high redshift (Giallongo et al. 2005; Bell et al. 2004). From the SDSS data, Strateva et al. (2001) find that the blue cloud contains mainly late (spiral) morphological types while the bulk of the red sequence consists of bulge-dominated, early-type galaxies (see also Weiner et al. 2005). This provides a natural recipe to split galaxies into two populations of "red'' and "blue'' objects and there have been already attempts to study the clustering of galaxies separately for the two classes defined in this way at intermediate redshifts (e.g. Phleps et al. 2005).
It is therefore interesting to check how our analysis as a function of SED-defined types compares to a simpler sub-division following the bimodal distribution.
We have thus split our data into a blue and red sample, following the rest-frame
color-magnitude relations suggested
by Giallongo et al. (2005) and measured the
projected function
![]() and the best-fit power-law correlation
function
and the best-fit power-law correlation
function ![]() in different redshift bins.
The resulting evolution of the correlation length
is shown in Fig. 10, with the measured
values for r0 and
in different redshift bins.
The resulting evolution of the correlation length
is shown in Fig. 10, with the measured
values for r0 and ![]() summarized in Table 5.
The associated errors have been computed in the usual way, constructing
blue and red mock catalogues from the
GalICS simulations, keeping the same proportion of red (blue)
objects as in the real VVDS data.
summarized in Table 5.
The associated errors have been computed in the usual way, constructing
blue and red mock catalogues from the
GalICS simulations, keeping the same proportion of red (blue)
objects as in the real VVDS data.
Similarly to what we found for early-type classes, red-sequence
galaxies exhibit a larger clustering length (
![]() h-1 Mpc),
with little dependence on redshift. Comparison
to Fig. 8 indicates that the classification into
rest-frame red and blue galaxies is substantially equivalent to
our classification into spectral late-types, producing samples
with similar clustering evolution properties.
h-1 Mpc),
with little dependence on redshift. Comparison
to Fig. 8 indicates that the classification into
rest-frame red and blue galaxies is substantially equivalent to
our classification into spectral late-types, producing samples
with similar clustering evolution properties.
The relative bias between red and blue galaxies is measured to be
on average
![]() between
between ![]() and
and ![]() (see Table 3),
a value comparable with that derived using the spectral type classification.
(see Table 3),
a value comparable with that derived using the spectral type classification.
In summary, using the bi-modal split of the population we find results consistent with our analysis per spectral types. However, we note that the simple rest-frame color-magnitude cut is a less precise way of selecting truly early-type galaxies, at least for z>0.7, since the full multi-color information is used to provide the spectral type classification.
Table 4: Number of galaxies and mean B rest-frame absolute magnitude (h=1) of the sample separated using the color bimodality. The number of "red'' and "blue'' galaxies classified as early (T1&2) and late (T3&4) spectral types are identified. We note that the populations of "red'' and T1&2 as well as the populations of "blue'' and T3&4 galaxies are mostly the same, except for a significant cross-over population which could explain the observed difference in clustering (see text).
The fundamental result of this investigation is to have
clearly established that at least up to
![]() early-type galaxies continue to be more strongly clustered than late-type
galaxies. This extends to higher redshifts earlier results obtained
in the local Universe (Norberg et al. 2002; Loveday Tresse & Maddox 1999; Zehavi et al. 2002,2005),
at redshifts
early-type galaxies continue to be more strongly clustered than late-type
galaxies. This extends to higher redshifts earlier results obtained
in the local Universe (Norberg et al. 2002; Loveday Tresse & Maddox 1999; Zehavi et al. 2002,2005),
at redshifts
![]() (Phleps et al. 2005), and quantitatively
confirms early indications at
(Phleps et al. 2005), and quantitatively
confirms early indications at ![]() (Phleps & Meisenheimer 2003).
(Phleps & Meisenheimer 2003).
Our specific results can be summarized as follows:
To understand the
implications of this observation, we have compared our observed evolution of r0to the predicted evolution of the clustering length for the dark matter in a ![]() cosmology (using the expected evolution of the variance as described in
Peebles 1980). As shown in Fig. 11, if one assumes that the
early-type population is simply tracing in an unbiased way the growth of clustering in the mass
(as would have been the case if no evolution in number nor in luminosity occurred)
their clustering would increase
by a factor of
cosmology (using the expected evolution of the variance as described in
Peebles 1980). As shown in Fig. 11, if one assumes that the
early-type population is simply tracing in an unbiased way the growth of clustering in the mass
(as would have been the case if no evolution in number nor in luminosity occurred)
their clustering would increase
by a factor of
![]() ,
which is close to what
we see in Fig. 11.
This result is in agreement with the observation of a marginal
clustering evolution of early-type galaxies since
,
which is close to what
we see in Fig. 11.
This result is in agreement with the observation of a marginal
clustering evolution of early-type galaxies since ![]() (Cimatti et al. 2004; Saracco et al. 2004), i.e. with the idea
that the bulk of the spheroid population was already in place at
these early redshifts. If a significant fraction of these
galaxies was assembled and added below
(Cimatti et al. 2004; Saracco et al. 2004), i.e. with the idea
that the bulk of the spheroid population was already in place at
these early redshifts. If a significant fraction of these
galaxies was assembled and added below ![]() ,
we would observe
not only an increase in their number density, but also a weakening of
their clustering signal with respect to the underlying mass: it is
natural to think that, forming
typically in lower density peaks than their high-redshift companions
they would in fact be less massive and less clustered.
,
we would observe
not only an increase in their number density, but also a weakening of
their clustering signal with respect to the underlying mass: it is
natural to think that, forming
typically in lower density peaks than their high-redshift companions
they would in fact be less massive and less clustered.
The lower clustering level observed for early-type galaxies at
z<0.7, is best interpreted as a luminosity effect,
given the faint typical luminosity of galaxies in the first bins
(e.g.
![]() at
z=[0.2,0.5]).
at
z=[0.2,0.5]).
![\begin{figure}
\par\includegraphics[width=7.5cm,clip]{4571fg11.ps}
\end{figure}](/articles/aa/full/2006/23/aa4571-05/img182.gif) |
Figure 11:
Clustering length evolution for early ( left panel)
and late ( right panel) spectral type galaxies.
Measurements from the VVDS at high redshifts (open symbols) are
compared to the local measurements obtained for galaxies in the
same absolute luminosity ranges in the 2dFGRS (filled symbols) surveys
(Norberg et al. 2002), with an evolution correction of 0.5 mag for early types
and 1 magnitude for late types at |
| Open with DEXTER | |
Table 5: Measurements of the clustering length and slope for galaxy subsamples divided following the color bimodality.
The trend observed for blue star-forming galaxies of similar luminosities
is also very interesting.
Below redshift ![]() ,
their clustering
is observed to be weak and continuously decreasing from high
redshift to the present. As shown in the two right-top panels of
Fig. 11, however, this is consistent with simple
gravitational growth: the clustering amplitude measured at
,
their clustering
is observed to be weak and continuously decreasing from high
redshift to the present. As shown in the two right-top panels of
Fig. 11, however, this is consistent with simple
gravitational growth: the clustering amplitude measured at ![]() for these galaxies is coherent with the evolution of the same
structure traced by the same galaxies at
for these galaxies is coherent with the evolution of the same
structure traced by the same galaxies at ![]() .
The point at z=1.4 may indicate that star formation activity at z>1
is found in progressively more strongly clustered galaxies than at present,
i.e. plausibly in more massive galaxies in higher density peaks.
In our sample, galaxies at z=[1.2,2] have
a mean
MB(AB)=-20.5 and a clustering length
r0=3.5 h-1 Mpc. Taking into account 1.5 mag of
B-band brightening (Zucca et al. 2005) these galaxies would have today
MB(AB)=-19. Late-type galaxies with similar luminosities in the
Stromlo-APM, 2dFGRS or SDSS have
.
The point at z=1.4 may indicate that star formation activity at z>1
is found in progressively more strongly clustered galaxies than at present,
i.e. plausibly in more massive galaxies in higher density peaks.
In our sample, galaxies at z=[1.2,2] have
a mean
MB(AB)=-20.5 and a clustering length
r0=3.5 h-1 Mpc. Taking into account 1.5 mag of
B-band brightening (Zucca et al. 2005) these galaxies would have today
MB(AB)=-19. Late-type galaxies with similar luminosities in the
Stromlo-APM, 2dFGRS or SDSS have
![]() h-1 Mpc
(Norberg et al. 2002; Loveday Tresse & Maddox 1999; Zehavi et al. 2002). The clustering amplitude of
late-type star-forming galaxies with comparable luminosities, therefore
remains roughly constant since
h-1 Mpc
(Norberg et al. 2002; Loveday Tresse & Maddox 1999; Zehavi et al. 2002). The clustering amplitude of
late-type star-forming galaxies with comparable luminosities, therefore
remains roughly constant since ![]() (Fig. 11).
A straightforward explanation to produce the observed result is that as
redshifts get smaller, star formation is shifting to
smaller-mass, less clustered galaxies.
(Fig. 11).
A straightforward explanation to produce the observed result is that as
redshifts get smaller, star formation is shifting to
smaller-mass, less clustered galaxies.
It is difficult to compare correlation properties of samples with different
mean/median magnitudes because of the well known dependence of clustering
on luminosity (Guzzo et al. 1997; Pollo et al. 2006; Budavàri et al. 2003; Zehavi et al. 2002). Nevertheless, we can note that
comparing our values with other
clustering measurements for type- or color-selected galaxies at
redshifts beyond 1.5, we find for example that star-forming LBGs
at ![]() (Adelberger et al. 2004) are even more clustered
(
(Adelberger et al. 2004) are even more clustered
(
![]() h-1 Mpc) than our star-forming galaxies at
h-1 Mpc) than our star-forming galaxies at ![]() .
This is consistent with the VVDS results at lower redshifts.
One can speculate that star formation is moving to higher and
higher density environments, when moving back in time.
Similarly, red selected samples of EROs
at
.
This is consistent with the VVDS results at lower redshifts.
One can speculate that star formation is moving to higher and
higher density environments, when moving back in time.
Similarly, red selected samples of EROs
at ![]() or red K-selected
galaxies with
or red K-selected
galaxies with
![]() are significantly more clustered than the early type
galaxies at
are significantly more clustered than the early type
galaxies at ![]() in the VVDS with
r0 up to 8 h-1 Mpc (Daddi et al. 2003,2002). These
galaxies seem to be populating even more
extreme density peaks than those we have
been studying here at
in the VVDS with
r0 up to 8 h-1 Mpc (Daddi et al. 2003,2002). These
galaxies seem to be populating even more
extreme density peaks than those we have
been studying here at ![]() .
.
Acknowledgements
We thank the referee, Richard Kron, for very useful comments.
This research program has been developed within the framework of the VVDS consortium.
This work has been partially supported by the CNRS-INSU and its Programme National de Cosmologie (France), and by Italian Ministry (MIUR) grants COFIN2000 (MM02037133) and COFIN2003 (No. 2003020150).
The VLT-VIMOS observations have been carried out on guaranteed time (GTO) allocated by the European Southern Observatory (ESO) to the VIRMOS consortium, under a contractual agreement between the Centre National de la Recherche Scientifique of France, heading a consortium of French and Italian institutes, and ESO, to design, manufacture and test the VIMOS instrument.
![\begin{displaymath}w_{\rm p}(r_{\rm p}) \equiv 2 \int_0^\infty \xi(r_{\rm p},\pi...
...y \xi\left[\left(r_{\rm p}^2+y^2\right)^{1/2}\right] {\rm d}y.
\end{displaymath}](/articles/aa/full/2006/23/aa4571-05/img49.gif)