A&A 452, 245-252 (2006)
DOI: 10.1051/0004-6361:20054706
A. Natta - L. Testi - S. Randich
Osservatorio Astrofisico di Arcetri, INAF, Largo E. Fermi 5, 50125 Firenze, Italy
Received 16 December 2005 / Accepted 20 February 2006
Abstract
Aims. The aim of this paper is to provide a measurement of the mass accretion rate in a large, complete sample of objects in the core of the star forming region ![]() Oph.
Oph.
Methods. The sample includes most of the objects (104 out of 111) with evidence of a circumstellar disk from mid-infrared photometry; it covers a stellar mass range from about 0.03 to 3 ![]() and it is complete to a limiting mass of
and it is complete to a limiting mass of ![]() 0.05
0.05 ![]() .
We used J and K-band spectra to derive the mass accretion rate of each object from the intensity of the hydrogen recombination lines, Pa
.
We used J and K-band spectra to derive the mass accretion rate of each object from the intensity of the hydrogen recombination lines, Pa![]() or Br
or Br![]() .
For comparison, we also obtained similar spectra of 35 diskless objects.
.
For comparison, we also obtained similar spectra of 35 diskless objects.
Results. The results show that emission in these lines is only seen in stars with disks, and can be used as an indicator of accretion. However, the converse does not hold, as about 50% of our disk objects do not have detectable line emission. The measured accretion rates show a strong correlation with the mass of the central object (
![]()
![]() )
and a large spread, of two orders of magnitude at least, for any interval of
)
and a large spread, of two orders of magnitude at least, for any interval of ![]() .
A comparison with existing data for Taurus shows that the objects in the two regions have similar behaviour, at least for objects more massive than
.
A comparison with existing data for Taurus shows that the objects in the two regions have similar behaviour, at least for objects more massive than ![]() 0.1
0.1 ![]() .
The implications of these results are briefly discussed.
.
The implications of these results are briefly discussed.
Key words: stars: formation - accretion, accretion disks - stars: activity
Even if accretion disks have been part of the accepted paradigm of star
formation
for many years, many of their physical properties are
poorly known, and the physical
mechanism of angular momentum transfer, which determines the disk
evolution, is still unclear.
The physical quantity
that controls the accretion phase is the mass accretion rate
through the disk
![]() .
This quantity can be derived only indirectly, by
fitting models to observed quantities such as the UV excess emission
and/or the profiles and intensity of lines
believed to form in the accreting gas. Measurements of
.
This quantity can be derived only indirectly, by
fitting models to observed quantities such as the UV excess emission
and/or the profiles and intensity of lines
believed to form in the accreting gas. Measurements of
![]() are now available
for a large number of stars in Taurus
(e.g., Muzerolle et al. 2005, and references therein).
The results have shown that
are now available
for a large number of stars in Taurus
(e.g., Muzerolle et al. 2005, and references therein).
The results have shown that
![]() is a
strong function of the mass of the central object, roughly
is a
strong function of the mass of the central object, roughly
![]() ,
and that a
large dispersion is present (about two orders of magnitude)
for objects with the same
,
and that a
large dispersion is present (about two orders of magnitude)
for objects with the same ![]() .
Both results are a challenge for
accretion disk models, as discussed, e.g., by Muzerolle et al. (2003)
and Natta et al. (2004).
.
Both results are a challenge for
accretion disk models, as discussed, e.g., by Muzerolle et al. (2003)
and Natta et al. (2004).
Measurements of accretion rates in other star forming regions
are scarce in comparison, mostly limited to very low mass objects
(Muzerolle et al. 2003, 2005).
In a study of very low mass objects and brown dwarfs in
Ophiuchus,
Natta et al. (2004)
found that they are actively accreting
with
![]() higher by at least one order of magnitude
than objects of similar mass in Taurus. This could be due
to a difference in age, since the Ophiuchus BDs
are very young objects, younger than their Taurus counterparts,
but could also be due to different environmental
conditions.
higher by at least one order of magnitude
than objects of similar mass in Taurus. This could be due
to a difference in age, since the Ophiuchus BDs
are very young objects, younger than their Taurus counterparts,
but could also be due to different environmental
conditions.
While it is clearly necessary to improve the physical models of accretion disks, at the same time it is important to study large and if possible complete samples of stars in a variety of star forming regions, differing in age and global properties.
We report in this paper the results of a project
aimed at measuring
the mass accretion rate of a large sample of pre-main
sequence objects, ranging from a few solar masses
to few tens of Jupiter masses,
in the star forming region ![]() Oph.
The core of
Oph.
The core of
![]() Oph is perfectly suited for such a study, as
it is rich in pre-main sequence stars,
which include intermediate mass objects, T Tauri stars (TTS)
and brown dwarfs (BDs). Its
stellar content has been studied, e.g., by
Luhman & Rieke (1999, LR99 in the following, and references
therein to previous work), Natta et al. (2002)
and, more recently,
by Wilking et al. (2005).
Moreover,
Oph is perfectly suited for such a study, as
it is rich in pre-main sequence stars,
which include intermediate mass objects, T Tauri stars (TTS)
and brown dwarfs (BDs). Its
stellar content has been studied, e.g., by
Luhman & Rieke (1999, LR99 in the following, and references
therein to previous work), Natta et al. (2002)
and, more recently,
by Wilking et al. (2005).
Moreover, ![]() Oph is very different from Taurus,
younger
and more compact, and it will allow us to explore
the accretion properties of pre-main sequence stars under different conditions,
following the results of Natta et al. (2004).
Oph is very different from Taurus,
younger
and more compact, and it will allow us to explore
the accretion properties of pre-main sequence stars under different conditions,
following the results of Natta et al. (2004).
Ophiuchus
has been observed in two mid-IR bands with ISO by
Bontemps et al. (2001, BKA01 in the following),
who detected 199 sources in the ![]() Oph core.
Of these, 111 were classified, on the basis of their IR colors, as Class II
objects, i.e., visible young stellar objects with evidence of disks.
They provide a sample of systems with disks complete
to a limiting mass of about 0.05
Oph core.
Of these, 111 were classified, on the basis of their IR colors, as Class II
objects, i.e., visible young stellar objects with evidence of disks.
They provide a sample of systems with disks complete
to a limiting mass of about 0.05 ![]() .
In a spectroscopic study of the very low luminosity
objects of the BKA01 sample,
Natta et al. (2002)
confirmed that they were BDs with mid-IR excess, very likely from
a circumstellar disk; as mentioned, these BDs
show significant differences in accretion properties
from their analogs in Taurus.
.
In a spectroscopic study of the very low luminosity
objects of the BKA01 sample,
Natta et al. (2002)
confirmed that they were BDs with mid-IR excess, very likely from
a circumstellar disk; as mentioned, these BDs
show significant differences in accretion properties
from their analogs in Taurus.
The disadvantage of observing ![]() Oph is its high extinction, which makes
veiling measurements in the UV and visual impossible except for a few objects.
The most effective way to determine
Oph is its high extinction, which makes
veiling measurements in the UV and visual impossible except for a few objects.
The most effective way to determine
![]() for the Ophiuchus sample
is therefore
to use the luminosity of
hydrogen recombination lines, such as Pa
for the Ophiuchus sample
is therefore
to use the luminosity of
hydrogen recombination lines, such as Pa![]() and/or Br
and/or Br![]() .
The relation between IR line luminosity and accretion luminosity,
independently measured from the UV excess, was established by
Muzerolle et al. (1998b) for TTS, and by Calvet et al. (2004)
for intermediate mass objects. Natta et al. (2004)
extended it to very low mass objects, where
.
The relation between IR line luminosity and accretion luminosity,
independently measured from the UV excess, was established by
Muzerolle et al. (1998b) for TTS, and by Calvet et al. (2004)
for intermediate mass objects. Natta et al. (2004)
extended it to very low mass objects, where
![]() was determined by
fitting the observed H
was determined by
fitting the observed H![]() profiles with the predictions of magnetospheric
accretion models.
profiles with the predictions of magnetospheric
accretion models.
In this paper, we present the results of a spectroscopic IR survey of Ophiuchus objects. In Sect. 2, we describe the properties of the observed sample, which includes almost all (104 out of 111) the Class II objects and a subset (35 objects out of 77) of the diskless systems (Class III), also from the BKA01 survey, that we will use for comparison. The observations, data reduction and method of analysis are discussed in Sect. 3. The results are presented in Sect. 4 and discussed in Sect. 5. Section 6 summarizes our conclusions.
The most complete survey of young stellar objects in the ![]() Oph Main
Cloud (L 1688) is that obtained in two mid-IR bands (6.7 and 15.3
Oph Main
Cloud (L 1688) is that obtained in two mid-IR bands (6.7 and 15.3 ![]() m)
with ISOCAM (BAK01). Based on the near and mid-IR colors, the
objects were divided in Class I (accreting protostars), Class II
and tentative Class II
(pre-main sequence stars with IR excess typical of disks, like
classical T Tauri stars or CTTS), and Class III/tentative Class III (objects with colors
typical of stellar photospheres, like weak-line T Tauri stars or WTTS).
BAK01 estimate that their Class II
sample of 111 objects
is complete to a limiting luminosity
m)
with ISOCAM (BAK01). Based on the near and mid-IR colors, the
objects were divided in Class I (accreting protostars), Class II
and tentative Class II
(pre-main sequence stars with IR excess typical of disks, like
classical T Tauri stars or CTTS), and Class III/tentative Class III (objects with colors
typical of stellar photospheres, like weak-line T Tauri stars or WTTS).
BAK01 estimate that their Class II
sample of 111 objects
is complete to a limiting luminosity ![]()
![]() 0.03
0.03 ![]() ,
corresponding
approximately to 0.05
,
corresponding
approximately to 0.05 ![]() .
The Class III sample is
only complete to
.
The Class III sample is
only complete to ![]() 0.2
0.2 ![]() (about 0.15
(about 0.15 ![]() ).
Note that not all the Class III objects have been
confirmed as
).
Note that not all the Class III objects have been
confirmed as ![]() Oph members.
Barsony et al. (2005) have recently confirmed the
accuracy of the ISOCAM results with ground-based 10
Oph members.
Barsony et al. (2005) have recently confirmed the
accuracy of the ISOCAM results with ground-based 10 ![]() m
observations of a large subset of the BKA01 sources.
m
observations of a large subset of the BKA01 sources.
Our sample includes 104 of the 111 Class II/tentative Class II objects
(Class II for simplicity in the following) listed by BAK01 in the ![]() Oph core.
Most of the spectra (96) were obtained in the J band; the remaining 8, of objects too weak in J, in the K band; one object has been
observed at both wavelengths.
As a comparison sample, we observed 35
of the 77 Class III and tentative Class III
(in the following, Class III)
objects, 31 in the J band and 4 in K.
The objects and their properties are listed in
Tables C.1 and C.2.
Oph core.
Most of the spectra (96) were obtained in the J band; the remaining 8, of objects too weak in J, in the K band; one object has been
observed at both wavelengths.
As a comparison sample, we observed 35
of the 77 Class III and tentative Class III
(in the following, Class III)
objects, 31 in the J band and 4 in K.
The objects and their properties are listed in
Tables C.1 and C.2.
The stellar properties (i.e., spectral type, luminosity, mass and radius) of the BAK01 sample are well known only for a handful of objects. The main difficulty comes from the large uncertainties that affect spectral types, due to the combination of high extinction and large veiling, even at near-IR wavelengths (e.g., LR99 and references therein; Doppman et al. 2003; Wilking et al. 2005). LR99, using K-band low resolution spectra, provide spectral types for 37 of our Class II objects. However, 23 of them have uncertainties of almost one spectral class.
Given the uncertainties, and considering that most of our objects do not have any spectral classification, we have decided to adopt a statistical approach, following BAK01.
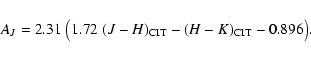
First, we compute the extinction toward each object from the
observed
(J-H)-(H-K) colors, as given by 2MASS![]() , corrected to CIT system,
adopting the Ophiuchus extinction law of Kenyon et al. (1998)
and the locus of CTTS defined by Meyer et al. (1997).
The result can be expressed as:
, corrected to CIT system,
adopting the Ophiuchus extinction law of Kenyon et al. (1998)
and the locus of CTTS defined by Meyer et al. (1997).
The result can be expressed as:
 |
(1) |
The stellar luminosity is computed from the J magnitude and AJ,
using a bolometric correction similar to that adopted by BAK01:
| (2) |
When only H and K magnitudes were available (17 Class II and 1 Class III objects), we estimated the stellar luminosity using Eqs. (2) and (4) of BKA01.
There are 5 objects (4 Class II and 1 Class III)
that have companions clearly seen in our spectra, but
which are not resolved in the 2MASS
photometry. All the companions
have a good detection of the continuum; the
flux ratio between the primary and the secondary
is always larger than a factor of 3.
Two of the companions (![]() Oph-ISO 068b and
Oph-ISO 068b and ![]() Oph-ISO 072b)
have been detected in the K-band
Oph-ISO 072b)
have been detected in the K-band ![]() Oph multiplicity survey
of Ratzka et al. (2005), with flux ratios to the
primary of 0.19 and 0.16, respectively. We have
accordingly
not corrected the 2MASS magnitudes of the
primaries for the contribution of the companions, because
the corrections to the derived parameters
would have been within the uncertainties.
The secondary components have no detectable Pa
Oph multiplicity survey
of Ratzka et al. (2005), with flux ratios to the
primary of 0.19 and 0.16, respectively. We have
accordingly
not corrected the 2MASS magnitudes of the
primaries for the contribution of the companions, because
the corrections to the derived parameters
would have been within the uncertainties.
The secondary components have no detectable Pa![]() emission, and we will
omit them from our analysis in the following; their properties
are summarized in Table C.3.
emission, and we will
omit them from our analysis in the following; their properties
are summarized in Table C.3.
To determine stellar radii and masses, we make the assumption
that the star formation in Ophiuchus is coeval, and that all the objects
lie on a single isochrone in the HR diagram.
With this assumption, we can derive stellar mass, temperature and radius
from the measured ![]() .
This procedure is reasonable for the Ophiuchus core,
whose age estimates range
between 0.5 and 1 Myr, with very few
stars older than that (BAK01; LR99).
In the following, we adopt the D'Antona
& Mazzitelli (1997 and 1998 web updates; DM98 in the following) evolutionary tracks for an age of 0.5 My.
The uncertainties introduced by the assumption of coeval star formation
and the differences expected if other evolutionary tracks were
used are
discussed in Appendix A.
.
This procedure is reasonable for the Ophiuchus core,
whose age estimates range
between 0.5 and 1 Myr, with very few
stars older than that (BAK01; LR99).
In the following, we adopt the D'Antona
& Mazzitelli (1997 and 1998 web updates; DM98 in the following) evolutionary tracks for an age of 0.5 My.
The uncertainties introduced by the assumption of coeval star formation
and the differences expected if other evolutionary tracks were
used are
discussed in Appendix A.
The values of the stellar parameters are given in Tables C.1 and C.2.
Near infrared moderate resolution J and K band spectroscopic observations
of all targets in our sample were obtained at the ESO Observatories in
Chile. The objects were either observed using the SofI instrument at the
NTT 2.2 m telescope (June 2004, Visitor Mode) or the ISAAC instrument
at the Antu 8.2 m VLT unit telescope (Spring 2004, Service Mode),
as specified in Tables C.1 and C.2.
Detailed descriptions of both these instruments are available on the
ESO web pages![]() . For all the objects that were
observable at J-band, with SofI we used the 0.6 arcsec slit
and the Blue low resolution grims, resulting in a spectral resolution of
approximately
. For all the objects that were
observable at J-band, with SofI we used the 0.6 arcsec slit
and the Blue low resolution grims, resulting in a spectral resolution of
approximately
![]() and a spectral coverage from
and a spectral coverage from
![]() 0.95 to
0.95 to
![]() m; with ISAAC we employed the short-wavelength
low resolution spectral mode with central wavelength
m; with ISAAC we employed the short-wavelength
low resolution spectral mode with central wavelength ![]() m and
m and
![]() slit width, giving a spectral resolution of
slit width, giving a spectral resolution of
![]() and a spectral coverage limited to the J-band.
A number of objects were only observable at K-band, for these we either used
the SofI Red low resolution grism with similar spectral resolution as for the
Blue grism observations and spectral coverage from
and a spectral coverage limited to the J-band.
A number of objects were only observable at K-band, for these we either used
the SofI Red low resolution grism with similar spectral resolution as for the
Blue grism observations and spectral coverage from ![]() 1.6 to
1.6 to ![]() m,
or the ISAAC short wavelength low resolution mode with central wavelength
m,
or the ISAAC short wavelength low resolution mode with central wavelength
![]() m, which offers a similar spectral resolution as the J-band
observations and a spectral coverage limited to the K-band. Integration
times varied from about 0.5 to 2 h on source,
depending on the expected brightness of the objects
and observing conditions (in Visitor Mode).
m, which offers a similar spectral resolution as the J-band
observations and a spectral coverage limited to the K-band. Integration
times varied from about 0.5 to 2 h on source,
depending on the expected brightness of the objects
and observing conditions (in Visitor Mode).
During the Visitor Mode observations at the NTT telescope, we acquired several telluric standard stars per night at varying airmasses; each Observing Block from our programme executed in Service Mode at the VLT was preceded or followed by a telluric standard observed with the same instrument mode and at a similar airmass as our target stars. Spectroscopic flat fields and arcs were obtained during daytime either before or after our observations. Standard methods were employed to calibrate our data. We did not attempt to obtain flux calibrated spectra; all our spectra are wavelength calibrated using OH airglow lines and corrected on an arbitrary intensity scale for telluric absorption and instrument response using the telluric standard star observations.
Correction for telluric absorption and instrumental response was
obtained observing at similar airmasses
early type stars (early B or O) of known spectral
type from the telluric standards lists of ISAAC![]() .
These stars all have Pa
.
These stars all have Pa![]() or Br
or Br![]() absorption which were
manually removed from the spectra before applying the correction.
absorption which were
manually removed from the spectra before applying the correction.
Most of the spectra are of excellent quality; the detection limits of the
Pa![]() or Br
or Br![]() equivalent width are in general of
the order of 0.5-1 Å. Variations
around this limit are mainly related to the signal to noise ratio achieved on
the photospheric continuum of the individual objects.
The signal to noise ratio depends on the telescope/instrument used,
the observing conditions, the
integration time and the apparent magnitude of the object.
It is not necessarily a function
of the object intrinsic luminosity because the extinction can be very different
and because we tried as much as possible to observe
two objects at the same time
by properly aligning the slit, so that some relatively bright source
near a faint one
may have been observed with ISAAC and a long integration time.
However, most of the lower luminosity objects have been
observed with ISAAC
and, expecting lower line intensities, with a higher signal to noise ratio;
thus, the line detection limits for low luminosity objects are
generally lower than for intermediate luminosity ones.
equivalent width are in general of
the order of 0.5-1 Å. Variations
around this limit are mainly related to the signal to noise ratio achieved on
the photospheric continuum of the individual objects.
The signal to noise ratio depends on the telescope/instrument used,
the observing conditions, the
integration time and the apparent magnitude of the object.
It is not necessarily a function
of the object intrinsic luminosity because the extinction can be very different
and because we tried as much as possible to observe
two objects at the same time
by properly aligning the slit, so that some relatively bright source
near a faint one
may have been observed with ISAAC and a long integration time.
However, most of the lower luminosity objects have been
observed with ISAAC
and, expecting lower line intensities, with a higher signal to noise ratio;
thus, the line detection limits for low luminosity objects are
generally lower than for intermediate luminosity ones.
The sample studied in this paper includes also the 9 BKA01 sources for which Natta et al. (2004) obtained J and K band spectra with ISAAC. We have taken the Natta et al. (2004) J band spectra and reanalyzed them in the same manner used for the others.
The luminosity of Pa![]() and Br
and Br![]() are computed from the measured
equivalent widths of the emission lines
and the broad-band J and K fluxes, corrected
for extinction, determined as described in Sect. 2.2.
No correction for underlying photospheric absorption was applied,
since the expected equivalent width is small (
are computed from the measured
equivalent widths of the emission lines
and the broad-band J and K fluxes, corrected
for extinction, determined as described in Sect. 2.2.
No correction for underlying photospheric absorption was applied,
since the expected equivalent width is small (
![]() 0.5 Å; Wallace et al. 2000)
for objects with
0.5 Å; Wallace et al. 2000)
for objects with
![]()
![]() 5000 K,
which represent the quasi-totality of our sample (see
Table C.1)
and would not change the results.
5000 K,
which represent the quasi-totality of our sample (see
Table C.1)
and would not change the results.
There are 12 Class II (11 of them have no
Pa![]() detection) for which it was not possible to determine
line fluxes, due to lack of J magnitudes;
they will not be
included in the following discussion. Similarly, we will not
consider further the one Class II (
detection) for which it was not possible to determine
line fluxes, due to lack of J magnitudes;
they will not be
included in the following discussion. Similarly, we will not
consider further the one Class II (![]() Oph-ISO 035) with
weak Pa
Oph-ISO 035) with
weak Pa![]() in absorption.
in absorption.
The accretion luminosity of each Class II object is
derived from
the empirical correlation between
![]() and the luminosity of Pa
and the luminosity of Pa![]() or
Br
or
Br![]() ,
derived by Natta et al. (2004)
and Calvet et al. (2004), respectively (see also Muzerolle et al. 1998b):
,
derived by Natta et al. (2004)
and Calvet et al. (2004), respectively (see also Muzerolle et al. 1998b):
| |
= | (3) | |
| = | (4) |
The reliabilty of our procedure was
verified by applying it to a sample of well studied pre-main
sequence stars, covering roughly the same range of masses, for
which reliable values of the stellar parameters (i.e.,
mass and radius) and of the accretion rate
could be found in the literature. Using literature measurements
of the Pa![]() intensity and of
intensity and of ![]() ,
we derived for each object mass and accretion rate
as done for the Ophiuchus objects, and
compared them to the "real'' values. Details
can be found in the Appendix B.
,
we derived for each object mass and accretion rate
as done for the Ophiuchus objects, and
compared them to the "real'' values. Details
can be found in the Appendix B.
We have applied a similar procedure to the Class III objects; the
results are shown in Table C.2.
![\begin{figure}
\par\includegraphics[width=8.4cm,clip]{4706fig1.ps}\end{figure}](/articles/aa/full/2006/22/aa4706-05/img38.gif) |
Figure 1:
Equivalent width of the Pa |
| Open with DEXTER | |
Emission in the near-IR hydrogen recombination lines has been
detected in 45% of Class II sources,
46 of the 96 observed in Pa![]() and 1 out of 9 observed in
Br
and 1 out of 9 observed in
Br![]() .
In contrast, no Class III source shows emission in these hydrogen lines;
8 Class III objects have Pa
.
In contrast, no Class III source shows emission in these hydrogen lines;
8 Class III objects have Pa![]() or Br
or Br![]() in absorption and for the others we
do not see the lines.
The measured equivalent widths are given in
Tables C.1 and C.2.
Figure 1 shows the Pa
in absorption and for the others we
do not see the lines.
The measured equivalent widths are given in
Tables C.1 and C.2.
Figure 1 shows the Pa![]() equivalent width
as function of
equivalent width
as function of ![]() .
.
Six Class III objects have Pa![]() in absorption with equivalent widths
in absorption with equivalent widths
![]() 1 Å, i.e., larger than one can expect in late-type stars
(Wallace et al. 2000). They are likely earlier type stars, and
this is certainly the case of
1 Å, i.e., larger than one can expect in late-type stars
(Wallace et al. 2000). They are likely earlier type stars, and
this is certainly the case of ![]() Oph-ISO 180,
which is classified A7 by Wilking et al. (2005) and of
Oph-ISO 180,
which is classified A7 by Wilking et al. (2005) and of ![]() Oph-ISO 113,
earlier than F8 according to LR99.
For these six stars, as already mentioned, the method used to estimate
AJ and all the derived stellar parameters is not correct; therefore, we
omit their stellar parameters from Table C.2.
Oph-ISO 113,
earlier than F8 according to LR99.
For these six stars, as already mentioned, the method used to estimate
AJ and all the derived stellar parameters is not correct; therefore, we
omit their stellar parameters from Table C.2.
The comparison between the Class II and Class III samples
clearly shows that
emission in the near-IR hydrogen lines, in contrast
to that in optical lines such as H![]() is restricted to objects with circumstellar disks, and
can therefore be used as a reliable accretion indicator.
However, one should keep in mind that the opposite is not
necessarily true, as about 50% objects with disks have no detected
emission.
is restricted to objects with circumstellar disks, and
can therefore be used as a reliable accretion indicator.
However, one should keep in mind that the opposite is not
necessarily true, as about 50% objects with disks have no detected
emission.
The fraction of Class II objects with detected Pa![]() emission
varies from 56% for
emission
varies from 56% for ![]()
![]() 1
1 ![]() to 42% for
to 42% for
![]()
![]() .
Very low luminosity objects (7 objects with
.
Very low luminosity objects (7 objects with ![]()
![]() 0.03
0.03 ![]() )
have a marginally higher detection rate
(
)
have a marginally higher detection rate
(![]() 57%),
due in part to the sensitivity limit of
our measurements, which is higher for lower luminosity objects
(see Sect. 3.1),
but also due to the
incompleteness of the BKA01 survey for
very low luminosity sources, which are detected
only when they have a large mid-IR excess, very likely
indicative of higher accretion rates.
57%),
due in part to the sensitivity limit of
our measurements, which is higher for lower luminosity objects
(see Sect. 3.1),
but also due to the
incompleteness of the BKA01 survey for
very low luminosity sources, which are detected
only when they have a large mid-IR excess, very likely
indicative of higher accretion rates.
Figure 2 shows the accretion luminosity of Class II
objects computed from the
IR line luminosity as a function of ![]() .
.
For any given ![]() ,
there is a large range of measured
,
there is a large range of measured
![]() (about 50), which does not seem to vary significantly with
(about 50), which does not seem to vary significantly with
![]() ;
because of our sensitivity limit, this is probably just a lower
limit to the actual range of
;
because of our sensitivity limit, this is probably just a lower
limit to the actual range of
![]() .
One can also see that for the
majority of objects
.
One can also see that for the
majority of objects
![]() /
/![]() < 0.1, but there is a significant fraction of
cases with
< 0.1, but there is a significant fraction of
cases with
![]()
![]()
![]() .
.
Figure 3 shows the mass accretion rate
![]() of Class II sources
as function of
of Class II sources
as function of ![]() .
There is a clear trend of increasing
.
There is a clear trend of increasing
![]() with increasing
with increasing ![]() .
Not including upper limits,
we find using ASURV (Feigelson and Nelson 1985)
.
Not including upper limits,
we find using ASURV (Feigelson and Nelson 1985)
![]()
![]()
![]()
![]() ;
the slope does not change
if we include the upper limits in the analysis.
;
the slope does not change
if we include the upper limits in the analysis.
Superimposed on this trend, there is a large spread of
![]() for any value of
for any value of ![]() ,
of two orders of magnitude at least.
Within statistical fluctuations, the objects are distributed quite
uniformly in this range.
,
of two orders of magnitude at least.
Within statistical fluctuations, the objects are distributed quite
uniformly in this range.
![\begin{figure}
\par\includegraphics[width=8.4cm,clip]{4706fig2.ps}\end{figure}](/articles/aa/full/2006/22/aa4706-05/img42.gif) |
Figure 2:
Accretion luminosity from the IR lines as function of |
| Open with DEXTER | |
![\begin{figure}
\par\includegraphics[width=8.4cm,clip]{4706fig3.ps}\end{figure}](/articles/aa/full/2006/22/aa4706-05/img43.gif) |
Figure 3:
Mass accretion rate derived from the IR lines as function
of |
| Open with DEXTER | |
The results summarized in Fig. 3
describe the accretion properties of the largest sample of
Class II stars in any single star-forming region
studied so far. The sample contains more than hundred
objects with evidence of disks, and is complete in the mass interval
from ![]() 0.03 to about 3
0.03 to about 3 ![]() .
The corresponding
accretion rates vary from
.
The corresponding
accretion rates vary from
![]() to
to
![]()
![]() /yr,
with a strong dependence of
/yr,
with a strong dependence of
![]() on
on ![]() (
(
![]()
![]()
![]() ). For any
). For any ![]() ,
there is a large dispersion
of values of
,
there is a large dispersion
of values of
![]() ,
of two orders of magnitude at least, which does
not seem to change with
,
of two orders of magnitude at least, which does
not seem to change with ![]() .
Note that the real spread
is likely bigger,
because of the many upper limits in our survey.
.
Note that the real spread
is likely bigger,
because of the many upper limits in our survey.
One of the aims of our study was to compare the accretion properties
in Ophiuchus with those of objects in Taurus.
The Taurus results are shown by crosses in Figs. 2
and 3.
The accretion luminosity
and mass accretion rate have been derived
from the UV and optical
veiling and/or
by fitting with magnetospheric accretion models
the H![]() profile. This second method is
the only possible one for very low mass objects and BDs,
since veiling cannot be detected below a limiting value
profile. This second method is
the only possible one for very low mass objects and BDs,
since veiling cannot be detected below a limiting value
![]()
![]() 10-10
10-10 ![]() /yr. The results are from
Gullbring et al. (1998),
Muzerolle et al. (1998b, 2003, 2005),
White & Ghez (2001), White & Basri (2003),
and Calvet et al. (2004);
note that, for homogeneity, we have re-determined
/yr. The results are from
Gullbring et al. (1998),
Muzerolle et al. (1998b, 2003, 2005),
White & Ghez (2001), White & Basri (2003),
and Calvet et al. (2004);
note that, for homogeneity, we have re-determined ![]() using DM98 tracks
for all objects.
using DM98 tracks
for all objects.
The methods used to derive
![]() and
and
![]() in the two regions
are therefore different, since
in Ophiuchus
in the two regions
are therefore different, since
in Ophiuchus
![]() is derived from the luminosity
of the hydrogen recombination lines. However,
the relations
(Eqs. (3) and (4)) we used have been "calibrated'' mostly using Taurus
objects (see, e.g., Muzerolle et al. 1998b; Calvet et al. 2004;
Natta et al. 2004), so that we do not expect
any systematic difference in the Ophiuchus-Taurus comparison due to
the different methods.
is derived from the luminosity
of the hydrogen recombination lines. However,
the relations
(Eqs. (3) and (4)) we used have been "calibrated'' mostly using Taurus
objects (see, e.g., Muzerolle et al. 1998b; Calvet et al. 2004;
Natta et al. 2004), so that we do not expect
any systematic difference in the Ophiuchus-Taurus comparison due to
the different methods.
The two figures show that the accretion properties of the
two star forming regions are very similar.
Muzerolle et al. (2005) derive
![]()
![]()
![]() 2.1 for their sample (mostly in Taurus,
with additional brown dwarfs from other star-forming regions),
neglecting upper limits. Within the errors, this relation is
identical to what we obtain in Ophiuchus.
If we concentrate in Fig. 3, we can see that not only
the slope of the relation of
2.1 for their sample (mostly in Taurus,
with additional brown dwarfs from other star-forming regions),
neglecting upper limits. Within the errors, this relation is
identical to what we obtain in Ophiuchus.
If we concentrate in Fig. 3, we can see that not only
the slope of the relation of
![]() with
with ![]() ,
but also
the range of values is very similar.
In particular,
the two samples have similar values of the
maximum
,
but also
the range of values is very similar.
In particular,
the two samples have similar values of the
maximum
![]() for any given
for any given ![]() ,
and similar spread of
,
and similar spread of
![]() values,
at least for
values,
at least for ![]()
![]() 0.06-0.08
0.06-0.08 ![]() .
.
For lower ![]() ,
most Taurus BDs have very low accretion rates,
1-2 orders of magnitude lower than similar objects in Ophiuchus.
As already discussed, the fact that we do not find these very low accretors in Ophiuchus
most likely reflects the incompleteness of the BAK01 sample at very
low masses,
and selects
objects with comparatively strong mid-IR fluxes.
Natta et al. (2002) showed that the BAK01 sample of
brown dwarfs has relatively large luminosity, and is probably very
young. As discussed in Sect. 4.1, a
fraction larger than for more luminous objects has detected Pa
,
most Taurus BDs have very low accretion rates,
1-2 orders of magnitude lower than similar objects in Ophiuchus.
As already discussed, the fact that we do not find these very low accretors in Ophiuchus
most likely reflects the incompleteness of the BAK01 sample at very
low masses,
and selects
objects with comparatively strong mid-IR fluxes.
Natta et al. (2002) showed that the BAK01 sample of
brown dwarfs has relatively large luminosity, and is probably very
young. As discussed in Sect. 4.1, a
fraction larger than for more luminous objects has detected Pa![]() .
All this indicates that there may be low
.
All this indicates that there may be low
![]() BDs which are missing
from the Ophiuchus sample.
It is, in a way, more surprising that very few, if any,
of the brown dwarfs in Taurus have high
BDs which are missing
from the Ophiuchus sample.
It is, in a way, more surprising that very few, if any,
of the brown dwarfs in Taurus have high
![]() ,
while higher mass objects in the two regions have very similar
accretion properties.
It is possible that this difference between the two regions at
the very low end of the
,
while higher mass objects in the two regions have very similar
accretion properties.
It is possible that this difference between the two regions at
the very low end of the ![]() distribution contains important
information, that needs further investigation. This is, however,
beyond the scope of this paper.
distribution contains important
information, that needs further investigation. This is, however,
beyond the scope of this paper.
All pre-main sequence stars are variable objects, and, in particular, all the accretion indicators in TTS and BDs show large variability.
Variability does not affect
the correlation
of
![]() with
with ![]() ,
as the
,
as the ![]() Oph sample is sufficiently large that
individual fluctuations cannot change it.
It may be more important when we consider the spread
of
Oph sample is sufficiently large that
individual fluctuations cannot change it.
It may be more important when we consider the spread
of
![]() values for any given
values for any given ![]() .
Recently, Scholz & Jayawardhana (2005) have
studied the variability of accretion indicators (mostly H
.
Recently, Scholz & Jayawardhana (2005) have
studied the variability of accretion indicators (mostly H![]() )
for
six young brown dwarfs; they claim that the accretion rate in some
of their objects varies by at least one order of magnitude, and that
this variability may account for the large spread in the
)
for
six young brown dwarfs; they claim that the accretion rate in some
of their objects varies by at least one order of magnitude, and that
this variability may account for the large spread in the
![]() -
-![]() correlation.
correlation.
We have estimated the magnitude of the spread in
![]() for individual objects by looking at the results of
Gatti et al. (2006), who have recently obtained J-band
spectra of a small (14 objects)
subset of our Ophiuchus sample. The Gatti et al. sample includes
both TTS and BDs, observed one to two years later than
the spectra discussed in this paper. The two data sets
show
variations in the Pa
for individual objects by looking at the results of
Gatti et al. (2006), who have recently obtained J-band
spectra of a small (14 objects)
subset of our Ophiuchus sample. The Gatti et al. sample includes
both TTS and BDs, observed one to two years later than
the spectra discussed in this paper. The two data sets
show
variations in the Pa![]() equivalent width of a factor of two
at most (in both directions),
with only one exception, where the Pa
equivalent width of a factor of two
at most (in both directions),
with only one exception, where the Pa![]() equivalent width
has increased by a factor of three over the
time interval between the
two sets of observations. For the same
objects, we have also looked in the literature for
variations of the
broad-band J magnitude, used to compute
the line flux (Sect. 3.2).
The variation of
equivalent width
has increased by a factor of three over the
time interval between the
two sets of observations. For the same
objects, we have also looked in the literature for
variations of the
broad-band J magnitude, used to compute
the line flux (Sect. 3.2).
The variation of
![]() ,
computed taking the maximum variations in the J magnitude and in the Pa
,
computed taking the maximum variations in the J magnitude and in the Pa![]() equivalent width,
is of a factor
equivalent width,
is of a factor ![]() 4. This is much smaller
than the dispersion of points in Fig. 3 and
would not change significantly any of our conclusions.
4. This is much smaller
than the dispersion of points in Fig. 3 and
would not change significantly any of our conclusions.
A detailed analysis of the variability of the IR emission lines and continuum,
in analogy to what has been done for H![]() (e.g., Johns-Krull
& Basri 1997),
is certainly needed. However, from the results obtained so far,
it seems unlikely that the dispersion of
(e.g., Johns-Krull
& Basri 1997),
is certainly needed. However, from the results obtained so far,
it seems unlikely that the dispersion of
![]() values can be accounted
for by variability alone, and that, if averaged over a sufficiently long period
of time, one would find that
all the
values can be accounted
for by variability alone, and that, if averaged over a sufficiently long period
of time, one would find that
all the
![]() Oph stars of a given mass accrete
at the same rate.
Oph stars of a given mass accrete
at the same rate.
The
![]() dependence on
dependence on ![]() is difficult to understand in terms
of disk physics, as discussed, e.g., by Muzerolle et al. (2003),
Natta et al. (2004), Calvet et al. (2004).
In a standard steady accretion disk model,
is difficult to understand in terms
of disk physics, as discussed, e.g., by Muzerolle et al. (2003),
Natta et al. (2004), Calvet et al. (2004).
In a standard steady accretion disk model,
![]() is proportional to the disk mass divided by the time scale for
viscous evolution. In an
is proportional to the disk mass divided by the time scale for
viscous evolution. In an ![]() -disk (Shakura & Sunyaev 1973),
the viscosity depends
on the ratio
-disk (Shakura & Sunyaev 1973),
the viscosity depends
on the ratio
![]() ,
where
,
where ![]() is the keplerian angular velocity
and
is the keplerian angular velocity
and ![]() the sound speed; then,
the sound speed; then,
![]()
![]() ,
where
,
where ![]() and
and ![]() are disk mass and temperature, respectively.
With the further assumptions that
are disk mass and temperature, respectively.
With the further assumptions that
![]() (e.g., Natta et al. 2000),
and that the disk heating is dominated by the stellar irradiation, this
gives, to zero order,
(e.g., Natta et al. 2000),
and that the disk heating is dominated by the stellar irradiation, this
gives, to zero order,
![]()
![]() .
For PMS stars, the relation between
.
For PMS stars, the relation between ![]() and
and ![]() is
rather shallow (approximately
is
rather shallow (approximately
![]() for
for ![]()
![]() 0.1
0.1 ![]() ,
and much flatter for lower masses; see, e.g., DM98)
and we expect
,
and much flatter for lower masses; see, e.g., DM98)
and we expect
![]() to increase
roughly as
to increase
roughly as
![]() ,
with
,
with
![]() .
The relation will be even flatter if the contribution of the stellar radiation
to the disk heating is negligible.
.
The relation will be even flatter if the contribution of the stellar radiation
to the disk heating is negligible.
It is possible that ![]() (or, more generally, the efficiency
of momentum transfer) depends, in turn, on
(or, more generally, the efficiency
of momentum transfer) depends, in turn, on ![]() .
If viscosity is the result of magneto-rotational instabilities (MRI)
(see, e.g., Balbus & Hawley 1991),
the disk gas should be sufficiently ionized.
Muzerolle et al. (2003) suggest that the steep correlation
of
.
If viscosity is the result of magneto-rotational instabilities (MRI)
(see, e.g., Balbus & Hawley 1991),
the disk gas should be sufficiently ionized.
Muzerolle et al. (2003) suggest that the steep correlation
of
![]() with
with ![]() can be explained if
the disk ionization is controlled by the X-ray radiation from the star, since
the X-ray luminosity is not constant over
the mass spectrum, but is
observed to increase with
can be explained if
the disk ionization is controlled by the X-ray radiation from the star, since
the X-ray luminosity is not constant over
the mass spectrum, but is
observed to increase with ![]() .
.
X-ray observations of Ophiuchus have been recently carried out
with Chandra and XMM satellites by Imanishi et al. (2001)
and Ozawa et al. (2005).
Both studies detected a significant fraction of Class II sources
(70 and 48 % respectively); they found that the X-ray spectral
properties, as well as the relationship between ![]() and
and
![]() of class II sources are similar to those of class III
sources, but did not investigate the behaviour of X-ray luminosity
with stellar mass. To our knowledge, the only study addressing the
relation between mass and X-ray luminosity for young stars over a large
range of luminosities and masses is in Orion.
The COUP Chandra observations of
Orion show that
of class II sources are similar to those of class III
sources, but did not investigate the behaviour of X-ray luminosity
with stellar mass. To our knowledge, the only study addressing the
relation between mass and X-ray luminosity for young stars over a large
range of luminosities and masses is in Orion.
The COUP Chandra observations of
Orion show that ![]() scales
approximately as
scales
approximately as ![]() 1.1-1.4in the interval 0.1-2
1.1-1.4in the interval 0.1-2 ![]() (Preibisch et al. 2005).
However, it is not clear that this variation of
(Preibisch et al. 2005).
However, it is not clear that this variation of
![]() is sufficient to produce the observed
is sufficient to produce the observed
![]() -
-![]() correlation,
and more detailed MRI models, which include X-ray ionization,
are required.
If the X-ray emission of the central star is controlling accretion,
the large spread of
correlation,
and more detailed MRI models, which include X-ray ionization,
are required.
If the X-ray emission of the central star is controlling accretion,
the large spread of ![]() observed in the COUP data could also
explain
the large spread of
observed in the COUP data could also
explain
the large spread of
![]() for any given
for any given ![]() .
.
Viscous disk models predict that
![]() decreases with time
(e.g., Hartmann et al. 1998).
Calvet et al. (2000)
estimate
decreases with time
(e.g., Hartmann et al. 1998).
Calvet et al. (2000)
estimate
![]()
![]() ,
with a large uncertainty, from
a sample of TTS in Taurus, Chamaeleon and Ophiuchus.
Neither the similarity of accretion rates between Ophiuchus and Taurus
nor the very large spread observed in both regions
support age as a main factor in the determination of
,
with a large uncertainty, from
a sample of TTS in Taurus, Chamaeleon and Ophiuchus.
Neither the similarity of accretion rates between Ophiuchus and Taurus
nor the very large spread observed in both regions
support age as a main factor in the determination of
![]() .
If the Calvet et al. (2000) rate is correct,
the difference in age between Taurus and Ophiucus should give on average
a difference in
.
If the Calvet et al. (2000) rate is correct,
the difference in age between Taurus and Ophiucus should give on average
a difference in
![]() of a factor
of a factor
![]() 3, of which we have no evidence.
In addition,
the Ophiuchus
3, of which we have no evidence.
In addition,
the Ophiuchus
![]() range of more than two orders of magnitude
corresponds to an age range of at least a factor 20, much too large
when compared to the HR location of the objects (see, e.g., LR99).
range of more than two orders of magnitude
corresponds to an age range of at least a factor 20, much too large
when compared to the HR location of the objects (see, e.g., LR99).
The time evolution of viscous disks
is influenced by the presence of close companions
(see Calvet et al. 2000). Companions
truncate the circumstellar disk at a radius which depends on the
binary separation. As the disk evolves, more and more matter expands outside
the truncation radius, with the effect of decreasing the disk mass and
![]() .
A sample of objects with the same initial value of
.
A sample of objects with the same initial value of
![]() but companions at different distances will show with time an
increasing spread of
but companions at different distances will show with time an
increasing spread of
![]() values.
values.
This effect, however, is not seen in the Taurus TTS
(White & Ghez 2001), where the accretion rate is similar for
single and primary stars with companions as close as 10 AU.
At the age of Ophiuchus, only very close
companions have had time to reduce
![]() by a significant
factor (separation
by a significant
factor (separation
![]() 30 AU or
30 AU or
![]() 0.2 arcsec
for an age of 106 years
according to Calvet et al. 2000).
There have been a number of multiplicity surveys of Ophiuchus,
some capable of detecting very close binaries. Three
Class II objects (i.e., objects with a mid-IR detected circumstellar disk)
have companions closer than
0.2 arcsec
for an age of 106 years
according to Calvet et al. 2000).
There have been a number of multiplicity surveys of Ophiuchus,
some capable of detecting very close binaries. Three
Class II objects (i.e., objects with a mid-IR detected circumstellar disk)
have companions closer than
![]() 0.25 arcsec
(Barsony et al. 2005;
Ratzka et al. 2005);
one has detected Pa
0.25 arcsec
(Barsony et al. 2005;
Ratzka et al. 2005);
one has detected Pa![]() ,
while in the other two cases
the line has not been detected.
The observational evidence of a correlation between
the accretion rate and the presence of very close
companions is clearly inconclusive. At this stage, it cannot be
quantitatively confirmed nor dismissed,
and should be investigated further.
,
while in the other two cases
the line has not been detected.
The observational evidence of a correlation between
the accretion rate and the presence of very close
companions is clearly inconclusive. At this stage, it cannot be
quantitatively confirmed nor dismissed,
and should be investigated further.
Although all the effects discussed so far
can play a role and need further investigation,
it is possible that differences in the initial conditions,
i.e., in the physical properties of the molecular cores
from which the star+disk system forms,
determine the TTS disk properties, and in particular the behaviour
of
![]() disussed in this paper.
disussed in this paper.
The self-similar viscous disk models of Hartmann et al. (1998)
show that the
accretion rate is proportional to the disk mass at t=0,
i.e., when accretion onto the disk stops,
and, in the early phases ot the evolution, to its t=0 outer radius,
which in turns depend on the core properties.
Alexander & Armitage (2006) have started exploring
how this can introduce a
![]()
![]()
![]() correlation
at a later time.
correlation
at a later time.
More realistic models
that follow the formation and evolution of
circumstellar disks (Hueso & Guillot 2005) illustrate
clearly how different core properties (in particular, different
rotation velocities) can create a large
spread of
![]() for objects with the same
for objects with the same ![]() and age.
and age.
Models that compute the evolution of disks starting from the core
infall phase over a large range of parameters are required, if we
want to estimate
the effect of the initial conditions on the
relation of
![]() with
with ![]() and on its scatter.
The observations presented in this paper, and the similar results
for Taurus, provide an excellent test of such models.
Note that the
the fact that disk accretion properties in Taurus and Ophiuchus
are very similar, while the two regions have large
differences in their environment, should put strong constraints
on these models, which will be interesting to explore fully.
and on its scatter.
The observations presented in this paper, and the similar results
for Taurus, provide an excellent test of such models.
Note that the
the fact that disk accretion properties in Taurus and Ophiuchus
are very similar, while the two regions have large
differences in their environment, should put strong constraints
on these models, which will be interesting to explore fully.
In this paper, we report the results of a near-IR
spectroscopic survey of a large sample
of very young objects in the ![]() Oph core.
The sample includes all
Class II objects, i.e., objects with evidence of circumstellar disks
from mid-IR photometry (BKA01). This sample
covers the mass range between about 0.03 to 3
Oph core.
The sample includes all
Class II objects, i.e., objects with evidence of circumstellar disks
from mid-IR photometry (BKA01). This sample
covers the mass range between about 0.03 to 3 ![]() ;
according
to BKA01, it is
complete to a limiting magnitude of about 0.03
;
according
to BKA01, it is
complete to a limiting magnitude of about 0.03 ![]() ,
or 0.05
,
or 0.05 ![]() .
We have also observed a significant fraction
of Class III objects, i.e., with no mid-IR excess emission,
covering a similar range of luminosities.
.
We have also observed a significant fraction
of Class III objects, i.e., with no mid-IR excess emission,
covering a similar range of luminosities.
In contrast to the Balmer lines,
the near-IR hydrogen recombination lines are seen in
emission only in Class II objects. Of all our Class III sample,
none has detected Pa![]() emission. This confirms our
assumption (Natta et al. 2004) that the near-IR lines can provide
an immediate indication of the accreting properties of young stars,
even when only relatively low resolution spectra are available.
emission. This confirms our
assumption (Natta et al. 2004) that the near-IR lines can provide
an immediate indication of the accreting properties of young stars,
even when only relatively low resolution spectra are available.
We have derived the mass accretion rate
![]() from the luminosity of the hydrogen recombination
lines, mostly from Pa
from the luminosity of the hydrogen recombination
lines, mostly from Pa![]() but in few cases from Br
but in few cases from Br![]() .
In total, we obtain measurements of
.
In total, we obtain measurements of
![]() for 45 Class II objects, and upper limits for
39.
for 45 Class II objects, and upper limits for
39.
Our results show that
![]() increases sharply with
increases sharply with ![]() (
(
![]() ).
We also find a large range of values of
).
We also find a large range of values of
![]() for any given value of
for any given value of
![]() (a spread of roughly two order of
magnitudes, independent of
(a spread of roughly two order of
magnitudes, independent of ![]() ). As discussed in the text,
this is likely a lower limit to the true dispersion.
). As discussed in the text,
this is likely a lower limit to the true dispersion.
When compared to accretion measurements in Taurus
(see Muzerolle et al. 2005, and references therein), we find that the two regions
look very similar, at least for objects with ![]()
![]() 0.1
0.1 ![]() .
For both Taurus and Ophiuchus, the dependence
of
.
For both Taurus and Ophiuchus, the dependence
of
![]() on
on ![]() ,
the upper envelope of the
,
the upper envelope of the
![]() distribution (i.e., the
largest values of
distribution (i.e., the
largest values of
![]() that any object of a given mass seems able to sustain),
and the range of
that any object of a given mass seems able to sustain),
and the range of
![]() values for any given
values for any given ![]() ,
are very similar. At lower mass, the accretion rates of the Ophiuchus
objects are much larger than their Taurus analogs.
,
are very similar. At lower mass, the accretion rates of the Ophiuchus
objects are much larger than their Taurus analogs.
The observed behaviour of
![]() does not have an obvious explanation.
The correlation of
does not have an obvious explanation.
The correlation of
![]() with
with ![]() may be due to a dependence of
the disk physics on the properties of the central star.
Muzerolle et al. (2003)
suggest as a cause
the effect of the X-ray emission from
the central star on the disk ionization and angular momentum transfer.
It is also possible that the correlation reflects
the properties of the pre-stellar cores,
from which the star and disk form. Both possibilities need to be explored further.
may be due to a dependence of
the disk physics on the properties of the central star.
Muzerolle et al. (2003)
suggest as a cause
the effect of the X-ray emission from
the central star on the disk ionization and angular momentum transfer.
It is also possible that the correlation reflects
the properties of the pre-stellar cores,
from which the star and disk form. Both possibilities need to be explored further.
The large spread of values of
![]() for any
for any ![]() may be a side-product
of the same mechanisms that produce the correlation between these
two quantities, as discussed in Sect. 5. In addition,
other effects may play an important role, for example the dynamical
action of close companions, or the intrinsic variability of the
accretion process.
may be a side-product
of the same mechanisms that produce the correlation between these
two quantities, as discussed in Sect. 5. In addition,
other effects may play an important role, for example the dynamical
action of close companions, or the intrinsic variability of the
accretion process.
Acknowledgements
It is a pleasure to acknowledge the continuous, competent and friendly support of the ESO staff during the preparation and execution of the Visitor and Service Mode observations at La Silla and Paranal observatories. We whish to thank an anonymous referee for very useful comments. This project was partially supported by MIUR grants 2002028843/2002 and 2004025227/2004.
![\begin{figure}
\par\includegraphics[width=8.4cm,clip]{4706fig4.ps}\end{figure}](/articles/aa/full/2006/22/aa4706-05/img62.gif) |
Figure A.1:
Same as Fig. 3 for different ages and evolutionary
tracks. The top-left panel is for DM98 0.5 My (as in Fig. 3),
the bottom-left for DM98, 1 My, the top right is for Siess (2000) evolutionary
tracks at 0.5 My, the bottom right at 1 My. In each panel, the
two dotted lines (
|
The assumption of coeval star formation, albeit quite reasonable
for a region like ![]() Oph, introduces errors in our results.
The same is true of the choice of any specific set of evolutionary tracks.
However, it turns out that both kinds of errors are unimportant,
when dealing with
a large sample of objects as in our case.
Oph, introduces errors in our results.
The same is true of the choice of any specific set of evolutionary tracks.
However, it turns out that both kinds of errors are unimportant,
when dealing with
a large sample of objects as in our case.
Figure A.1 shows the analog of Fig. 3,
reproduced on the top-left panel,
computed using the DM98 isochrone for 1 My and the evolutionary
tracks of Siess (2000) for 0.5 My and 1 My, respectively.
Older tracks give slightly lower values of
![]() ,
especially for more massive objects,
while the range of
,
especially for more massive objects,
while the range of ![]() remains practically
the same. Adopting different evolutionary
tracks does not change the results.
The main consequence of assuming coeval star formation
is to reduce slightly the real spread of
remains practically
the same. Adopting different evolutionary
tracks does not change the results.
The main consequence of assuming coeval star formation
is to reduce slightly the real spread of
![]() for any
given value of
for any
given value of ![]() .
.
A validation of the method used to compute the two
quantities
![]() and
and ![]() and an estimate of the errors can be obtained by
applying the same procedure to a sample of objects with known stellar
parameters and accretion rates.
and an estimate of the errors can be obtained by
applying the same procedure to a sample of objects with known stellar
parameters and accretion rates.
![\begin{figure}
\par\includegraphics[width=6.8cm,clip]{4706fig5.ps}\end{figure}](/articles/aa/full/2006/22/aa4706-05/img63.gif) |
Figure B.1:
Top panel:
|
The only sample for which this is possible is Taurus,
which has been studied extensively over a large range of masses
We have taken all the Taurus objects for which we could find in the
literature reliable stellar parameters and accretion rates,
measured from veiling and/or by fitting the observed H![]() profiles
with magnetospheric accretion models
(Muzerolle et al. 1998a, 2003, 2005;
Calvet et al. 2004).
For those with published Pa
profiles
with magnetospheric accretion models
(Muzerolle et al. 1998a, 2003, 2005;
Calvet et al. 2004).
For those with published Pa![]() fluxes or equivalent widths,
we have followed the same procedure used for the
fluxes or equivalent widths,
we have followed the same procedure used for the ![]() Oph sample. We have first computed
Oph sample. We have first computed
![]() from L(Pa
from L(Pa![]() ), and determined
the stellar parameters
), and determined
the stellar parameters ![]() /
/![]() and
and ![]() from
from ![]() ,
assuming coeval
star formation at 1 My and the DM98 evolutionary tracks.
,
assuming coeval
star formation at 1 My and the DM98 evolutionary tracks.
![]() is then derived from
is then derived from
![]() and
and ![]() /
/![]() .
.
The results are summarized in the Fig. B.1.
The top panel shows the complete sample of Taurus objects for which we could
find measurements of
![]() in the literature. The squares are those
for which also Pa
in the literature. The squares are those
for which also Pa![]() data exist; because none of the BDs in Taurus
has a published J-band spectrum, we have added the BDs in Ophiuchus
and Chamaeleon for which Natta et al. (2004) have measured
data exist; because none of the BDs in Taurus
has a published J-band spectrum, we have added the BDs in Ophiuchus
and Chamaeleon for which Natta et al. (2004) have measured
![]() from
model fitting of the H
from
model fitting of the H![]() profiles.
The bottom panel shows the same plot when both
profiles.
The bottom panel shows the same plot when both ![]() and
and
![]() are derived
from the observed
are derived
from the observed ![]() and Pa
and Pa![]() luminosity, as for the
luminosity, as for the ![]() Oph stars.
Oph stars.
The results indicate that our procedure does not introduce systematic
trends in the results. The trend of
![]() increasingsharply
with
increasingsharply
with ![]() is reproduced in our method,
and also the range of
is reproduced in our method,
and also the range of
![]() for a given
for a given
![]() is similar, even if, as expected, the assumption of
coeval star formation underestimates its spread slightly.
is similar, even if, as expected, the assumption of
coeval star formation underestimates its spread slightly.
Table C.1: Class II objects.
Table C.2: Class III objects.
Table C.3: Companions not resolved by 2MASS.