A&A 450, 569-583 (2006)
DOI: 10.1051/0004-6361:20054128
Ammonia in infrared dark clouds
T. Pillai1 -
F. Wyrowski1 -
S. J. Carey2 -
K. M. Menten1
1 - Max-Planck-Institut für Radioastronomie, Auf dem Hügel 69, 53121 Bonn, Germany
2 -
Spitzer Science Center, California Institute of Technology, MC 314-6, 1200 East California Boulevard, Pasadena, CA 91125, USA
Received 30 August 2005 / Accepted 5 December 2005
Abstract
Context. While low mass clouds have been relatively well studied, our picture of high-mass star formation remains unclear. Infrared Dark Clouds appear to be the long sought population of cold and dense aggregations with the potential of harbouring the earliest stages of massive star formation. Up to now there has been no systematic study on the temperature distribution, velocity fields, chemical and physical state toward this new cloud population.
Aims. Knowing these properties is crucial for understanding the presence, absence and the very potential of star formation. The present paper aims at addressing these questions. We analyse temperature structures and velocity fields and gain information on their chemical evolution.
Methods. We mapped the
(J,K) = (1, 1) and (2, 2) inversion transitions of ammonia in 9 infrared dark clouds. Our observations allow the most reliable determination of gas temperatures in IRDCs to date.
Results. The gas emission is remarkably coextensive with the extinction seen at infrared wavelengths and with the submillimeter dust emission. Our results show that IRDCs are on average cold (
 )
and have variations among the different cores. IRDC cores are in virial equilibrium, are massive (M > 100
)
and have variations among the different cores. IRDC cores are in virial equilibrium, are massive (M > 100  ), highly turbulent (1-3
 )
and exhibit significant velocity structure (variations around 1-2
over the cloud).
)
and exhibit significant velocity structure (variations around 1-2
over the cloud).
Conclusions. We find an increasing trend in temperature from IRDCs with high ammonia column density to high mass protostellar objects and Ultracompact H II regions, stages of early warm high-mass star formation. The linewidths of IRDCs are smaller than those observed in high mass protostellar objects and hot core/Ultracompact H II regions. On basis of this sample, and by comparison of the ammonia gas properties within a cloud and between different clouds, we infer that while active star formation is not yet pervasive in most IRDCs, local condensations might collapse in the future or have already begun forming stars.
Key words: stars: formation - ISM: molecules - radio lines: ISM - ISM: kinematics and dynamics
Infrared dark clouds (IRDCs) are cold, dense molecular clouds seen in
silhouette against the bright diffuse mid-infrared (MIR) emission of
the Galactic plane. They were discovered during mid-infrared imaging
surveys with the Infrared Space Observatory (ISO,
Perault et al. 1996) and the Mid-course Space Experiment (MSX,
Egan et al. 1998).
In an initial census of a  180
180 long strip of the Galactic
plane (between 269< l < 91,
long strip of the Galactic
plane (between 269< l < 91,
 ),
Egan et al. (1998) found 2000 compact objects seen in
absorption against bright mid-infrared emission from the Galactic
plane. Examination of 2MASS, MSX and IRAS images of these objects
reveals that they appear as shadows at all these wavelengths, although
they are best identified in the
),
Egan et al. (1998) found 2000 compact objects seen in
absorption against bright mid-infrared emission from the Galactic
plane. Examination of 2MASS, MSX and IRAS images of these objects
reveals that they appear as shadows at all these wavelengths, although
they are best identified in the  m MSX band, because,
first, the 7.7 and 8.6
m MSX band, because,
first, the 7.7 and 8.6  m PAH features associated with
star-forming regions contribute to a brighter background emission and,
second, the MSX m band is more sensitive than the satellite's other
bands. Recently, we have reviewed the observational studies on IRDCs
(Menten et al. 2005).
m PAH features associated with
star-forming regions contribute to a brighter background emission and,
second, the MSX m band is more sensitive than the satellite's other
bands. Recently, we have reviewed the observational studies on IRDCs
(Menten et al. 2005).
Table 1:
List of IRDCs observed in
 (1, 1) and (2, 2).
While low mass clouds have been relatively well studied, our picture
of high-mass star formation
remains unclear (see Evans et al. 2002). IRDCs appear to be the
long sought population of cold and dense aggregations with the
potential of harbouring the earliest stages of massive star
formation. It is likely that some of the stars forming in them are
massive (luminosities of submm condensations range up to 104  ). A recent study by Ormel et al. (2005) on an IRDC towards
the W51 Giant Molecular Cloud (GMC) suggests that sources of 300
are embedded within the cores, most likely protostars.
Recently, we (Pillai et al. 2005) reported a detailed study of the
strongest submm peak in the IRDC G11.11-0.12, where we find clear
evidence of a heavily embedded protostar.
). A recent study by Ormel et al. (2005) on an IRDC towards
the W51 Giant Molecular Cloud (GMC) suggests that sources of 300
are embedded within the cores, most likely protostars.
Recently, we (Pillai et al. 2005) reported a detailed study of the
strongest submm peak in the IRDC G11.11-0.12, where we find clear
evidence of a heavily embedded protostar.
The salient results on IRDCs are summarised below. The IRDCs observed
so far have sizes of 1-10 pc and have mostly a filamentary
morphology. On the basis of LVG calculations of mm
 observations
Carey et al. (1998) find that typical IRDCs have gas densities of
observations
Carey et al. (1998) find that typical IRDCs have gas densities of
 and temperatures of
.
Kinematic distances determined from
observations using a
standard Galactic rotation curve that ranges between 2.2 and 4.8 kpc
(Carey et al. 1998)
indicate that the clouds are
not local. All observed IRDCs in the sample of Carey et al. (2000)
contain 1-4 bright sub-millimeter (submm) dust continuum emission
peaks (>1 Jy/ 14
and temperatures of
.
Kinematic distances determined from
observations using a
standard Galactic rotation curve that ranges between 2.2 and 4.8 kpc
(Carey et al. 1998)
indicate that the clouds are
not local. All observed IRDCs in the sample of Carey et al. (2000)
contain 1-4 bright sub-millimeter (submm) dust continuum emission
peaks (>1 Jy/ 14
 beam at 850
  m) surrounded by an
envelope of emission which matches the morphology of the IRDC in
mid-infrared extinction. The cores corresponding to the brightest
submm peaks have masses of 100 to 1200 ,
except for two
clouds in the Cygnus region that have masses around 40 .
m) surrounded by an
envelope of emission which matches the morphology of the IRDC in
mid-infrared extinction. The cores corresponding to the brightest
submm peaks have masses of 100 to 1200 ,
except for two
clouds in the Cygnus region that have masses around 40 .
Hennebelle et al. (2001) in a systematic analysis of the ISOGAL
images extracted about 450 IRDCs, for which they derive  m
optical depths of 1 to 4. Teyssier et al. (2002) reported that Large
Velocity Gradient (LVG) model calculations of HC3N, 13CO, and
C18O yield densities larger than 105
m
optical depths of 1 to 4. Teyssier et al. (2002) reported that Large
Velocity Gradient (LVG) model calculations of HC3N, 13CO, and
C18O yield densities larger than 105
 in the densest
parts. The authors claim to find kinetic temperatures between 8 and 25
K based on CH3CCH observations; the higher values being found
toward embedded objects, however a detailed analysis is hitherto
unpublished.
in the densest
parts. The authors claim to find kinetic temperatures between 8 and 25
K based on CH3CCH observations; the higher values being found
toward embedded objects, however a detailed analysis is hitherto
unpublished.
Observations of molecules in IRDCs so far have concentrated on just a
few species. Up to now there has been no systematic study on the
temperature distribution, velocity fields, chemical and physical state
toward this new cloud population. Knowing these properties is crucial
for understanding the presence, absence and the very potential of star
formation. The present paper aims at addressing these questions. We
have started with a survey of a sample of 9 IRDCs in (1, 1) and (2, 2)
cm rotational transitions of ammonia (
). This sample
has been studied before by
Carey et al. (1998) and Carey et al. (2000) and was selected
on the basis of the large extent and high contrast of the IRDCs against the MIR
background.
Ammonia has proven to be an important tool in measuring the physical
conditions in molecular clouds (Ho & Townes 1983). Since only the
lowest
energy levels are expected to be populated in cool dark
clouds (T<20 K), their physical conditions can be
probed using the (1, 1) and (2, 2) inversion transitions in the
metastable (J,K) rotational levels of ammonia. Radiative transitions
between different K-ladders are forbidden, therefore the lowest levels
are populated only via collisions. The optical depth can be
determined from the ratio of the hyperfine satellites. Thus, the
population of the different levels can be estimated and hence the
temperature of the gas determined. In addition, recent chemical models
reveal that
(and also N2H+), does not deplete from the gas
phase for the densities observed in IRDCs (<106
)
(Bergin & Langer 1997). Thus
is an excellent tracer of the
dense gas where many other molecules would have heavily depleted.
In Sect. 2, we give details of our observations with
the Effelsberg 100 m telescope.
In Sect. 3, we discuss the
data reduction and present the correlation between gas emission and
MIR absorption. In Sect. 4, we derive the
rotational temperature,
gas kinetic temperature and
column density. Furthermore, we analyse the velocity structure,
estimate dust mass, virial mass and
abundance. In
Sect. 5, we compare the core gas properties (temperature,
linewidths and column density) with that of other populations of
objects that are thought
to trace the early stages of high mass star
formation. We do a similar comparison with
local dark
clouds well-studied in
.
Finally, we speculate on a possible
formation mechanism of IRDCs involving supernova remnants.
2 Observations
We mapped the IRDCs listed in Table 1 with the
Effelsberg 100 m telescope of the Max-Planck-Institut für
Radioastronomie in October 1999. The frontend was the facility 1.3
cm maser receiver tuned to a frequency of 23.7 GHz centered
between the
(1, 1) and (2, 2) transitions. The spectrometer was
a 8192 channel auto-correlator used with 2 subunits of
20 MHz bandwidth each. The resulting spectral resolution was  0.2 km s-1 after smoothing the data to increase the
signal-to-noise ratio. The beamwidth at the frequencies of the
lines is 40
(FWHM). The observations were conducted in
frequency switching mode with a frequency throw of 7.5 MHz. The maps
toward all sources covered the extinction seen in the MSX images and
were made with half power beamwidth (HPBW) spacing (40
). Alternate scans
were inter-spaced at half the full beamwidth resulting in
0.2 km s-1 after smoothing the data to increase the
signal-to-noise ratio. The beamwidth at the frequencies of the
lines is 40
(FWHM). The observations were conducted in
frequency switching mode with a frequency throw of 7.5 MHz. The maps
toward all sources covered the extinction seen in the MSX images and
were made with half power beamwidth (HPBW) spacing (40
). Alternate scans
were inter-spaced at half the full beamwidth resulting in
 spacing. Pointing was
checked at roughly hourly intervals by means of continuum drift scans
on nearby pointing sources. We found the pointing to be accurate to
within 12
.
spacing. Pointing was
checked at roughly hourly intervals by means of continuum drift scans
on nearby pointing sources. We found the pointing to be accurate to
within 12
.
Absolute calibration is not an issue in determining the rotational
temperature, because it is solely governed by the ratio of the
(1, 1) hyperfine lines and the (1, 1) and (2, 2) brightness
temperatures. However, in order to estimate the excitation
temperature and the column density the data needs to be
calibrated. The calibration procedure is documented on our webpage![[*]](/icons/foot_motif.gif) . The
important steps are mentioned below. The 100 m data (normally in CLASS
format) is in arbitrary noise tube units (
. The
important steps are mentioned below. The 100 m data (normally in CLASS
format) is in arbitrary noise tube units ( )
and has to be
converted to main beam brightness temperature units. We observe a
standard flux calibrator with known flux
)
and has to be
converted to main beam brightness temperature units. We observe a
standard flux calibrator with known flux
 at wavelength
  and thus estimate the conversion factor from
scale to
and thus estimate the conversion factor from
scale to  .
.
The main beam brightness temperature
 of the calibrator
for a given beamwidth
of the calibrator
for a given beamwidth  and wave length
is then
given by
and wave length
is then
given by
 |
(1) |
The primary flux calibration is based upon continuum scans of NGC7027
assuming a flux density of 5.6 Jy
(Ott et al. 1994). The Ultracompact H II (UCH II)
regions G10.62-0.38 and G34.26+0.15 and the quasar J1743-038 were used
as secondary calibrators which span the entire elevation range and an
elevation-dependant calibration factor was derived. The maximum
rms uncertainty in calibration for elevations lower than
 is 15%.
3 Data reduction and analysis
The spectra were reduced using the CLASS package
(Forveille et al. 1989). For a given source, the spectra were
averaged and a polynomial baseline of order 3-5 subtracted.
The maps
were generated by convolving the original data using a
Gaussian function with a HPBW of 40
.
Table 1 reports the coordinates of the central
position for each map.
MSX 8 m images of these clouds with superimposed contours of the
(1, 1) integrated intensity are shown in Fig. 1.
The velocity range used for
integration is within  25
of the "Local Standard of Rest
Velocity'',
25
of the "Local Standard of Rest
Velocity'',
 ,
hence including the satellite lines. The
maps of G79.27+0.38 and G33.71-0.01 have clumpy structures. Some of the
clumps may be artificial and caused by the low signal-to-noise ratio.
,
hence including the satellite lines. The
maps of G79.27+0.38 and G33.71-0.01 have clumpy structures. Some of the
clumps may be artificial and caused by the low signal-to-noise ratio.
The reduced (1, 1) and (2, 2) spectra for the
peak positions of
the observed sources are shown in Fig. 2.
(1, 1)
observations were reduced using "METHOD NH3(1, 1)'' in CLASS to fit
the hyperfine structure and derive optical depths and linewidths. The
standard procedure to analyse the
(1, 1) and (2, 2) lines have
been described in detail by Bachiller et al. (1987).
The hyperfine structure of the (2, 2) line is too weak to be observed;
therefore, the optical depth could be obtained only for
(1, 1). The
(1, 1) and (2, 2) main beam brightness temperatures are obtained by fitting the main line with a single
Gaussian. The (1, 1) and (2, 2) linewidth is obtained by the hyperfine fitting
which accounts for the line broadening due to optical
depth effects excluding self-absorption.
The parameters obtained from the fits to the (1, 1) hyperfine lines are
listed in Table 2.
![\begin{figure}
\par\includegraphics[height=18cm]{4128fig1.eps}
\end{figure}](/articles/aa/full/2006/17/aa4128-05/Timg34.gif) |
Figure 1:
MSX image of the clouds at 8.3 m (greyscale) with
(1, 1) integrated intensity as contours. The
(1, 1) maps have a
resolution of 40
and the same spacing. The greyscale
corresponds to intensity range shown by the wedge in the upper right
corner (from dark to light). The contour levels are  , ,
 , ,
 , ,
 , ,
 ... The rms
noise levels are given in Table 2. The
approximate map boundary is also indicated. Tick marks are coordinate
offsets (in arcseconds) relative to the positions given in
Table 1. The bar indicates a length of 1 pc at the
distance of each IRDC. ... The rms
noise levels are given in Table 2. The
approximate map boundary is also indicated. Tick marks are coordinate
offsets (in arcseconds) relative to the positions given in
Table 1. The bar indicates a length of 1 pc at the
distance of each IRDC. |
| Open with DEXTER |
![\begin{figure}
\par\includegraphics[width=18cm,clip]{4128fig2.eps}
\end{figure}](/articles/aa/full/2006/17/aa4128-05/Timg35.gif) |
Figure 2:
(1, 1) (lower histogram in each panel) and (2, 2) (upper
histogram, offset from 0 K for clarity) spectra toward the brightest position of the 9 observed
sources. The brightest positions are referred to as
P1 in
Table 3. |
| Open with DEXTER |
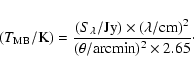
The basic physical parameters, namely the excitation temperature,
rotational temperature, the kinetic temperature and ammonia column
density, have been derived using the standard formulation for
spectra (Ho & Townes 1983). Table 3
summarises the estimates of these parameters toward the cores. We give
the formal errors (1 ), derived from Gaussian error
propagation.
), derived from Gaussian error
propagation.
Table 2:
(1, 1) and (2, 2) map results: peak position.
Table 3:
Physical properties of observed IRDCs.
4 Results
Our sample consists of both "Infrared dark clouds'', with extents of
1-10 pc, and "Infrared dark cloud complexes'', which are comprised of
multiple individual clouds.
IRDC G11.11-0.12 would thus be a complex (>4 pc) while G24.63+0.15
would be a dark cloud. The IRDCs G79.34+0.33 and G79.27+0.38 are
essentially two parts of the same extended filament in the Cygnus-X
region connected by a bright patch of dust emission as seen in SCUBA
and MSX images (Redman et al. 2003).
4.1 Cloud morphology
There is generally a close match
between the ammonia emission and the mid-infrared extinction as shown in Fig. 1. In
G24.72-0.75 and G79.34+0.33, the
emission peak is however
correlated with bright and compact MIR
emission. Redman et al. (2003) find that the MIR emission in
G79.34+0.33 corresponds to a luminous "Young Stellar Object'' (YSO)
with a strong IR excess which might be interacting with the foreground
IRDC. No such interaction has been reported for the IRDC G24.72-0.75
and the nature of the MIR object is unknown.
In general, the cloud geometry is extended and filamentary and in no case
close to spherical. The mean aspect ratio determined by fitting 2D
ellipse to the entire
emitting region is 2.2 and the total
extent of the clouds ranges from 0.4-8.3 pc. G11.11-0.12 is a
filamentary cloud as revealed by the 8 m extinction and the
850 m dust emission as shown in Fig. 3.
The peaks of the submm emission are
strikingly coincident with the ammonia cores. The
map reveals at
least two peaks toward the north-east segment and another set of
peaks towards the southwest extension of the filament suggesting
that there are several unresolved sub-structures or cores within the extended
filament.
The strongest submm emission peak P2 in
G28.34 is in
the close vicinity of the IRAS source 18402-0403. But the peak of the
ammonia emission for the northern extension seems to be offset from
that of the IRAS source (see Fig. 4).
This could be due to the interaction of the
IRAS source with the cloud.
![\begin{figure}
\par\includegraphics[height=8.8cm, angle=-90]{4128fig3.eps}
\par\end{figure}](/articles/aa/full/2006/17/aa4128-05/Timg50.gif) |
Figure 3:
SCUBA 850 m image (Carey et al. 2000) of the
cloud G11.11-0.12 with
(1, 1) integrated intensity as
contours. The contour levels are multiples of .
SCUBA image has a resolution of 14
. |
| Open with DEXTER |
![\begin{figure}
\par\includegraphics[height=8.8cm, angle=-90]{4128fig4.eps}
\end{figure}](/articles/aa/full/2006/17/aa4128-05/Timg51.gif) |
Figure 4:
SCUBA 850 m image of G28.34 with
(1, 1)
integrated intensity as contours. The contour levels are (,
,
...). |
| Open with DEXTER |
4.2 Source sizes
Due to the large distances to the clouds, the compact structures
within the cloud are marginally resolved with the 40
beam of our
observations. Hence, estimating the size of the core from
might only
deliver upper limits of the order of the beam size. We use channel
maps to solve the problem of identifying clumps. The information in
the third dimension enables us to disentangle clumps that are
sufficiently well separated in velocity. For those sources with SCUBA
850 m data, we cross-identify the clumps within half
the
beam (20
)
at the higher SCUBA resolution (14
)
and estimate the source size by a 2D Gaussian fit to the
clumps in the SCUBA data. In cases where we do not have dust emission
maps, we use the 2D Gaussian fit routine in GRAPHIC. It searches for the
brightest pixel in each velocity channel of the channel map across the
(1, 1) main component and fits a 2D Gaussian to determine source
size. The output is then cross-checked over the different channels and
the fit obtained for the brightest emission is used. We find 1-5 clumps for each cloud. The source sizes after correcting for the beam
size (after subtracting the Gaussian beam size in quadrature) are listed in
Table 3. The dense cores within these
IRDCs are thus not resolved with the
 100 m beam.
We find several secondary peaks offset by >1
in most
sources; offsets from the central position are given in
Table 3. Table 3
should be referred to for the nomenclature of the clumps identified in
the
maps and/or the SCUBA 850 m images hereafter.
100 m beam.
We find several secondary peaks offset by >1
in most
sources; offsets from the central position are given in
Table 3. Table 3
should be referred to for the nomenclature of the clumps identified in
the
maps and/or the SCUBA 850 m images hereafter.
In general,
lines are brighter than the mm rotational
transitions observed by Carey et al. (1998). As given in
Table 2, the (2, 2) peak line intensity is on
average 40% of that of the (1, 1) line. Gaussian line profiles with extended
wings have been reported for
lines in most of the clouds
(Carey et al. 1998) but we do not observe any pronounced
wings in
.
Leurini et al. (2006, submitted) find line profiles similar to those
observed in
in the mm
transitions of CH3OH.
4.4 Linewidth
The width of a spectral line is an important parameter because it is a measure of
the total kinetic energy of the cloud. The
(1, 1) linewidths for
all sources lie between 0.8-3
.
The
linewidths are significantly larger (factor 2) than the
linewidths in all cases except G81.50+0.14, where the
linewidths are twice as large.
The
linewidths for our sample are higher than those of
cores reported in Jijina et al. (1999), which are mostly
low mass cores. The large linewidths might be explained as due to
clumping. Clumps with smaller linewidth but with a higher
clump-to-clump velocity dispersion may add up to the observed linewidths.
The sources closest to us (G79 IRDCs) have the smallest linewidth and belong
to the Cygnus-X region. In order to test whether the
larger linewidth we observe at larger distance is a distance effect,
we average the G79 IRDC linewidth over an area
 where
where
 is the distance to a source
farther than Cyg and with a much higher linewidth. On comparing the
resultant scaled values, we find that the linewidths are still
significantly larger for the sources at larger distances after accounting for
the larger region in each beam for the more distant cores.
is the distance to a source
farther than Cyg and with a much higher linewidth. On comparing the
resultant scaled values, we find that the linewidths are still
significantly larger for the sources at larger distances after accounting for
the larger region in each beam for the more distant cores.
To illustrate this point, let us take the example of the two
extreme values of linewidths from our sample. Dark core G79.27+0.38
P2 (at 1 kpc) has a linewidth at the brightest position of
0.83
while G28.34+0.06
P2 (at 4.8 kpc) has a
linewidth of 2.65
.
Neither of the two cores have a
MIR counterpart which might indicate any deeply embedded protostar
influencing its immediate environments. Averaging all the
emission in G79.27+0.38 over an area of
 ,
we
obtain a linewidth of 1.5
,
still smaller than
2.65
.
Therefore, the large linewidths derived appears
to be mainly due to the velocity dispersions within the beam.
,
we
obtain a linewidth of 1.5
,
still smaller than
2.65
.
Therefore, the large linewidths derived appears
to be mainly due to the velocity dispersions within the beam.
One of the assumptions made to derive the temperature is that the beam
filling factor is the same for both inversion lines; that is,
the two lines are emitted by the same volume of gas. The (2, 2) linewidths
are slightly larger than the (1, 1) linewidths
(cf. Table 2) toward only some cores,
suggesting that the same gas is not exactly traced by both lines in those
sources.
The linewidths
exhibited by these sources are much larger than the thermal linewidth,
 ,
which
for
,
which
for
 should be
 as per the relation
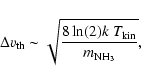 |
(2) |
where k is Boltzmann's constant and
 is the mass of the
ammonia molecule.
Average linewidths
is the mass of the
ammonia molecule.
Average linewidths
 could be explained in
terms of velocity gradients
due to rotation of the cloud,
or turbulent cloud movements. The linewidths seems to be especially
high towards the cloud G28.34+0.06, where there are several
unresolved
clumps, identified in the SCUBA images. In the G79
IRDC the linewidth decreases from G79.34+0.33
P1
(
could be explained in
terms of velocity gradients
due to rotation of the cloud,
or turbulent cloud movements. The linewidths seems to be especially
high towards the cloud G28.34+0.06, where there are several
unresolved
clumps, identified in the SCUBA images. In the G79
IRDC the linewidth decreases from G79.34+0.33
P1
(
 )
to G79.27+0.38
P3(
)
to G79.27+0.38
P3(
 ). As shown in Fig. 5,
we find that the linewidth anti-correlates with optical depth for G28.34
while there is a possible positive correlation G79.27.
). As shown in Fig. 5,
we find that the linewidth anti-correlates with optical depth for G28.34
while there is a possible positive correlation G79.27.
G79.27+0.38
P1 seems to be more quiescent than its
surroundings. In the G79 cloud complex, there is considerable
difference in linewidth (0.5
)
between the different
clumps along the cloud from east to west. Thus, these clouds might be
harbouring objects at different stages of evolution (Redman et al. 2003).
![\begin{figure}
\par\includegraphics[height=10.5cm, angle=0]{4128fig5.eps}
\par\end{figure}](/articles/aa/full/2006/17/aa4128-05/Timg64.gif) |
Figure 5:
Correlation plot between the
(1, 1) optical depth
and the
(1, 1) linewidth. Bottom panel: G79.27+0.38
P1, Top panel: G28.34+0.06
P2. |
| Open with DEXTER |
4.5 Kinetic temperature
Since the optical depth is known, we derive the excitation
temperature of the
(1, 1) inversion transition
(Table 3) via the relation
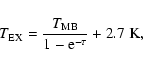 |
(3) |
where
and  represents the temperature
and the optical depth of the of the (1, 1) line. By
fitting the main and the hyperfine components of the (1, 1) line and
the main component of the (2, 2) line, we obtain the rotational
temperature. An analytical expression
(Tafalla et al. 2004) has been used to estimate
the kinetic temperature from the rotational temperature.
The kinetic temperature is given by the expression
represents the temperature
and the optical depth of the of the (1, 1) line. By
fitting the main and the hyperfine components of the (1, 1) line and
the main component of the (2, 2) line, we obtain the rotational
temperature. An analytical expression
(Tafalla et al. 2004) has been used to estimate
the kinetic temperature from the rotational temperature.
The kinetic temperature is given by the expression
![\begin{displaymath}T_{\rm kin} = {\frac{T_{\rm rot}}{1-\frac{T_{\rm rot}}{42}{\rm ln[1+1.1exp}(-16/T_{\rm rot})]}},
\end{displaymath}](/articles/aa/full/2006/17/aa4128-05/img67.gif) |
(4) |
The typical temperatures for the cores range from 11-17 K
as displayed in Table 3. In some cases, we
find that the fit to the
(1, 1) line slightly underestimates the peak
intensity.
We find that the kinetic temperature is significantly higher than the
excitation temperature, as given in
Table 3. The beam filling factor  is
a measure of the fraction of the beam filled by the observed source. Assuming
that the cores are in local thermodynamic equlibrium (LTE), we
may estimate this fraction as
is
a measure of the fraction of the beam filled by the observed source. Assuming
that the cores are in local thermodynamic equlibrium (LTE), we
may estimate this fraction as
 where
where
 is the kinetic temperature of the gas. We derive filling
factors of 0.3-0.5 for all the clumps. These low filling factors
suggest either sub-thermal excitation (non LTE conditions) or
clumping within the beam. From our estimation of the sizes
(Table 3), we find most of the cores are
unresolved with the 40'' beam. Thus clumping is more likely to
explain the small filling factors.
is the kinetic temperature of the gas. We derive filling
factors of 0.3-0.5 for all the clumps. These low filling factors
suggest either sub-thermal excitation (non LTE conditions) or
clumping within the beam. From our estimation of the sizes
(Table 3), we find most of the cores are
unresolved with the 40'' beam. Thus clumping is more likely to
explain the small filling factors.
We find hints of temperature gradients (inside-out) within the
cores in three sources and a reverse gradient in one source. However the large
error bars associated with the rotational temperature does not allow
us to make a convincing case. The temperature structure will be analysed
in detail in a future paper with observations at high angular resolution (Pillai et al. 2006 in prep.).
![\begin{figure}
\par\includegraphics[height=8.8cm, angle=-90]{4128fig6.eps}
\end{figure}](/articles/aa/full/2006/17/aa4128-05/Timg71.gif) |
Figure 6:
The average velocity-position map of
(1, 1) for the cloud G11.11-0.12 at a position angle of 40.
Note that the Y axis is
the offset from the reference position, given in
Table 1. Offsets run from south-west (negative
offsets) to north-east (positive offsets). |
| Open with DEXTER |
There is also a variation in temperature within the different cores of
the same cloud. In G11.11-0.12, with a projected extent of a few pc,
the average (over the core size) temperatures of the
southern cores are 2-3 K ( K) lower than the northern
cores (
K) lower than the northern
cores ( K).
K).
In G28.34+0.06, the gas temperature derived towards
P3,
 K and
P5,
K and
P5,  K is significantly lower than in
the rest of the cloud.
K is significantly lower than in
the rest of the cloud.
 observations on the P1 position (Leurini
et al. 2006, submitted) reveal a cold and a hot component, the latter
with a small filling factor. We obtain kinetic temperatures of
observations on the P1 position (Leurini
et al. 2006, submitted) reveal a cold and a hot component, the latter
with a small filling factor. We obtain kinetic temperatures of  towards the peaks of
P1 and
P2. Higher angular
resolution observations are needed to confirm a hot component of small
extent also in ammonia.
towards the peaks of
P1 and
P2. Higher angular
resolution observations are needed to confirm a hot component of small
extent also in ammonia.
In G19.30+0.07, the temperature
at the position of peak
emission P1 is
 K, much warmer than the rest of the
cloud (
K, much warmer than the rest of the
cloud (
 K).
K).
In the G79 complex, we find that the temperature in G79.34+0.33
P1
is higher
(
 K) than the other 2 cores G79.27+0.38
P1
(
K) than the other 2 cores G79.27+0.38
P1
(
 K) & G79.27+0.38
P2 (
K) & G79.27+0.38
P2 (
 K) in the
western part of the filament.
K) in the
western part of the filament.
4.6 Velocity structure
The average velocity-position diagram along an axis with position
angle of +40
(to align the position axis roughly with the direction
of the filament on the sky) for the cloud G11.11-0.12 is shown in
Fig. 6. At every position along the position axis, the
(1, 1) spectra were averaged along a line perpendicular to the
position axis.
There is a clear trend for the velocities to decrease from the south
to the P1 position and increase to the north of the NE filament. This
is also seen in the channel maps shown in Fig. 7 where
the different clumps in the north and south appear at distinctly
separate velocities. Given that the
(1, 1) linewidth at all
positions is  2.5
,
this velocity shift (>5
)
between the peaks
is certainly significant. The unresolved clump
G11.11-0.12
P4 is more associated with the G11.11-0.12
P2 clump while P3 fades away at those velocities.
2.5
,
this velocity shift (>5
)
between the peaks
is certainly significant. The unresolved clump
G11.11-0.12
P4 is more associated with the G11.11-0.12
P2 clump while P3 fades away at those velocities.
Recently, this filament had been studied in absorption against the
diffuse 8 m Galactic background and in emission from cold dust
at 850 m (Johnstone et al. 2003). They model the 850 m
emission by fitting a non-magnetic isothermal cylinder profile to the
radial structure of the entire filament (south and north segment). The
velocity structure observed in
(1, 1), however, shows several distinct
clumps. This suggests that the density structure of the filament cannot
be rigorously described by a simple continuous cylinder.
![\begin{figure}
\par\includegraphics[angle=-90,width=16cm,clip]{4128fig7.eps}
\end{figure}](/articles/aa/full/2006/17/aa4128-05/Timg84.gif) |
Figure 7:
Channel maps for G11.11-0.12 over the main component
for the
(1, 1) transition. |
| Open with DEXTER |
The channel maps for G28.34+0.06 are shown in Fig. 8. The two
extensions of the cloud around P1 and P2 differ in velocity by about
1.5
.
This is the difference in velocity for the two peaks at
which they are brightest. From the channel maps it appears that there
is a bridge between the two parts of the cloud connecting P1 and
P2. At the velocity of 80.16
,
the three unresolved clumps, which are
identified in dust continuum emission but not clearly identified
in the
(1, 1) integrated intensity emission, are revealed.
![\begin{figure}
\par\includegraphics[angle=-90,width=16cm,clip]{4128fig8.eps}
\end{figure}](/articles/aa/full/2006/17/aa4128-05/Timg85.gif) |
Figure 8:
channel map for G28.34+0.06 over the main component for the
(1, 1) transition. |
| Open with DEXTER |
G33.71-0.01 shows another interesting case of distinct velocity
variations across a cloud. The average velocity position map along
the declination axis is displayed in Fig. 9. The velocity
increases from the south at 103
towards the north to
106
while showing a very wide weak component at
105
at the (0,0) position. Its detection at (0,0) is only
at the 2
level but is also observed in
(2, 2). A possible
interaction with the nearby SNR G33.6+0.1 is discussed in Sect. 5.2.
4.7 Column density, NH3 abundance and masses
We have estimated the column densities and total masses for the
bright, compact sources for which the SCUBA
 m maps
are available, after smoothing the data to the resolution of 100 m beam (40
).
Assuming a dust opacity of
m maps
are available, after smoothing the data to the resolution of 100 m beam (40
).
Assuming a dust opacity of
 of
1.85
of
1.85
 at
m for grains with thick ice
mantles and gas density
at
m for grains with thick ice
mantles and gas density
 (Ossenkopf & Henning 1994),
the effective
(Ossenkopf & Henning 1994),
the effective  column density is (Launhardt 1996)
 |
(5) |
where
 is the flux density in Jy/beam,
the
wavelength in m,
is the flux density in Jy/beam,
the
wavelength in m,
 is the metallicity relative to
the solar metallicity (we assume
is the metallicity relative to
the solar metallicity (we assume
 )
and
is
the FWHM of the 100 m beam in arcseconds. Here we assume that the dust temperature
)
and
is
the FWHM of the 100 m beam in arcseconds. Here we assume that the dust temperature  is
approximately equal to the gas temperature. We derive an effective
column density of the order of 6-
is
approximately equal to the gas temperature. We derive an effective
column density of the order of 6-
 cm-2 toward the peaks of the dust emission. Together with the
column density, this is used to determine the ammonia abundance
(
cm-2 toward the peaks of the dust emission. Together with the
column density, this is used to determine the ammonia abundance
(
 ). We determine the peak
effective
). We determine the peak
effective  column density from the SCUBA map and the
column density for the same position for each clump and get an upper
limit for the fractional
abundance as listed in
Table 3. The average abundance
is
column density from the SCUBA map and the
column density for the same position for each clump and get an upper
limit for the fractional
abundance as listed in
Table 3. The average abundance
is
 ,
however has a low value towards G79.27+0.38
P2
(
,
however has a low value towards G79.27+0.38
P2
(
 ,
as listed in
Table 3).
,
as listed in
Table 3).
The mass of the each cloud can be determined from the dust continuum and
from
emission. The gas mass is derived from the dust using
the relation (Launhardt & Henning 1997)
![\begin{displaymath}M({\rm H}_{2})[{M_\odot}] =
1.8\times 10^{-14}{\frac{S_{\nu}\...
...lambda}}}{\kappa_m(\lambda)}}{\frac{Z_{\odot}}{Z}}[ M_{\odot}]
\end{displaymath}](/articles/aa/full/2006/17/aa4128-05/img100.gif) |
(6) |
where  is the integrated flux density in Jy and the other parameters
are the same as in Eq. (5).
is the integrated flux density in Jy and the other parameters
are the same as in Eq. (5).
Our estimates for the mass and
 column density are in general agreement
with the previous work of Carey et al. (2000) for the submillimeter cores.
column density are in general agreement
with the previous work of Carey et al. (2000) for the submillimeter cores.
The total gas mass can be derived from the
column density maps
assuming a uniform fractional abundance of the molecule, for those
sources without dust continuum data. The gas mass derived from SCUBA
observations can be directly compared with the virial mass
estimate. The virial parameter (Bertoldi & McKee 1992) for a clump
is defined as
 |
(7) |
where
is the three dimensional root mean square (rms)
velocity dispersion and R is the radius of the clump, and M is the gas
mass. Note that
 .
The virial mass is defined as
.
The virial mass is defined as
 .
For the
clumps to be stable against collapse,
.
For the
clumps to be stable against collapse,
 .
We find an
average value of 2.1 for the virial parameter toward the individual cores. As the
uncertainty in the dust opacity alone is a factor of 2,
,
and
most of these cores appear to be virialised. Therefore, the core structure is
consistent with them being supported by turbulent pressure without any
evidence of external bounding pressures.
G28.34+0.06
P4 is an extreme case, where
.
We find an
average value of 2.1 for the virial parameter toward the individual cores. As the
uncertainty in the dust opacity alone is a factor of 2,
,
and
most of these cores appear to be virialised. Therefore, the core structure is
consistent with them being supported by turbulent pressure without any
evidence of external bounding pressures.
G28.34+0.06
P4 is an extreme case, where
 .
.
![\begin{figure}
\par\includegraphics[width=17cm,clip]{4128fig9.eps}
\end{figure}](/articles/aa/full/2006/17/aa4128-05/Timg108.gif) |
Figure 9:
Left panel: the average velocity-position map of
(1, 1)
along the declination axis for the
cloud G33.71-0.01. Right panel: the spectra obtained at the
corresponding position in the map (indicated by the arrows). Note the
large linewidth component toward the centre part of the cloud and the change in
LSR velocity from south to north. |
| Open with DEXTER |
5 Discussion
In G11.11-0.12, the position
P2 is a faint MSX source with no
counterpart in the visible or NIR; it is very likely that this is a
heavily embedded protostar (Pillai et al. 2005). The southern
clumps are colder by 2-3 K than the northern clumps. Thus,
these southern filaments may be at an earlier stage of evolution than the
cores belonging to the northern filament, where star formation
activity might heat up the gas. The core to core variation
in temperature within an IRDC is observed toward several other sources (see Sect. 4.5). Therefore, these dense cores in IRDCs are ideal sites
for investigating the initial conditions in forming a massive star.
The gas temperatures we derive generally agree with the
dust temperatures of Carey et al. (2000) based on submm observations and an
assumed dust emissivity index
 .
.
 might
be lower limits for those sources that show up as bright and
compact objects in the submm dust emission, indicating the presence of
a heavily embedded object, but reasonable for the cold gas envelope.
might
be lower limits for those sources that show up as bright and
compact objects in the submm dust emission, indicating the presence of
a heavily embedded object, but reasonable for the cold gas envelope.
The excellent correlation between the
line and submm continuum emission is
consistent with the predictions of chemical models that
is
relatively more abundant in high density region than other molecules
(Bergin 2003). The column densities translate to
extremely high extinction values of 55-450 mag. The discrepancies in
and
linewidths reported by Carey et al. (1998) (see
Sect. 4.4) indicate the differences in the gas volume
traced by the two molecules. The line wings seen in
and CH3OH
(Leurini et al. 2006, submitted) gas toward some sources are most likely
high-velocity outflows. The critical density of the
lines
studied (106
)
is much higher than that of the
inversion lines (104
). Hence, while physical parameters
derived from
are representative of the general, cool IRDC
material,
probes the dense gas, which might be influenced by
embedded protostars. The derived
abundance of 0.7-
 together with the centrally condensed
emission is consistent with the chemical model predicted for
pre-protostellar cores (Bergin & Langer 1997). These values
imply that
is overabundant by factors of 5-10 relative to
"normal'' (=lower density) and less turbulent dark clouds. In contrast,
H2CO is under-abundant by a factor of 50(Carey et al. 1998). Hence the IRDCs appear to exhibit a complex
chemistry.
together with the centrally condensed
emission is consistent with the chemical model predicted for
pre-protostellar cores (Bergin & Langer 1997). These values
imply that
is overabundant by factors of 5-10 relative to
"normal'' (=lower density) and less turbulent dark clouds. In contrast,
H2CO is under-abundant by a factor of 50(Carey et al. 1998). Hence the IRDCs appear to exhibit a complex
chemistry.
We derive the flow crossing time, for the
cloud to disperse due to its own internal motions. Perturbations
within the cloud would disintegrate the cloud unless the propagation
wavelength is much smaller than the distance across the cloud which it
traverses. The estimated dynamical timescales of 0.5-2 Myrs,
provide an upper limit to the life time of these
clouds.
The virial masses for the different clumps span a wide range from 50 to
 .
As typical for intermediate to high mass star-forming
regions, most of the masses are skewed to values
>
.
As typical for intermediate to high mass star-forming
regions, most of the masses are skewed to values
>
 .
The virial parameter 1 for most of the clumps
which are stable against collapse.
.
The virial parameter 1 for most of the clumps
which are stable against collapse.
In a comparison of our
results with the potential low mass
counterpart B68 (Lai et al. 2003), we find that the linewidths and the
virial masses are much higher towards our cores. The sizes and the
column density and most importantly the masses we derive are also
significantly higher, thus making IRDCs potential candidates as sites
of high-mass star formation. The (1, 1) and (2, 2) linewidths for IRDCs
are slightly lower but the
column densities are comparable to
the massive dense cloud identified in
in NGC 6334 I(N) by
Kuiper et al. (1995). In terms of masses and sizes and
temperatures, our sources are similar to those of
Garay et al. (2004). Star formation probably has already
started in some of them.
In Table 4, we present the mean
properties of the dense cores of our sample with those of the
cores in Taurus, Perseus and the Orion A complex as given in
Ladd et al. (1994). It is evident that IRDC cores are on
average highly turbulent, larger with much higher masses than the other cores
while having similar temperature as the other cores.
The IRDC masses derived here are for an
abundance of
10-7 as used by Ladd et al. (1994). But this is almost
an order of magnitude higher than what we derive and hence the mean
mass quoted in Table 4 will be an order
of magnitude higher, several 1000
instead of several 100.
Compared to local dark clouds, IRDCs pile up significantly large amounts of
mass and have supersonic internal motions. But how much of
this mass goes into forming stars of low, intermediate or high mass
is yet to be answered.
Tan (2005) find that a group of
local IRDCs have masses of a few 103-104
and mean surface
density of
 g
g
 .
They find that this is 3 times
the mean surface density of a Giant Molecular Cloud (GMC) and very similar to
the values found in more evolved systems like the Orion Nebula Cluster (ONC).
Subsequently, they suggest that IRDCs forming from GMCs are the initial
conditions for star clusters.
.
They find that this is 3 times
the mean surface density of a Giant Molecular Cloud (GMC) and very similar to
the values found in more evolved systems like the Orion Nebula Cluster (ONC).
Subsequently, they suggest that IRDCs forming from GMCs are the initial
conditions for star clusters.
Tan (2005) define  as
as
 ,
and if we compute the mean surface density for our sample and the
local dark clouds (the mean Mass and the size as given in
Table 4), we arrive at values between 0.08-0.4. If the mean surface density were to be a measure of star
formation efficiency, then IRDCs have a higher value compared to
Taurus but not very much higher than Perseus which is understood to be
an intermediate star forming region.
,
and if we compute the mean surface density for our sample and the
local dark clouds (the mean Mass and the size as given in
Table 4), we arrive at values between 0.08-0.4. If the mean surface density were to be a measure of star
formation efficiency, then IRDCs have a higher value compared to
Taurus but not very much higher than Perseus which is understood to be
an intermediate star forming region.
Studies of relatively local cluster forming regions like the  Ophiuchus cloud, the Serpens molecular cloud and Orion B molecular cloud
(Motte et al. 1998; Testi & Sargent 1998;
Johnstone et al. 2001) find that the mass spectrum of their cores
are very similar to that of the stellar IMF. If this is indeed true,
then the fraction of the core mass going into forming stars would be
independent of mass and the stellar IMF would mainly be determined by the
cloud fragmentation process (Blitz & Williams 1999). If
we assume a star formation efficiency of 30% in an IRDC core of mean mass
500
and adopt
the standard IMF (with power law indices
Ophiuchus cloud, the Serpens molecular cloud and Orion B molecular cloud
(Motte et al. 1998; Testi & Sargent 1998;
Johnstone et al. 2001) find that the mass spectrum of their cores
are very similar to that of the stellar IMF. If this is indeed true,
then the fraction of the core mass going into forming stars would be
independent of mass and the stellar IMF would mainly be determined by the
cloud fragmentation process (Blitz & Williams 1999). If
we assume a star formation efficiency of 30% in an IRDC core of mean mass
500
and adopt
the standard IMF (with power law indices
 ,
,
 and
and
 for masses >0.5, 0.08-0.5 and <0.05
respectively), then 116 stars could form in the core. Out of
this, 2 stars could be of high-mass stars (
for masses >0.5, 0.08-0.5 and <0.05
respectively), then 116 stars could form in the core. Out of
this, 2 stars could be of high-mass stars ( 8 )
while 64 would be low-mass/intermediate stars (
8 )
while 64 would be low-mass/intermediate stars ( /
/  )
while the rest would be very low mass and sub-stellar objects. Indeed
there is growing evidence of star formation in these cores
(Rathborne et al. 2005; Pillai et al. 2005;
Ormel et al. 2005).
)
while the rest would be very low mass and sub-stellar objects. Indeed
there is growing evidence of star formation in these cores
(Rathborne et al. 2005; Pillai et al. 2005;
Ormel et al. 2005).
From the velocity structure, G11.11-0.12
P2 appears blue
shifted while the clump
P1 towards the north and
P4
towards the south appears redshifted relative to the LSR
velocity. This is thus not a case of smooth velocity gradient along
the filament. It might be possible to explain the observed velocity
structure, if we assume that the entire filament seen in projection is
part of a unbound system where P1 and P4 lie at the same distance
along the line-of-sight (l.o.s) at diametrically opposite ends while
P2 is further in the front. A massive wind-driven process which might
have taken place in the close vicinity of the cloud could explain such
a structure. Recent wide field MIR images of this region released
from Spitzer show that this cloud has a filamentary concave structure
spread over several parsecs with a significant density enhancement in
the center (Menten et al. 2005). The morphology bears
remarkable similarity to the structures predicted by 3-D numerical
calculations simulating the impact of a planar shock front on an
isolated globule (Boss 1995). The best known case
of a ongoing SN-cloud interaction is in IC 443, where a 104 yr old SNR in the
GEM OB1 association with a shock speed of 40
impacts the cloud
resulting in highly excited molecular gas with very broad linewidths.
However, a weaker shock (likely from a more evolved SNR) would
result in temporary distortion and compression of the molecular cloud,
followed by rebound to a equilibrium. An evolved SNR at an age of 105 yr
with a shock speed of 100
,
is one of the three likely weak
shock waves that Boss (1995) propose to influence a cloud
without destroying it.
Such a shock wave would have already
traversed 25 pc. Brogan et al. (2004) recently discovered the
supernova remnant G11.03-0.05 which is within 7' of the
cloud. They claim that the SNR is not young.
The SNR has a
shell-like appearance with a diameter of 8 and very weak
emission at centimeter wavelengths. Brogan et al. (2004) find that a pulsar
PSRJ1809-1917 is located about 8.5' from the SNR and is probably
associated with the SNR.
Considering the respective uncertainties of their distance estimates, the
pulsar (
and very weak
emission at centimeter wavelengths. Brogan et al. (2004) find that a pulsar
PSRJ1809-1917 is located about 8.5' from the SNR and is probably
associated with the SNR.
Considering the respective uncertainties of their distance estimates, the
pulsar ( kpc) and G11.11-0.12 (
 kpc) appear at or near
the same distance.
kpc) appear at or near
the same distance.
In G33.71-0.01, we find another where the cloud seems to
have undergone a shock at the centre (see Fig. 9). Note
that there is a large linewidth towards the central core of this
filament. The (0, 0) velocity is also different from the cores toward
the south and north segment of the filament. The SNR G33.6+0.1 is
within 5' of this core and previous observations by
Green (1989) shows an unusually broad OH absorption feature near
105
towards this SNR. The
 and
and
 observations by Green & Dewdney (1992) reveal material
shocked by the interaction of the SNR with the adjacent molecular
cloud. The 2
detection of a large linewidth feature
observations by Green & Dewdney (1992) reveal material
shocked by the interaction of the SNR with the adjacent molecular
cloud. The 2
detection of a large linewidth feature
 centered at 105
in
(1, 1) and (2, 2) might also
be a sign of interaction of the cloud with the SNR.
centered at 105
in
(1, 1) and (2, 2) might also
be a sign of interaction of the cloud with the SNR.
All IRDCs except those in the Cygnus-X region have a SNR in their
vicinity, although an association, which would require observations
with shock tracers, cannot be verified yet.
To estimate the chance occurance of an IRDC and SNR on the sky, we sample
17.6 square degrees in which (Green 2002) and
Brogan et al. (2004) have identified a total of 22 remnants. The likelihood
of a chance positional occurance within 7
of an IRDC is small (0.05) given a SNR surface density of 1.25 remnants per square degree. It is
very likely that the SNRs are physically associated with the IRDCs G11.11 and
G33.71-0.01.
5.5 IRDCs in the framework of an evolutionary sequence
![\begin{figure}
\par\includegraphics[height=13cm, angle=-0]{4128fig10.eps}
\end{figure}](/articles/aa/full/2006/17/aa4128-05/Timg131.gif) |
Figure 10:
Bottom panel: the correlation plot of kinetic temperature with the linewidths.
The black filled squares indicate the IRDCs and the grey unfilled
squares the cores from the
database. IRDCs have larger velocity
dispersions while the rotational temperatures are comparable.
Top panel: the correlation plot of
column density with
the linewidths shows that the average column density of IRDCs are
higher. |
| Open with DEXTER |
To obtain general statistics on IRDCs we compare in
Fig. 10 the core gas properties of our sample of 9 sources with the cores presented in the Jijina et al. (1999)
database. The database consists of 264 dense cores, with and without
associations with young stellar objects. For the large linewidths of
IRDCs (
 ), there is a distinct trend for the
IRDCs to be colder relative to the cores from the database. The
column density is also higher for the IRDCs, surpassed only by a few
high column densities from low mass cores observed with the high
angular resolution of the VLA, which evidently sees more of the core
interiors that are possibly associated with YSOs.
), there is a distinct trend for the
IRDCs to be colder relative to the cores from the database. The
column density is also higher for the IRDCs, surpassed only by a few
high column densities from low mass cores observed with the high
angular resolution of the VLA, which evidently sees more of the core
interiors that are possibly associated with YSOs.
![\begin{figure}
\par\includegraphics[height=13cm, angle=0]{4128fig11.eps}
\end{figure}](/articles/aa/full/2006/17/aa4128-05/Timg133.gif) |
Figure 11:
Bottom panel: the correlation plot of kinetic
temperature with the linewidth. The black filled squares indicate the
IRDCs,the crosses the sources from the Wood and Churchwell catalogue
and the unfilled squares Beuther et al. (2002) sources. IRDCs
are colder and on average have lower linewidths. Top
panel: the correlation plot of
column density with the linewidths. |
| Open with DEXTER |
In Fig. 11 we present a similar comparison with a
sample of UCH II regions from the Wood & Churchwell (1989)
catalogue and the sources from the Beuther et al. (2002) study
of high-mass protostellar objects (HMPOs).
While recent studies reveal that HMPOs are in a pre-UCH II region
phase (Molinari et al. 2002; Beuther et al. 2002),
the nature of the stage preceding HMPOs has not been studied in
detail. IRDCs are ideal candidates for this pre-HMPO stage. In
Fig. 11 we present properties of source samples
believed to cover the earliest phases of massive star formation based
on
observations. There is no clear trend in linewidths,
however IRDCs have a significantly lower average linewidth (
 )
than HMPOs (
)
than HMPOs (
 )
and UCH
II regions (
)
and UCH
II regions (
 ). There is a
distinct temperature trend from the low temperatures of the IRDCs
(
). There is a
distinct temperature trend from the low temperatures of the IRDCs
(
 K) to increasing temperatures
for the IRAS selected high-mass objects (
K) to increasing temperatures
for the IRAS selected high-mass objects (
 K) and high temperatures for the objects associated with
UCH II regions (
K) and high temperatures for the objects associated with
UCH II regions (
 K). Temperature and
linewidths must be understood as averages over the core and parts of
the envelope since the beam is 40
.
K). Temperature and
linewidths must be understood as averages over the core and parts of
the envelope since the beam is 40
.
There is no clear trend in column density. However, on average the
column densities of IRDCs are high compared to the other two samples.
We interpret the clear trend in temperature and the tentative
differences in
linewidths and column densities (N[NH3])
as possible manifestation of an evolutionary
sequence. Starless cores on the verge of star formation are expected
to be cold ( K), to have high column densities and smaller
linewidths. The temperature and the linewidth in a core will increase
after the formation of an embedded protostar (via radiative heating
and injection of turbulence through outflows and winds), while the
envelope will be dispersed via outflows and winds and thus column
densities will decrease with time.
K), to have high column densities and smaller
linewidths. The temperature and the linewidth in a core will increase
after the formation of an embedded protostar (via radiative heating
and injection of turbulence through outflows and winds), while the
envelope will be dispersed via outflows and winds and thus column
densities will decrease with time.
Table 4:
Mean values of
core samples.
One would expect the highest ammonia column densities for the hot
sources due to evaporation of ammonia from the grains although in some
cases IRDCs have higher column densities. However, this effect might
be very localised to the hot cores (0.1 pc and smaller) and not be
true for the larger scale emission. Additionally some molecular
material might already be dispersed in the hot sources by the
interaction of the young OB clusters with their environment.
In this paper, we discussed ammonia observations of a selected set of
IRDCs and the derived physical properties. Our results are as
summarised below.
The ammonia emission correlates very well with MIR absorption and
ammonia peaks distinctly coincide with dust continuum peaks. Several
cores are detected within the clouds with deconvolved sizes
smaller than the 40'' FWHM beam size. We can constrain the
average gas temperature to between 10 and 20 K.
We observe high linewidths (
 ),
hence turbulence plays an important role in the stability of an IRDC.
There are significant velocity gradients observed between the
cores. The effect of external shock/outflow tracers , on the gas
kinematics is suggestive in some cases, but needs to be investigated
further.
),
hence turbulence plays an important role in the stability of an IRDC.
There are significant velocity gradients observed between the
cores. The effect of external shock/outflow tracers , on the gas
kinematics is suggestive in some cases, but needs to be investigated
further.
The column densities translate to extremely high  values
(55-450 mag), therefore any active star formation would be heavily
embedded. The total cloud gas mass derived from the
data ranges from 103-104 .
The virial parameter is
1 for most of the clumps, and the cores appear to be stable
against gravitational collapse. As a result IRDCs are potential sites for
star formation. If we were to adopt the stellar IMF and a star formation
efficiency of 30%, then every IRDC
core could fragment to form >100 stars, with at least two high mass
stars (>8 ).
values
(55-450 mag), therefore any active star formation would be heavily
embedded. The total cloud gas mass derived from the
data ranges from 103-104 .
The virial parameter is
1 for most of the clumps, and the cores appear to be stable
against gravitational collapse. As a result IRDCs are potential sites for
star formation. If we were to adopt the stellar IMF and a star formation
efficiency of 30%, then every IRDC
core could fragment to form >100 stars, with at least two high mass
stars (>8 ).
The fractional abundance of
(relative to )
is
0.7-
 .
This, together with the excellent correlation in
morphology of the dust and gas, is consistent with the time dependent
chemical model for
of Bergin & Langer (1997) and implies
that
remains undepleted. The derived abundance is a factor 5-10 larger than that observed in local dark clouds while
is
underabundant by a factor of 50. Hence, the chemistry governing
these IRDCs might be complex and could be different from other parts of the
dense ISM.
.
This, together with the excellent correlation in
morphology of the dust and gas, is consistent with the time dependent
chemical model for
of Bergin & Langer (1997) and implies
that
remains undepleted. The derived abundance is a factor 5-10 larger than that observed in local dark clouds while
is
underabundant by a factor of 50. Hence, the chemistry governing
these IRDCs might be complex and could be different from other parts of the
dense ISM.
The time scales
we derive for the clouds to disperse due to their own internal motions
of a few Myrs provides an upper limit to the life time of these
clouds. We suggest that SNRs might be the trigerring mechanism
responsible for the formation of an IRDC.
The comparison of the physical properties from ammonia of our IRDCs
sample with other source samples - HMPO's and UCH IIs - strongly
suggests that most of these IRDCs are the most likely candidates for
pre-protostellar cores of massive star formation.
Acknowledgements
This research has made use of the NASA/ IPAC
Infrared Science Archive, which is operated by the Jet Propulsion
Laboratory, California Institute of Technology, under contract with
the National Aeronautics and Space Administration. S.J.Carey acknowledges
support from a NASA Long Term Space Astrophysics grant. T.Pillai was
supported for this research through a stipend from the International
Max Planck Research School (IMPRS) for Radio and Infrared Astronomy at
the University of Bonn. T.Pillai thanks her colleague J.Kauffmann for
useful discussions and comments on the manuscript.
-
Bachiller, R., Guilloteau, S., & Kahane, C. 1987, A&A, 173,
324 [NASA ADS] (In the text)
- Bergin, E. A. 2003, in
SFChem 2002: Chemistry as a Diagnostic of Star Formation, Proc. of
a conference held August 21-23, 2002 at University of Waterloo,
Waterloo, Ontario, Canada N2L 3G1, ed. C. L. Curry, & M. Fich
(Ottawa Canada: NRC Press), 63
(In the text)
- Bergin, E. A., & Langer,
W. D. 1997, ApJ, 486, 316 [NASA ADS] [CrossRef] (In the text)
- Bertoldi, F., & McKee,
C. F. 1992, ApJ, 395, 140 [NASA ADS] [CrossRef] (In the text)
- Beuther, H., Schilke, P., Menten,
K. M., et al. 2002, ApJ, 566, 945 [NASA ADS] [CrossRef] (In the text)
- Blitz, L., & Williams,
J. P. 1999, in The Origin of Stars and Planetary Systems, NATO
ASIC Proc., 540, 3
(In the text)
- Boss,
A. P. 1995, ApJ, 439, 224 [NASA ADS] [CrossRef] (In the text)
- Brogan,
C. L., Devine, K. E., Lazio, T. J., et al.
2004, AJ, 127, 355 [NASA ADS] [CrossRef] (In the text)
- Carey,
S. J., Clark, F. O., Egan, M. P., et al. 1998,
ApJ, 508, 721 [NASA ADS] [CrossRef] (In the text)
- Carey,
S. J., Feldman, P. A., Redman, R. O., et al.
2000, ApJ, 543, L157 [NASA ADS] [CrossRef] (In the text)
- Egan,
M. P., Shipman, R. F., Price, S. D., et al.
1998, ApJ, 494, L199 [NASA ADS] [CrossRef] (In the text)
- Evans,
N. J., Shirley, Y. L., Mueller, K. E., & Knez,
C. 2002, in ASP Conf. Ser. 267: Hot Star Workshop III: The Earliest
Phases of Massive Star Birth, 17
(In the text)
- Forveille, T., Guilloteau, S.,
& Lucas, R. 1989, Grenoble: IRAM
(In the text)
- Garay, G., Faúndez, S.,
Mardones, D., et al. 2004, ApJ, 610, 313 [NASA ADS] [CrossRef] (In the text)
- Green,
D. A. 1989, MNRAS, 238, 737 [NASA ADS] (In the text)
- Green, D. A. 2002, VizieR
Online Data Catalog, 7227, 0 (In the text)
-
Green, D. A., & Dewdney, P. E. 1992, MNRAS, 254,
686 [NASA ADS] (In the text)
- Hennebelle, P., Pérault, M.,
Teyssier, D., & Ganesh, S. 2001, A&A, 365, 598 [EDP Sciences] [NASA ADS] [CrossRef] (In the text)
- Ho,
P. T. P., & Townes, C. H. 1983, ARA&A, 21,
239 [NASA ADS] (In the text)
- Jijina, J., Myers, P. C.,
& Adams, F. C. 1999, ApJS, 125, 161 [NASA ADS] [CrossRef] (In the text)
- Johnstone, D., Fich, M., Mitchell,
G. F., & Moriarty-Schieven, G. 2001, ApJ, 559, 307 [NASA ADS] [CrossRef] (In the text)
-
Johnstone, D., Fiege, J. D., Redman, R. O., Feldman,
P. A., & Carey, S. J. 2003, ApJ, 588, L37 [NASA ADS] [CrossRef] (In the text)
-
Kuiper, T. B. H., Peters, W. L., Forster,
J. R., Gardner, F. F., & Whiteoak, J. B. 1995,
ApJ, 446, 692 [NASA ADS] [CrossRef] (In the text)
- Ladd, E. F., Myers,
P. C., & Goodman, A. A. 1994, ApJ, 433, 117 [NASA ADS] [CrossRef] (In the text)
- Lai, S.-P.,
Velusamy, T., Langer, W. D., & Kuiper, T. B. H.
2003, AJ, 126, 311 [NASA ADS] [CrossRef] (In the text)
- Launhardt, R. 1996,
Ph.D. Thesis
(In the text)
-
Launhardt, R., & Henning, T. 1997, A&A, 326, 329 [NASA ADS] (In the text)
- Menten,
K. M., Pillai, T., & Wyrowski, F. 2005, in IAU Symp.,
23
(In the text)
-
Molinari, S., Testi, L., Rodríguez, L. F., & Zhang,
Q. 2002, ApJ, 570, 758 [NASA ADS] [CrossRef] (In the text)
- Motte, F., Andre, P., & Neri,
R. 1998, A&A, 336, 150 [NASA ADS] (In the text)
- Ormel,
C. W., Shipman, R. F., Ossenkopf, V., & Helmich,
F. P. 2005, A&A, 439, 613 [EDP Sciences] [NASA ADS] [CrossRef] (In the text)
- Ossenkopf, V., & Henning,
T. 1994, A&A, 291, 943 [NASA ADS] (In the text)
- Ott,
M., Witzel, A., Quirrenbach, A., et al. 1994, A&A, 284,
331 [NASA ADS] (In the text)
-
Perault, M., Omont, A., Simon, G., et al. 1996, A&A, 315,
L165 [NASA ADS] (In the text)
-
Pillai, T., Wyrowski, F., Menten, K. M., & Krügel, E.
2005, ArXiv Astrophysics e-prints
(In the text)
- Rathborne, J. M.,
Jackson, J. M., Chambers, E. T., et al. 2005, ArXiv
Astrophysics e-prints
(In the text)
- Redman,
R. O., Feldman, P. A., Wyrowski, F., et al. 2003,
ApJ, 586, 1127 [NASA ADS] [CrossRef] (In the text)
- Tafalla, M., Myers,
P. C., Caselli, P., & Walmsley, C. M. 2004, A&A,
416, 191 [EDP Sciences] [NASA ADS] [CrossRef] (In the text)
- Tan, J. C. 2005, ArXiv
Astrophysics e-prints
(In the text)
-
Testi, L., & Sargent, A. I. 1998, ApJ, 508, L91 [NASA ADS] [CrossRef] (In the text)
-
Teyssier, D., Hennebelle, P., & Pérault, M. 2002, A&A,
382, 624 [EDP Sciences] [NASA ADS] [CrossRef] (In the text)
- Wood,
D. O. S., & Churchwell, E. 1989, ApJS, 69, 831 [NASA ADS] [CrossRef] (In the text)
Copyright ESO 2006
![\begin{figure}
\par\includegraphics[height=18cm]{4128fig1.eps}
\end{figure}](/articles/aa/full/2006/17/aa4128-05/img34.gif)
![\begin{figure}
\par\includegraphics[width=18cm,clip]{4128fig2.eps}
\end{figure}](/articles/aa/full/2006/17/aa4128-05/img35.gif)
![\begin{figure}
\par\includegraphics[height=8.8cm, angle=-90]{4128fig3.eps}
\par\end{figure}](/articles/aa/full/2006/17/aa4128-05/img50.gif)
![\begin{figure}
\par\includegraphics[height=8.8cm, angle=-90]{4128fig4.eps}
\end{figure}](/articles/aa/full/2006/17/aa4128-05/img51.gif)
![\begin{figure}
\par\includegraphics[height=10.5cm, angle=0]{4128fig5.eps}
\par\end{figure}](/articles/aa/full/2006/17/aa4128-05/img64.gif)
![\begin{figure}
\par\includegraphics[height=8.8cm, angle=-90]{4128fig6.eps}
\end{figure}](/articles/aa/full/2006/17/aa4128-05/img71.gif)
![\begin{figure}
\par\includegraphics[angle=-90,width=16cm,clip]{4128fig7.eps}
\end{figure}](/articles/aa/full/2006/17/aa4128-05/img84.gif)
![\begin{figure}
\par\includegraphics[angle=-90,width=16cm,clip]{4128fig8.eps}
\end{figure}](/articles/aa/full/2006/17/aa4128-05/img85.gif)
![\begin{figure}
\par\includegraphics[width=17cm,clip]{4128fig9.eps}
\end{figure}](/articles/aa/full/2006/17/aa4128-05/img108.gif)
![\begin{figure}
\par\includegraphics[height=13cm, angle=-0]{4128fig10.eps}
\end{figure}](/articles/aa/full/2006/17/aa4128-05/img131.gif)
![\begin{figure}
\par\includegraphics[height=13cm, angle=0]{4128fig11.eps}
\end{figure}](/articles/aa/full/2006/17/aa4128-05/img133.gif)