![\begin{figure}
\par\mbox{\includegraphics[width=8cm]{4089fi1a.ps} \includegraphi...
...idth=8cm]{4089fi1e.ps} \includegraphics[width=8cm]{4089fi1f.ps} }
\end{figure}](/articles/aa/full/2006/17/aa4089-05/img37.gif) |
Figure 1:
Comparison of temperature ( top), density
( middle), and
ionization fraction ( bottom) plots of the old model i ( left)
and model i |
| Open with DEXTER | |
In the text
![\begin{figure}
\par\mbox{\includegraphics[width=8cm]{4089fi2a.ps} \includegraphi...
...idth=8cm]{4089fi2g.ps} \includegraphics[width=8cm]{4089fi2h.ps} }
\end{figure}](/articles/aa/full/2006/17/aa4089-05/img38.gif) |
Figure 2:
|
| Open with DEXTER | |
In the text
![\begin{figure}
\par\mbox{\includegraphics[width=8cm]{4089fi3a.ps} \includegraphi...
...idth=8cm]{4089fi3g.ps} \includegraphics[width=8cm]{4089fi3h.ps} }
\end{figure}](/articles/aa/full/2006/17/aa4089-05/img40.gif) |
Figure 3:
As Fig. 2, continued. The radiative cooling lowers the
temperature of the region of higher densities. Superposed on it, the whole
feature moves towards lower densities and lower temperatures, consistent
with adiabatic expansion. The slope of the path is approximately
|
| Open with DEXTER | |
In the text
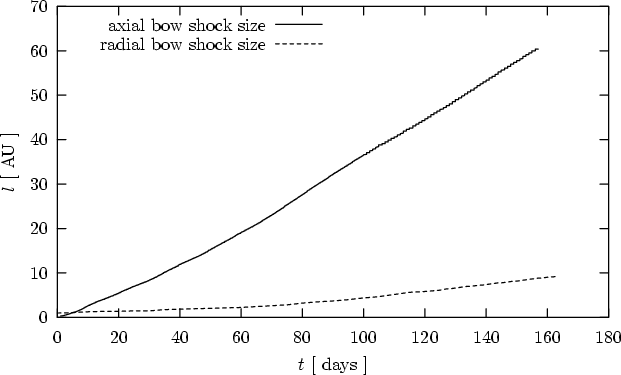 |
Figure 4:
Size of the bow-shock in axial and radial direction for model i |
| Open with DEXTER | |
In the text
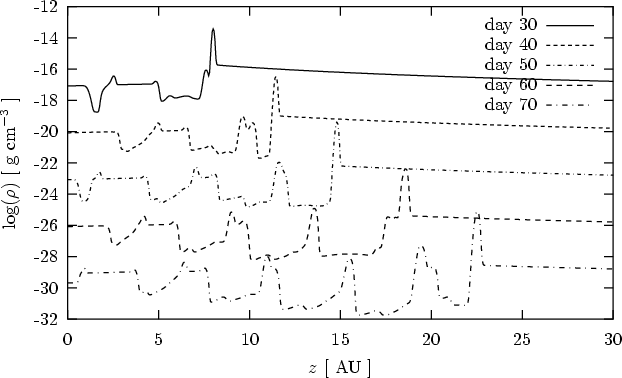 |
Figure 5:
Slices of density along the jet axis for model i |
| Open with DEXTER | |
In the text
![\begin{figure}
\mbox{\includegraphics[width=8cm]{4089fi6a.ps} \includegraphics[...
...idth=8cm]{4089fi6e.ps} \includegraphics[width=8cm]{4089fi6f.ps} }
\end{figure}](/articles/aa/full/2006/17/aa4089-05/img56.gif) |
Figure 6:
Logarithm of density for model i |
| Open with DEXTER | |
In the text
![\begin{figure}
\mbox{ \includegraphics[width=8cm]{4089fi7a.ps} \includegraphics...
...idth=8cm]{4089fi7k.ps} \includegraphics[width=8cm]{4089fi7l.ps} }
\end{figure}](/articles/aa/full/2006/17/aa4089-05/img57.gif) |
Figure 7:
Radiative properties of model i |
| Open with DEXTER | |
In the text
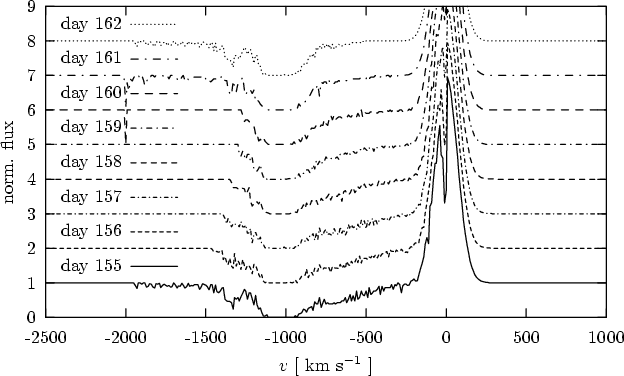 |
Figure 8:
Sequence of absorption line profiles for eight consecutive days
for model i |
| Open with DEXTER | |
In the text
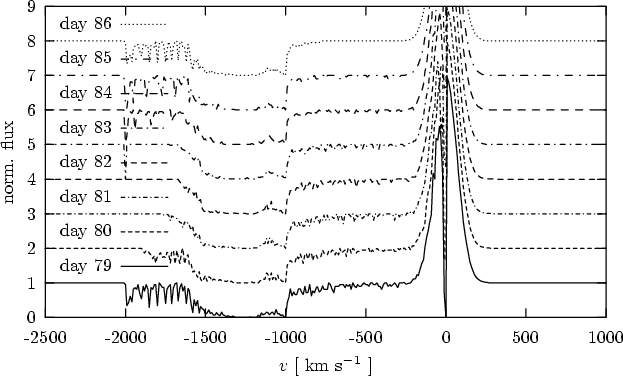 |
Figure 9:
Sequence of absorption line profiles for eight consecutive days of
model iv |
| Open with DEXTER | |
In the text