We assessed the contribution to the X-ray (above 2 keV) luminosity of the Milky Way by different classes of low-mass binary systems and single stars. We began by using the RXTE Slew Survey of the sky at
A&A 450, 117-128 (2006)
DOI: 10.1051/0004-6361:20054297
S. Sazonov1,2 - M. Revnivtsev1,2 - M. Gilfanov1,2 - E. Churazov 1,2 - R. Sunyaev1,2
1 - Max-Planck-Institut für Astrophysik,
Karl-Schwarzschild-Str. 1, 85740 Garching bei München,
Germany
2 -
Space Research Institute, Russian Academy of Sciences,
Profsoyuznaya 84/32, 117997 Moscow, Russia
Received 3 October 2005 / Accepted 15 December 2005
Abstract
We assessed the contribution to the X-ray (above 2 keV) luminosity
of the Milky Way by different classes of low-mass binary systems and
single stars. We began by using the RXTE Slew Survey of the sky at
![]() to construct an X-ray luminosity function (XLF) of
nearby X-ray sources in the range
to construct an X-ray luminosity function (XLF) of
nearby X-ray sources in the range
![]() (where
(where ![]() is the
luminosity over 2-10 keV), occupied by coronally active binaries
(ABs) and cataclysmic variables (CVs). We then extended this XLF down to
is the
luminosity over 2-10 keV), occupied by coronally active binaries
(ABs) and cataclysmic variables (CVs). We then extended this XLF down to
![]() using the Rosat All-Sky
Survey in soft X-rays and available information on the 0.1-10 keV
spectra of typical sources. We found that the local cumulative X-ray
(2-10 keV) emissivities (per unit stellar mass) of ABs and CVs are
using the Rosat All-Sky
Survey in soft X-rays and available information on the 0.1-10 keV
spectra of typical sources. We found that the local cumulative X-ray
(2-10 keV) emissivities (per unit stellar mass) of ABs and CVs are
![]()
![]() 1027 and
1027 and
![]()
![]() 1027 erg s-1
1027 erg s-1
![]() ,
respectively. In addition to ABs and CVs representing old stellar populations, young stars locally emit
,
respectively. In addition to ABs and CVs representing old stellar populations, young stars locally emit
![]()
![]() 1027 erg s
1027 erg s
![]() .
Finally to the XLF
of ABs and CVs we attached a high luminosity branch (up to
.
Finally to the XLF
of ABs and CVs we attached a high luminosity branch (up to ![]() 1039 erg s-1) composed of neutron-star and black-hole low-mass X-ray binaries (LMXBs), derived in previous work. The
combined XLF covers
1039 erg s-1) composed of neutron-star and black-hole low-mass X-ray binaries (LMXBs), derived in previous work. The
combined XLF covers ![]() 12 orders of magnitude in luminosity. The
estimated combined contribution of ABs and CVs to the 2-10 keV
luminosity of the Milky Way is
12 orders of magnitude in luminosity. The
estimated combined contribution of ABs and CVs to the 2-10 keV
luminosity of the Milky Way is ![]() 2
2 ![]() 1038 erg s-1,
or
1038 erg s-1,
or ![]() 3% of the integral luminosity of LMXBs averaged over nearby
galaxies. The XLF obtained in this work is used elsewhere to assess
the contribution of point sources to the Galactic ridge X-ray emission.
3% of the integral luminosity of LMXBs averaged over nearby
galaxies. The XLF obtained in this work is used elsewhere to assess
the contribution of point sources to the Galactic ridge X-ray emission.
Key words: stars: luminosity function, mass function - Galaxy: structure - X-rays: binaries - X-rays: galaxies - X-rays: stars
X-ray (above 2 keV) emission is a ubiquitous property of different classes of low-mass close binaries, ranging in order of increasing luminosity from chromospherically and coronally active binaries (ABs) through cataclysmic variables (CVs, magnetic and non-magnetic) and related white-dwarf accretors (symbiotic stars) to neutron-star and black-hole binaries (LMXBs). Although each of these classes has been thoroughly investigated for decades, there remains significant uncertainty as regards the contribution of ABs and CVs, both cumulative and as a function of luminosity, to the integral X-ray luminosity of the Galaxy. On the other hand, the luminosity function (XLF) of LMXBs has been measured with good precision for the Milky Way and nearby galaxies (Gilfanov 2004; Grimm et al. 2002).
There are several important astrophysical problems urging a detailed study of the XLF of ABs and CVs. First, there is the long-standing puzzle of the origin of the Galactic ridge X-ray
emission (e.g. Warwick et al. 1985; Worrall et al. 1982). Although there were early
suggestions that this apparently diffuse X-ray emission might be
composed of thousands and millions of CVs and ABs
(Ottmann & Schmitt 1992; Mukai & Shiokawa 1993; Worrall & Marshall 1983), recent deep surveys by Chandra and XMM-Newton
in the Galactic plane and in the Galactic center region resolved only
![]() 10-30% of the ridge emission (above 2 keV) into point sources
(Hands et al. 2004; Muno et al. 2004; Ebisawa et al. 2005), leaving the question open as to what
fraction of the unresolved emission is truly diffuse.
10-30% of the ridge emission (above 2 keV) into point sources
(Hands et al. 2004; Muno et al. 2004; Ebisawa et al. 2005), leaving the question open as to what
fraction of the unresolved emission is truly diffuse.
Secondly, with the advent of Chandra it has become possible to
obtain high-quality X-ray maps of nearby elliptical galaxies and
resolve individual LMXBs on them. The underlying diffuse
emission is usually attributed to the hot (![]() 0.5 keV)
interstellar gas. However, in gas-poor galaxies
unresolved point X-ray sources associated with the old stellar
population may contribute significantly to or even dominate the
apparently diffuse emission, especially at high energies
(e.g. Irwin et al. 2003; Canizares et al. 1987; Matsumoto et al. 1997). The interpretation of the X-ray
observations of gas-poor ellipticals thus critically depends on our
knowledge of the XLF of low-mass binaries in these galaxies, which is
expected to resemble the XLF of ABs, CVs, and LMXBs in our Galaxy
scaled by the stellar mass.
0.5 keV)
interstellar gas. However, in gas-poor galaxies
unresolved point X-ray sources associated with the old stellar
population may contribute significantly to or even dominate the
apparently diffuse emission, especially at high energies
(e.g. Irwin et al. 2003; Canizares et al. 1987; Matsumoto et al. 1997). The interpretation of the X-ray
observations of gas-poor ellipticals thus critically depends on our
knowledge of the XLF of low-mass binaries in these galaxies, which is
expected to resemble the XLF of ABs, CVs, and LMXBs in our Galaxy
scaled by the stellar mass.
With the above motivation in mind, we constructed a combined XLF
of ABs, CVs, and LMXBs covering the very broad luminosity range from
![]() to
to ![]() 1039 erg s-1, where
1039 erg s-1, where ![]() is the
luminosity in the 2-10 keV band. Since these classes of objects
represent old stellar populations (in particular ABs maintain high
levels of activity throughout their lives due to tidal locking of rapid
stellar rotation), their XLF normalized to the stellar mass is not
expected to vary significantly across the Galaxy and also between
different types of galaxies. This has already been observationally
demonstrated for LMXBs (Gilfanov 2004). In contrast, the statistics of
young coronal stars (YSs), another abundant class
of low-luminosity X-ray sources (see Güdel 2004, for a review), is
expected to be governed by local star formation history, so that an XLF
constructed for this class of sources in the solar neighborhood may
not be representative of other parts of the Galaxy and other
galaxies. It will be shown below that YSs produce
is the
luminosity in the 2-10 keV band. Since these classes of objects
represent old stellar populations (in particular ABs maintain high
levels of activity throughout their lives due to tidal locking of rapid
stellar rotation), their XLF normalized to the stellar mass is not
expected to vary significantly across the Galaxy and also between
different types of galaxies. This has already been observationally
demonstrated for LMXBs (Gilfanov 2004). In contrast, the statistics of
young coronal stars (YSs), another abundant class
of low-luminosity X-ray sources (see Güdel 2004, for a review), is
expected to be governed by local star formation history, so that an XLF
constructed for this class of sources in the solar neighborhood may
not be representative of other parts of the Galaxy and other
galaxies. It will be shown below that YSs produce ![]() 30% of the
integral 2-10 keV emissivity in the solar neighborhood.
30% of the
integral 2-10 keV emissivity in the solar neighborhood.
Our assessment of source space densities at ![]() < 1034 erg s-1is based on the RXTE Slew Survey (Revnivtsev et al. 2004, hereafter R04) and
Rosat All-Sky Survey
(http://www.xray.mpe.mpg.de/cgi-bin/rosat/rosat-survey;
Voges et al. 1999). In the latter case we also employed spectral
information from various X-ray missions to convert the derived XLF
from a soft X-ray band to the standard X-ray band. The high-luminosity
(
< 1034 erg s-1is based on the RXTE Slew Survey (Revnivtsev et al. 2004, hereafter R04) and
Rosat All-Sky Survey
(http://www.xray.mpe.mpg.de/cgi-bin/rosat/rosat-survey;
Voges et al. 1999). In the latter case we also employed spectral
information from various X-ray missions to convert the derived XLF
from a soft X-ray band to the standard X-ray band. The high-luminosity
(
![]() erg s-1) branch of the XLF is adopted from
previous work of Gilfanov (2004).
erg s-1) branch of the XLF is adopted from
previous work of Gilfanov (2004).
Recently, a serendipitous survey of the whole sky in the
3-20 keV energy band was performed based on slew observations with
the PCA instrument on the RXTE spacecraft (RXTE Slew Survey, or XSS),
and a source catalog at high Galactic latitude (
![]() )
was
produced (R04). The survey achieved a flux limit of 2.5
)
was
produced (R04). The survey achieved a flux limit of 2.5 ![]() 10-11 erg cm-2 s-1 (3-20 keV) or better for 90% of the
10-11 erg cm-2 s-1 (3-20 keV) or better for 90% of the
![]() sky.
sky.
The majority of the 294 detected XSS sources have been identified with
extragalactic objects, 60 sources have been identified with objects in
the Galaxy, while 21 sources still remain unidentified. The identified
Galactic sample includes 14 LMXBs and HMXBs, which were not considered
in this study. We also excluded from consideration: 4 star forming complexes with multiple X-ray sources as unresolvable by RXTE (Orion, Chamaeleon 1, Chamaeleon 2, and ![]() Ophiuchi), the hot
supergiant star
Ophiuchi), the hot
supergiant star ![]() Ori as also belonging to the Orion complex,
the unresolved globular cluster NGC 6397, and supernova remnant SN 1006
as an extended X-ray source. This left us with a total of 40 identified ABs (including 2 candidates, see below) and CVs. Of these we additionally excluded 10 sources for either of the following reasons: 1) the source is not detectable on the average XSS map and was originally included in the XSS catalog based on its transient detection, 2) the source was the target of pointed RXTE observations and would not have been detected in slew observations otherwise.
Ori as also belonging to the Orion complex,
the unresolved globular cluster NGC 6397, and supernova remnant SN 1006
as an extended X-ray source. This left us with a total of 40 identified ABs (including 2 candidates, see below) and CVs. Of these we additionally excluded 10 sources for either of the following reasons: 1) the source is not detectable on the average XSS map and was originally included in the XSS catalog based on its transient detection, 2) the source was the target of pointed RXTE observations and would not have been detected in slew observations otherwise.
Table 1: XSS sources identified with ABs and CVs.
We thus obtained a sample (see Table 1) of 30 ABs and CVs
detected with ![]()
![]() significance on the average XSS sky map
(3-20 keV). This sample is well suited for statistical studies.
significance on the average XSS sky map
(3-20 keV). This sample is well suited for statistical studies.
For each source, the XSS catalog provides RXTE/PCA count rates in
the 3-8 keV and 8-20 keV bands. We found published distances
to all sources except for the intermediate polar V1025 Cen (for which
we assumed a distance of 400 pc, a value typical of the intermediate
polars in our sample), the polar CD Ind (for which we used the
available lower limit) and the source XSS J17309-0552 discussed
below. Parallax measurements, in many cases adopted
directly from the Hipparcos or Tycho catalog, were used wherever
available. For XSS J17309-0552/RXS J173021.5-055933, a recently discovered intermediate polar (Gänsicke et al. 2005), we estimated the distance using available information about the secondary star
(Gänsicke et al. 2005). Specifically, this GV star contributes ![]() 15% to the R-band flux of the binary. Given the system's visual magnitude (RV=15.4) and interstellar extinction
toward it [
15% to the R-band flux of the binary. Given the system's visual magnitude (RV=15.4) and interstellar extinction
toward it [
![]() ], and assuming that the secondary is on
the main sequence, one finds a distance
], and assuming that the secondary is on
the main sequence, one finds a distance ![]() 2300-3100 pc. However,
the very long orbital period of the binary (15.4 h) implies that
the Roche-lobe filling secondary is evolved
(e.g. Smith & Dhillon 1998). This yields a more likely distance of
2300-3100 pc. However,
the very long orbital period of the binary (15.4 h) implies that
the Roche-lobe filling secondary is evolved
(e.g. Smith & Dhillon 1998). This yields a more likely distance of ![]() 3300 pc, which we adopted.
3300 pc, which we adopted.
Using the distance estimates and measured source count
rates in the 3-8 keV and 3-20 keV bands, we determined source
luminosities in the 2-10 keV (![]() )
and 3-20 keV (
)
and 3-20 keV (![]() ) bands,
respectively. A Crab-like spectrum was assumed for this calculation,
which is expected to ensure reasonable accuracy of energy flux
estimation for our sources, given their measured hardness
ratios (8-20 keV counts over 3-8 keV counts). We note that the quoted
luminosities are observed ones, i.e. they were not corrected for any
absorption intrinsic to the sources. The interstellar absorption toward our
(high Galactic latitude) sources is not expected to have a significant
effect on the RXTE measured fluxes. This is true even in the case
of XY Ari, the only source in our sample known to be located behind a molecular
cloud, for which we estimated a line-of-sight absorption of
) bands,
respectively. A Crab-like spectrum was assumed for this calculation,
which is expected to ensure reasonable accuracy of energy flux
estimation for our sources, given their measured hardness
ratios (8-20 keV counts over 3-8 keV counts). We note that the quoted
luminosities are observed ones, i.e. they were not corrected for any
absorption intrinsic to the sources. The interstellar absorption toward our
(high Galactic latitude) sources is not expected to have a significant
effect on the RXTE measured fluxes. This is true even in the case
of XY Ari, the only source in our sample known to be located behind a molecular
cloud, for which we estimated a line-of-sight absorption of
![]()
![]() 1022 cm-2 from the measured visual
extinction
1022 cm-2 from the measured visual
extinction
![]() (Littlefair et al. 2001). Similarly the
uncertainty in source distances is unlikely to significantly affect
the statistical results presented below.
(Littlefair et al. 2001). Similarly the
uncertainty in source distances is unlikely to significantly affect
the statistical results presented below.
Our XSS sample includes 6 known or suspected ABs and 24 known CVs. Among the former there are 3 RS CVn binaries, the prototype Algol system (![]() Per), and 2 late-type main-sequence
stars (HD 125599 and HD 130693) that we consider candidate ABs based on
their optical spectral class, X-ray luminosities, and relative X-ray
softness compared to CVs. The CV subsample includes 4 non-magnetic CVs
(dwarf novae), 19 magnetic CVs (6 polars and 13 intermediate polars)
and 1 symbiotic star.
Per), and 2 late-type main-sequence
stars (HD 125599 and HD 130693) that we consider candidate ABs based on
their optical spectral class, X-ray luminosities, and relative X-ray
softness compared to CVs. The CV subsample includes 4 non-magnetic CVs
(dwarf novae), 19 magnetic CVs (6 polars and 13 intermediate polars)
and 1 symbiotic star.
In Fig. 1 we plot the XSS hardness ratio as a function of luminosity for our identified sample. One can see that, as expected, the ABs have softer spectra than do the CVs. As regards the latter, the intermediate polars and the only symbiotic star in our sample tend to have somewhat harder spectra than the polars and dwarf novae.
Despite the relatively small size of our sample, it can be used to
construct an XLF, since it covers 4 orders of magnitude in
luminosity (from ![]() 1030 to
1030 to ![]() 1034 erg s-1) and is derived
from a flux-limited survey with a direction-dependent sensitivity
limit. As usual for such surveys, one can readily estimate the space
density of sources in a given luminosity interval using the
1034 erg s-1) and is derived
from a flux-limited survey with a direction-dependent sensitivity
limit. As usual for such surveys, one can readily estimate the space
density of sources in a given luminosity interval using the
![]() method (Schmidt 1968). To this end, we used the XSS exposure map presented in R04, which yields the space volume probed by the survey for a given source luminosity.
method (Schmidt 1968). To this end, we used the XSS exposure map presented in R04, which yields the space volume probed by the survey for a given source luminosity.
To take into account the fact that the studied classes of sources
are concentrated toward the Galactic plane, we assumed that the space
density of ABs and CVs declines with height as
![]() ,
where
h=150 pc. This adopted scale height is appropriate for the CVs
(e.g. Patterson 1984), while the inferred space density of ABs is only
weakly sensitive to the assumed value of h, since ABs are detectable
within
,
where
h=150 pc. This adopted scale height is appropriate for the CVs
(e.g. Patterson 1984), while the inferred space density of ABs is only
weakly sensitive to the assumed value of h, since ABs are detectable
within ![]() 100 pc of the Sun in the XSS. Note that the
Galactocentric dependence is not important for us since our studied
objects are located within
100 pc of the Sun in the XSS. Note that the
Galactocentric dependence is not important for us since our studied
objects are located within ![]() 1 kpc of the Sun. We therefore weighted the
standard
1 kpc of the Sun. We therefore weighted the
standard
![]() volume found for each small solid angle
volume found for each small solid angle
![]() (at Galactic latitude b) of the survey by the space density of sources integrated over
(at Galactic latitude b) of the survey by the space density of sources integrated over
![]() and over
distance from 0 to
and over
distance from 0 to
![]() ,
the maximum distance at which a given XSS source is detectable (Tinney et al. 1993; Schwope et al. 2002):
,
the maximum distance at which a given XSS source is detectable (Tinney et al. 1993; Schwope et al. 2002):
![\begin{displaymath}%
\delta V_{{\rm gen}}=\delta\Omega\frac{h^3}
{\sin^3 b}\left[2-\left(\xi^2+2\xi+2\right){\rm e}^{-\xi}\right],
\end{displaymath}](/articles/aa/full/2006/16/aa4297-05/img63.gif) |
(1) |
![\begin{figure}
\par\includegraphics[width=7.8cm,clip]{4297fig1.ps}\end{figure}](/articles/aa/full/2006/16/aa4297-05/img67.gif) |
Figure 1: The RXTE/PCA hardness ratio vs. 3-20 keV luminosity for XSS sources identified with ABs and CVs: open stars - ABs, filled circles - dwarf novae, filled squares - polars, open squares - intermediate polars, the cross - a symbiotic star. |
| Open with DEXTER | |
We show in Fig. 2 the resulting differential XLF of ABs and CVs in the 3-20 keV energy band, covering the luminosity range 1030-1034 erg s-1. This XLF was normalized to the local stellar mass density, assumed to be
![]() pc-3 throughout the
paper (Jahreiß & Wielen 1997; Robin et al. 2003). The values of
pc-3 throughout the
paper (Jahreiß & Wielen 1997; Robin et al. 2003). The values of
![]() for individual XSS sources are given in Table 1. Note that we excluded the intermediate polar XSS J17309-0552/RXS J173021.5-055933 from the XLF construction since its inferred X-ray
luminosity exceeds 1034 erg s-1, making it the only
source with such high luminosity in our sample.
for individual XSS sources are given in Table 1. Note that we excluded the intermediate polar XSS J17309-0552/RXS J173021.5-055933 from the XLF construction since its inferred X-ray
luminosity exceeds 1034 erg s-1, making it the only
source with such high luminosity in our sample.
![\begin{figure}
\par\includegraphics[width=8.25cm,clip]{4297fig2.ps}\end{figure}](/articles/aa/full/2006/16/aa4297-05/img69.gif) |
Figure 2: Differential 3-20 keV luminosity function of ABs and CVs derived from the XSS. Solid, dotted, and dashed histograms and error bars show the XLFs for the whole, northern, and southern sky, respectively. The northern and southern XLFs are slightly shifted along the luminosity axis for better visibility. |
| Open with DEXTER | |
It is necessary to check whether the derived XLF suffers from incompleteness
of the input sample. There are in fact 18 unidentified XSS sources![]() -
see Table 2. Although, we suspect (see R04) that
most of these sources are active galactic nuclei, this has not yet
been verified and therefore we must take this additional sample into account.
-
see Table 2. Although, we suspect (see R04) that
most of these sources are active galactic nuclei, this has not yet
been verified and therefore we must take this additional sample into account.
Table 2: Unidentified XSS sources.
We expect our identified sample to be highly complete at
![]() erg s-1 with respect to ABs and other types of coronal
stars for the following reasons. First, it is very unlikely that more
than
erg s-1 with respect to ABs and other types of coronal
stars for the following reasons. First, it is very unlikely that more
than ![]() 1-2 of the 13 unidentified XSS sources (see
Table 2) for which there is no obvious bright
counterpart in the Rosat All-Sky Survey (RASS) are ABs or YSs, because
coronal X-ray sources are relatively soft. To illustrate this point we
plot in Fig. 3 the ratio of the ROSAT/PSPC count rate
(0.1-2.4 keV) to the RXTE/PCA count rate (3-20 keV) as a function of
the latter for our identified and unidentified sources. For the 13 XSS sources without a firm RASS counterpart, an upper limit is shown that was derived from the ROSAT/PSPC count rate of the
brightest RASS source within the XSS localization region (typically
0.5-1
1-2 of the 13 unidentified XSS sources (see
Table 2) for which there is no obvious bright
counterpart in the Rosat All-Sky Survey (RASS) are ABs or YSs, because
coronal X-ray sources are relatively soft. To illustrate this point we
plot in Fig. 3 the ratio of the ROSAT/PSPC count rate
(0.1-2.4 keV) to the RXTE/PCA count rate (3-20 keV) as a function of
the latter for our identified and unidentified sources. For the 13 XSS sources without a firm RASS counterpart, an upper limit is shown that was derived from the ROSAT/PSPC count rate of the
brightest RASS source within the XSS localization region (typically
0.5-1![]() in radius, R04). The unidentified XSS sources without a bright RASS counterpart are apparently hard X-ray sources compared to the identified ABs. It is important to note that the
presented XSS source fluxes are averages over multiple RXTE/PCA observations separated by up to several years, hence it can be expected that these fluxes are not strongly biased by individual X-ray flares relative to the level of source persistent activity.
in radius, R04). The unidentified XSS sources without a bright RASS counterpart are apparently hard X-ray sources compared to the identified ABs. It is important to note that the
presented XSS source fluxes are averages over multiple RXTE/PCA observations separated by up to several years, hence it can be expected that these fluxes are not strongly biased by individual X-ray flares relative to the level of source persistent activity.
![\begin{figure}
\par\includegraphics[width=8cm,clip]{4297fig3.ps}\end{figure}](/articles/aa/full/2006/16/aa4297-05/img91.gif) |
Figure 3: Ratio of the ROSAT/PSPC count rate (0.1-2.4 keV) to the RXTE/PCA count rate (3-20 keV) for the identified and unidentified XSS sources. Identified sources of different classes are denoted by the same symbols as in Fig. 1, and unidentified sources are shown by empty circles. The ROSAT count rates and upper limits are adopted from the RASS Bright Source Catalog (Voges et al. 1999) and RASS Faint Source Catalog, except for V1062 Tau where we used pointed ROSAT/PSPC observations. The source XY Ari is not shown since its observed soft X-ray flux is strongly diminished by absorption in an intervening molecular cloud (Littlefair et al. 2001). |
| Open with DEXTER | |
Secondly, for the 5 unidentified XSS sources reliably associated with
an RASS source (see Table 2), one can search for a bright
star inside the ROSAT localization region, typically less than
30 arcsec in radius. A source with a 3-20 keV luminosity of
1030-1031.5 erg s-1 (the higher value is quite extreme
for coronal sources) would typically be detectable in the XSS out to
![]() 20-100 pc. Stars exhibiting such high levels
of coronal activity are rapidly rotating (usually in short-period binaries)
main-sequence or evolved late-type stars, with
20-100 pc. Stars exhibiting such high levels
of coronal activity are rapidly rotating (usually in short-period binaries)
main-sequence or evolved late-type stars, with ![]() (see
e.g. Singh et al. 1996; Makarov 2003). Therefore, if any of the unidentified XSS sources were a high luminosity coronal source, we would expect to find a star that is brighter than
(see
e.g. Singh et al. 1996; Makarov 2003). Therefore, if any of the unidentified XSS sources were a high luminosity coronal source, we would expect to find a star that is brighter than ![]() in the ROSAT localization region. Searches in the Hipparcos and Tycho catalogs revealed only one
such bright star, a possible counterpart to XSS J17223-7301/1RXS J171850.0-732527 (see Table 2). Should this association be confirmed, it will not significantly change our
estimate of the space density of ABs. Figure 4
illustrates the above argument by showing the R-band visual
magnitudes (or lower limits) vs. the RXTE/PCA count rate for identifed
XSS sources and for the 5 unidentified XSS sources with an RASS counterpart. One can see that the optical counterparts of the unidentified XSS sources (except for XSS J17223-7301 mentioned
above) are much dimmer than expected for coronal sources.
in the ROSAT localization region. Searches in the Hipparcos and Tycho catalogs revealed only one
such bright star, a possible counterpart to XSS J17223-7301/1RXS J171850.0-732527 (see Table 2). Should this association be confirmed, it will not significantly change our
estimate of the space density of ABs. Figure 4
illustrates the above argument by showing the R-band visual
magnitudes (or lower limits) vs. the RXTE/PCA count rate for identifed
XSS sources and for the 5 unidentified XSS sources with an RASS counterpart. One can see that the optical counterparts of the unidentified XSS sources (except for XSS J17223-7301 mentioned
above) are much dimmer than expected for coronal sources.
![\begin{figure}
\par\includegraphics[width=8cm,clip]{4297fig4.ps}\end{figure}](/articles/aa/full/2006/16/aa4297-05/img94.gif) |
Figure 4: The R-band visual magnitude vs. RXTE/PCA count rate for the identified XSS sources and 5 unidentified XSS sources with a firm RASS counterpart. Identified sources of different classes are denoted by the same symbols as in Fig. 1, unidentified sources are shown by empty circles, R magnitudes and lower limits are adopted from the USNO-B1.0 Catalog. The XSS source XY Ari is not shown since its optical spectrum is strongly reddened by absorption within a molecular cloud (Littlefair et al. 2001). |
| Open with DEXTER | |
On the other hand, since CVs can be undetectable in the RASS due to
their hard spectra (see Fig. 3) and can also be
inconspicuous optically (see Fig. 4), it is possible
that some of the unidentified XSS sources belong to this class. There
is an additional possibility of testing the XLF obtained. Our identified
sample is highly complete in the northern hemisphere: there are 16 identified and 2 unidentified sources at ![]() .
This
contrasts with the southern hemisphere, where there are 13 (excluding
the high-luminosity XSS J17309-0552/RXS J173021.5-055933)
identified vs. 16 unidentified sources. It is therefore
worth comparing XLFs determined from the northern and southern
subsamples. As shown in Fig. 2, the resulting XLFs
agree with each other and with the all-sky XLF within the
uncertainties, although there is a hint that the southern sample of CVs may be somewhat incomplete.
.
This
contrasts with the southern hemisphere, where there are 13 (excluding
the high-luminosity XSS J17309-0552/RXS J173021.5-055933)
identified vs. 16 unidentified sources. It is therefore
worth comparing XLFs determined from the northern and southern
subsamples. As shown in Fig. 2, the resulting XLFs
agree with each other and with the all-sky XLF within the
uncertainties, although there is a hint that the southern sample of CVs may be somewhat incomplete.
We conclude that we may be underestimating the combined XLF
of ABs and CVs at
![]() erg s-1, since
several unidentified CVs may remain in the XSS catalog. The associated
systematic uncertainty is unlikely to exceed 50% though.
erg s-1, since
several unidentified CVs may remain in the XSS catalog. The associated
systematic uncertainty is unlikely to exceed 50% though.
Table 3: Space densities of soft X-ray active stars derived from the RASS.
The weakest X-ray source (a candidate AB) in the XSS sample has a luminosity
![]() erg s-1 in the 2-10 keV band. To
extend our study to
erg s-1 in the 2-10 keV band. To
extend our study to
![]() erg s-1, a large-area
survey is necessary that is more sensitive than the XSS and has highly complete
source identification. Since no such survey has been performed so far
in the standard (2-10 keV) or similar X-ray band, we considered
different options. Taking into account the fact that coronal stars
with
erg s-1, a large-area
survey is necessary that is more sensitive than the XSS and has highly complete
source identification. Since no such survey has been performed so far
in the standard (2-10 keV) or similar X-ray band, we considered
different options. Taking into account the fact that coronal stars
with
![]() erg s-1 are characterized by soft spectra, we
decided to use the Rosat All-Sky Survey. Furthemore, by using spectral
data from different X-ray missions, it proved possible to convert the
space density of ROSAT sources detected in the 0.1-2.4 keV band to
harder X-ray bands.
erg s-1 are characterized by soft spectra, we
decided to use the Rosat All-Sky Survey. Furthemore, by using spectral
data from different X-ray missions, it proved possible to convert the
space density of ROSAT sources detected in the 0.1-2.4 keV band to
harder X-ray bands.
Our analysis was based on two published catalogs derived from the RASS:
the catalog of the 100 most luminous X-ray stars within 50 pc of the Sun
(Makarov 2003, hereafter M03) and the RASS catalog of the nearby
stars (Hünsch et al. 1999, hereafter H99). The first catalog includes
all stars with 0.1-2.4 keV luminosity (![]() )
higher than 9.8
)
higher than 9.8 ![]() 1029 erg s-1. The second catalog includes all objects from the Third Catalog of Nearby Stars (Gliese & Jahreiß 1991) that were detected in the RASS. Both catalogs are well suited for our statistical
study since they are expected to be highly complete and since they
provide accurate parallax distances for the sources.
1029 erg s-1. The second catalog includes all objects from the Third Catalog of Nearby Stars (Gliese & Jahreiß 1991) that were detected in the RASS. Both catalogs are well suited for our statistical
study since they are expected to be highly complete and since they
provide accurate parallax distances for the sources.
The ABs of RS CVn, BY Dra, Algol, W Uma and other types (mostly of the
first two types) make up 43% of the M03 sample. Another 42% consist
mostly of pre-main-sequence and young main-sequence stars, while 15%
of the stars are not classified. We therefore determined the space
density of all sources and did it separately for ABs. Since the M03 is
volume-limited, the source space density can be found as
The H99 catalog is expected to be highly complete within 25 pc of the
Sun with respect to X-ray stars with
![]()
![]() 1028 erg s-1. This follows from the fact that for 97% of the
sky an exposure of 100 s or longer was achieved in the RASS
(Voges et al. 1999), which for coronally active stars typically
corresponds to a 0.1-2.4 keV flux limit of
1028 erg s-1. This follows from the fact that for 97% of the
sky an exposure of 100 s or longer was achieved in the RASS
(Voges et al. 1999), which for coronally active stars typically
corresponds to a 0.1-2.4 keV flux limit of ![]() 2
2 ![]() 10-13 erg cm-2 s-1 (Hünsch et al. 1999). Given this flux limit one can readily find a distance D within which the H99 catalog should be complete for a given limiting luminosity. One can then again apply
Eq. (2) to estimate the space density of X-ray
stars with luminosities exceeding this limit within distance D.
10-13 erg cm-2 s-1 (Hünsch et al. 1999). Given this flux limit one can readily find a distance D within which the H99 catalog should be complete for a given limiting luminosity. One can then again apply
Eq. (2) to estimate the space density of X-ray
stars with luminosities exceeding this limit within distance D.
To separate ABs from other sources we need information about
source classes, which is not provided by H99. We thus cross-correlated
the H99 sample with published catalogs of chromospherically active
binaries (Strassmeier et al. 1993; Karatas et al. 2004). A few additional RS CVn and W Uma systems were
found by cross-correlating the H99 catalog with the General Catalog of
Variable Stars (Samus et al. 2004). Since it is possible that these catalogs
are not complete at low luminosities, we resticted our analysis to ABs
with
![]() erg s-1. We also compared the space
density of ABs within 25 pc with that within 15 pc. Table 3 provides space densities for X-ray stars in a number of luminosity intervals, as derived from the H99 sample.
erg s-1. We also compared the space
density of ABs within 25 pc with that within 15 pc. Table 3 provides space densities for X-ray stars in a number of luminosity intervals, as derived from the H99 sample.
Combining the results from the M03 and H99 samples we obtained
the differential soft X-ray luminosity function of nearby
low-luminosity sources shown in Fig. 5. One can see
that between
![]() and
and ![]() 1031.5 erg s-1,
ABs dominate the local X-ray source population. At lower luminosities,
the fraction of YSs (and normal, Sun-like stars at the lower end of
the luminosity function) becomes progressively higher, although
the somewhat higher space density of ABs found within D=15 pc
compared to D=25 pc may indicate that the catalogs of ABs start to
be incomplete at
1031.5 erg s-1,
ABs dominate the local X-ray source population. At lower luminosities,
the fraction of YSs (and normal, Sun-like stars at the lower end of
the luminosity function) becomes progressively higher, although
the somewhat higher space density of ABs found within D=15 pc
compared to D=25 pc may indicate that the catalogs of ABs start to
be incomplete at
![]() erg s-1 within the
larger volume.
erg s-1 within the
larger volume.
![\begin{figure}
\par\includegraphics[width=8cm,clip]{4297fig5.ps}\end{figure}](/articles/aa/full/2006/16/aa4297-05/img123.gif) |
Figure 5: Differential soft X-ray luminosity function of stars in the solar neighborhood derived from the RASS. The filled circles show the XLF of all stars, and the open squares show the XLF of ABs within 50 pc of the Sun. For three low-luminosity bins the XLF of ABs within 15 pc of the Sun is also shown (triangles). |
| Open with DEXTER | |
Our analysis implies that the local space density of ABs with
![]() erg s-1 is
erg s-1 is
![]()
![]() 10-4 pc-3 (using D=25 pc for the H99 sample), in satisfactory agreement with the estimate based on the
Einstein Extended Medium Sensitivity Survey of
10-4 pc-3 (using D=25 pc for the H99 sample), in satisfactory agreement with the estimate based on the
Einstein Extended Medium Sensitivity Survey of
![]()
![]() 10-4 pc-3 (Ottmann & Schmitt 1992; Fleming et al. 1989). It also follows from the above
analysis that stars with
10-4 pc-3 (Ottmann & Schmitt 1992; Fleming et al. 1989). It also follows from the above
analysis that stars with
![]() erg s-1 produce less than 20% of the total local soft X-ray emissivity (see Table 4). We point out that the soft X-ray luminosity
function shown in Fig. 5 extends from the most luminous coronal stars (
erg s-1 produce less than 20% of the total local soft X-ray emissivity (see Table 4). We point out that the soft X-ray luminosity
function shown in Fig. 5 extends from the most luminous coronal stars (
![]() erg s-1) down to Sun-like stars (
erg s-1) down to Sun-like stars (
![]() erg s-1).
erg s-1).
Conversion of the soft X-ray luminosity function obtained above to the 2-10 keV energy band requires knowledge of the source spectra. Since the majority of RASS sources used in our analysis have not been observed in the standard X-ray band, we are bound to rely on a representative set of sources for which broad-band spectra are available. To this end we selected X-ray observations from public archives, of sufficiently good quality for spectral analysis, for 22 sources from the M03 sample and 25 sources from the H99 sample. All observations were performed by ASCA, except for the star GJ 1245 observed by Chandra. The ASCA and Chandra data were then processed by standard tasks of HEASOFT and CIAO packages according to recipes of the Guest Observer Facilities (http://legacy.gsfc.nasa.gov/docs/asca/ascagof.html and http://cxc.harvard.edu/ciao/).
In the 0.5-10 keV band the moderate resolution spectra of
all selected sources are well fit by a broken power law with the
break energy and lower-energy photon index fixed at 0.8 keV and 1.5,
respectively. The high-energy photon index was a free parameter in our
analysis and we found best-fit values for it in the range ![]() 3 to
3 to ![]() 5 for different sources. This simple empirical model
mimics reasonably well the actual multi-temperature emission spectrum
(e.g. Schmitt et al. 1990; Güdel 2004; Dempsey et al. 1993) dominated by strong blended line
emission below
5 for different sources. This simple empirical model
mimics reasonably well the actual multi-temperature emission spectrum
(e.g. Schmitt et al. 1990; Güdel 2004; Dempsey et al. 1993) dominated by strong blended line
emission below ![]() 0.8 keV. From the best-fit model we found the
ratio for each source of its luminosity in the 2-10 keV band to
that in the 0.5-2 keV band.
0.8 keV. From the best-fit model we found the
ratio for each source of its luminosity in the 2-10 keV band to
that in the 0.5-2 keV band.
We then went on to convert L (0.5-2 keV) to ![]() ,
luminosity
in the ROSAT (0.1-2.4 keV) band, assuming L(0.5-2 keV)/
,
luminosity
in the ROSAT (0.1-2.4 keV) band, assuming L(0.5-2 keV)/
![]() ,
a ratio typical of the coronal stars observed by
Einstein and ROSAT (Fleming et al. 1995). The resulting values of
,
a ratio typical of the coronal stars observed by
Einstein and ROSAT (Fleming et al. 1995). The resulting values of
![]() are
plotted as a function of
are
plotted as a function of ![]() in Fig. 6 for our
spectral sample of sources. In most cases the
in Fig. 6 for our
spectral sample of sources. In most cases the ![]() value determined
from ASCA or Chandra observations differs by less than a factor of 2
from the soft X-ray luminosity directly measured by ROSAT at a different epoch.
value determined
from ASCA or Chandra observations differs by less than a factor of 2
from the soft X-ray luminosity directly measured by ROSAT at a different epoch.
![\begin{figure}
\par\includegraphics[width=8cm,clip]{4297fig6.ps}\end{figure}](/articles/aa/full/2006/16/aa4297-05/img132.gif) |
Figure 6:
Ratio of luminosities in the 2-10 keV and 0.1-2.4 keV
energy bands as a function of soft X-ray luminosity for RASS sources,
estimated from ASCA or Chandra spectra. Solid symbols denote ABs and
open symbols other coronal stars. Also shown (shaded region) is the 1 |
| Open with DEXTER | |
Figure 6 confirms the well-known trend of the hardening of
stellar coronal X-ray emission with increasing luminosity
(e.g. Schmitt et al. 1990; Güdel 2004). It also demonstrates that ABs do
not distinguish themselves spectrally from YSs with similar
luminosities. Averaging the ratios
![]() for individual
sources in a sliding window of width
for individual
sources in a sliding window of width
![]() led to the
result shown by the shaded region in Fig. 6, which
reflects the uncertainty in
led to the
result shown by the shaded region in Fig. 6, which
reflects the uncertainty in
![]() due to the scatter
of individual
due to the scatter
of individual
![]() values around this mean value. The
sliding-window average can be approximated by the power law
values around this mean value. The
sliding-window average can be approximated by the power law
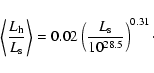
The width of the shaded region in Fig. 6 indicates
that the hardness-luminosity trend described by
Eq. (3), which is based on a fairly small sample of
sources, should enable ![]() 50% accuracy for conversion of our soft
X-ray luminosity function (Fig. 5), derived from a much larger sample of RASS sources, to the 2-10 keV energy band for
50% accuracy for conversion of our soft
X-ray luminosity function (Fig. 5), derived from a much larger sample of RASS sources, to the 2-10 keV energy band for
![]() erg s-1.
erg s-1.
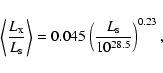
Below we will need a similarly determined approximate trend for the harder
energy band 3-20 keV:
We then proceeded to convert to a common energy band the X-ray (3-20 keV) and soft X-ray (0.1-2.4 keV) luminosity functions derived from the XSS and RASS in Sects. 2 and 3, respectively. We first considered the 2-10 keV band. For the XSS sample one can readily recompute the XLF using the 2-10 keV source luminosities given in Table 1. We applied a more approximate procedure to the RASS sample, namely converted the measured soft X-ray luminosities to the 2-10 keV range using the approximate hardness-luminosity trend given by Eq. (3) and then recomputed the XLF. The two recomputed XLFs make up a broad range XLF (from 1027.5 to 1034 erg s-1) that is shown in Fig. 7. We then similarly constructed an XLF in the 3-20 keV band (Fig. 8); in this case only the RASS XLF needed to be recomputed using Eq. (4). The 3-20 keV XLF is used by Revnivtsev et al. (2006) to assess the contribution of point sources to the Galactic ridge X-ray emission measured by RXTE in the same energy band.
![\begin{figure}
\par\includegraphics[width=8.2cm,clip]{4297fig7.ps}\end{figure}](/articles/aa/full/2006/16/aa4297-05/img137.gif) |
Figure 7: Differential luminosity distribution of 2-10 keV emissivity per unit stellar mass of coronally active stars and CVs. The XLF derived from the XSS is shown by filled circles, and the XLF derived from the RASS is shown by open squares for all stars and by filled squares for ABs only. The errors shown for the RASS data points take into account an assumed 50% uncertainty of conversion from the original 0.1-2.4 keV band in addition to statistical errors. The dashed line shows the broken power-law fit to the combined XLF of ABs and CVs, given by Eq. (5). |
| Open with DEXTER | |
The XLFs shown in Figs. 7 and 8 were multipled by luminosity to expose the contribution of different luminosity intervals to the total X-ray
emissivity per unit stellar mass. In the low-luminosity range covered
by RASS data (
![]() erg s-1), both the total XLF,
including YSs, and separately that of ABs are
shown. To roughly allow for the uncertainty of conversion from the
original soft X-ray band to the 2-10 keV and 3-20 keV bands we ascribed 50% errors to the RASS data points in addition to statistical uncertainties.
erg s-1), both the total XLF,
including YSs, and separately that of ABs are
shown. To roughly allow for the uncertainty of conversion from the
original soft X-ray band to the 2-10 keV and 3-20 keV bands we ascribed 50% errors to the RASS data points in addition to statistical uncertainties.
The medium-luminosity XLF derived from the XSS and the low-luminosity XLF derived from the RASS partially overlap near 1030 erg s-1, in a region occupied predominantly by ABs, and they do not contradict each other. For the subsequent analysis we adopted the XSS estimates of differential source space densities in the (1030,1034) luminosity range and the RASS estimates of space densities of lower-luminosity sources.
![\begin{figure}
\par\includegraphics[width=8.2cm,clip]{4297fig8.ps}\end{figure}](/articles/aa/full/2006/16/aa4297-05/img139.gif) |
Figure 8: Same as Fig. 7, but for the 3-20 keV band. The dashed line shows the best-fitting model given by Eq. (6). |
| Open with DEXTER | |
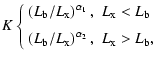
The combined 2-10 keV XLF of ABs and CVs can be approximated in the range 1028-1034 erg s-1 by a broken power law:
Using the differential XLFs obtained above one can assess the cumulative emissivity of local X-ray sources with luminosities below 1034 erg s-1. We present in Figs. 9 and 10 the corresponding plots for the 2-10 keV and 3-20 keV bands. Table 4 summarizes our estimates of the cumulative local emissivities (per unit stellar mass) of ABs, CVs, and YSs in the energy bands 0.1-2.4 keV, 2-10 keV and 3-20 keV, complemented by information about LMXBs (see Sect. 4.2 below).
![\begin{figure}
\par\includegraphics[width=7.7cm,clip]{4297fig9.ps}\end{figure}](/articles/aa/full/2006/16/aa4297-05/img155.gif) |
Figure 9: Cumulative 2-10 keV emissivity of ABs and CVs as a function of luminosity (solid histogram and error bars) and cumulative emissivity of all coronal stars and CVs (dashed histogram). The error bars translate from those for the XLF shown in Fig. 7). |
| Open with DEXTER | |
Approximately 80% of the total X-ray (2-10 keV) luminosity of ABs and CVs is
produced by sources with
![]() erg s-1. In the
solar neighborhood an additional significant contribution comes from
YSs with
erg s-1. In the
solar neighborhood an additional significant contribution comes from
YSs with
![]() erg -1, which make up
erg -1, which make up ![]() 30%
of the total luminosity at 2-10 keV. The fractional contribution of YSs decreases when going to a harder X-ray band because of their relatively soft spectra (compare Figs. 9 and 10). We note that the estimated (by integrating
the soft X-ray luminosity function shown in Fig. 5 up to
30%
of the total luminosity at 2-10 keV. The fractional contribution of YSs decreases when going to a harder X-ray band because of their relatively soft spectra (compare Figs. 9 and 10). We note that the estimated (by integrating
the soft X-ray luminosity function shown in Fig. 5 up to
![]() erg s-1) high soft X-ray emissivities of ABs and YSs compared to the harder X-ray bands reflect the fact that stellar
coronae are much more efficient sources of soft X-rays than hard
X-rays. Also the lower luminosity end of the distributions shown in
Figs. 9 and 10 corresponds to
erg s-1) high soft X-ray emissivities of ABs and YSs compared to the harder X-ray bands reflect the fact that stellar
coronae are much more efficient sources of soft X-rays than hard
X-rays. Also the lower luminosity end of the distributions shown in
Figs. 9 and 10 corresponds to
![]() erg s-1, and the contribution of less luminous X-ray
stars (including normal stars like the Sun) to the total X-ray
emissivity above 2 keV is expected to be negligible, since they contribute less
than 20% to the soft X-ray emissivity and are softer than the more
luminous sources (see Sect. 3).
erg s-1, and the contribution of less luminous X-ray
stars (including normal stars like the Sun) to the total X-ray
emissivity above 2 keV is expected to be negligible, since they contribute less
than 20% to the soft X-ray emissivity and are softer than the more
luminous sources (see Sect. 3).
![\begin{figure}
\par\includegraphics[width=7.7cm,clip]{4297fi10.ps}\end{figure}](/articles/aa/full/2006/16/aa4297-05/img160.gif) |
Figure 10: Same as Fig. 9, but for the 3-20 keV band. |
| Open with DEXTER | |
Table 4: Number densities and emissivities of diffirent classes of sources.
Our preceding analysis does not permit estimation of the soft X-ray
emissivity of CVs. The XSS sample is not suitable for this purpose
because the high-energy component (optically thin thermal emission
with ![]() keV) of CV spectra observed by RXTE or a similar X-ray instrument is often intrinsically absorbed below
several keV (e.g. Suleimanov et al. 2005; Cropper et al. 1998), while another, much softer
component (black-body emission with
keV) of CV spectra observed by RXTE or a similar X-ray instrument is often intrinsically absorbed below
several keV (e.g. Suleimanov et al. 2005; Cropper et al. 1998), while another, much softer
component (black-body emission with ![]() eV) appears in the
ROSAT energy range, with the relative amplitudes of the two components
varying greatly from source to source (Cropper 1990, see also
Fig. 3). Therefore, to obtain a reliable estimate of
the CV soft X-ray emissivity one has to use a flux-limited and
optically identified soft X-ray survey such as the Rosat Bright Survey
(RBS, Schwope et al. 2000).
eV) appears in the
ROSAT energy range, with the relative amplitudes of the two components
varying greatly from source to source (Cropper 1990, see also
Fig. 3). Therefore, to obtain a reliable estimate of
the CV soft X-ray emissivity one has to use a flux-limited and
optically identified soft X-ray survey such as the Rosat Bright Survey
(RBS, Schwope et al. 2000).
The RBS has already been used by Schwope et al. (2002) to estimate the space
density of non-magnetic CVs. Using the same sample of 15 non-magnetic CVs
with measured distances (Table 4 in Schwope et al. 2002, which provides
source luminosities and
![]() values), we can readily estimate the
soft X-ray cumulative emissivity (per unit stellar mass) of
non-magnetic CVs:
values), we can readily estimate the
soft X-ray cumulative emissivity (per unit stellar mass) of
non-magnetic CVs: ![]() 7
7 ![]() 1026 erg s-1.
1026 erg s-1.
Unfortunately, as noted by Schwope et al. (2002), the RBS sample of magnetic
CVs suffers substantially from incomplete distance information, which
currently makes its use for statistical studies diffucult. Using the published
estimate of the space density of magnetic CVs of ![]() 3
3 ![]() 10-7 pc-3 (Patterson 1984; Warner 1995), which may be affected by different
biases but nevertheless agrees with our XSS based estimate of the space
density of magnetic CVs with
10-7 pc-3 (Patterson 1984; Warner 1995), which may be affected by different
biases but nevertheless agrees with our XSS based estimate of the space
density of magnetic CVs with
![]() erg s-1 of (4.8
erg s-1 of (4.8 ![]() 1.6)
1.6) ![]() 10-7 pc-3, and assuming
10-7 pc-3, and assuming
![]()
![]() 1031 erg s-1 for the average source luminosity
(e.g. Barrett et al. 1999), we can estimate the soft X-ray emissivity of
magnetic CVs at
1031 erg s-1 for the average source luminosity
(e.g. Barrett et al. 1999), we can estimate the soft X-ray emissivity of
magnetic CVs at ![]() 4
4 ![]() 1026 erg s-1
1026 erg s-1
![]() .
Considering that this estimate can be inaccurate by a factor of a few, we infer that the combined soft
X-ray emissivity of non-magnetic and magnetic CVs is likely to be less
than a few 1027 erg s-1
.
Considering that this estimate can be inaccurate by a factor of a few, we infer that the combined soft
X-ray emissivity of non-magnetic and magnetic CVs is likely to be less
than a few 1027 erg s-1
![]() .
This implies that the total local
soft X-ray emissivity is strongly dominated by ABs and YSs (see
Table 4).
.
This implies that the total local
soft X-ray emissivity is strongly dominated by ABs and YSs (see
Table 4).
The XLF of Galactic LMXBs in the energy band 2-10 keV has been constructed by
Grimm et al. (2002). Gilfanov (2004) subsequently demonstrates that the LMXB XLFs
for 11 nearby galaxies and the Milky Way have a universal shape and
normalizations that are proportional to the stellar masses. We
attached the XLF of ABs and CVs constructed here to the XLF of high
luminosity LMXBs (![]() 1035-
1035-![]() 1039 erg s-1)
averaged over nearby galaxies. The combined XLF (per unit
stellar mass) multiplied by luminosity is shown in
Fig. 11.
1039 erg s-1)
averaged over nearby galaxies. The combined XLF (per unit
stellar mass) multiplied by luminosity is shown in
Fig. 11.
The only poorly studied luminosity interval that remains is
1034 to ![]() 1035 erg s-1, but it is possible to place an upper limit on the space density of objects with such luminosities based on the ASCA Galactic Plane Survey
(Sugizaki et al. 2001). This survey covers
1035 erg s-1, but it is possible to place an upper limit on the space density of objects with such luminosities based on the ASCA Galactic Plane Survey
(Sugizaki et al. 2001). This survey covers ![]() 40 sq. deq within the
central region of the Galactic plane (
40 sq. deq within the
central region of the Galactic plane (
![]() and
and
![]() ), with the flux limit in the 2-10 keV
energy band varying between
), with the flux limit in the 2-10 keV
energy band varying between ![]() 10-12.5 and
10-12.5 and ![]() 10-12 erg cm-2 s-1.
10-12 erg cm-2 s-1.
![\begin{figure}
\par\includegraphics[width=8.15cm,clip]{4297fi11.ps}\end{figure}](/articles/aa/full/2006/16/aa4297-05/img189.gif) |
Figure 11: Differential luminosity distribution of 2-10 keV emissivity of ABs, CVs, and LMXBs. Contributions of these classes of sources are also indicated and analytical approximations given by Eq. (5) and Gilfanov (2004) are presented (dashed lines). |
| Open with DEXTER | |
It follows from the number-flux distribution obtained by
Sugizaki et al. (2001) that there are on average ![]() 4 deg-2 Galactic
sources with flux higher than
10-12.5 erg cm-2 s-1within the region
4 deg-2 Galactic
sources with flux higher than
10-12.5 erg cm-2 s-1within the region
![]() ,
,
![]() .
This implies that
the total number of such sources in this region is
.
This implies that
the total number of such sources in this region is ![]() 290. Since the vast majority of weak sources detected in the ASCA survey are unidentified, we can conservatively assume that all
detected sources that are brighter than
10-12.5 erg cm-2 s-1have luminosities exceeding 1034 erg s-1. At the flux limit of
the survey, a source with
290. Since the vast majority of weak sources detected in the ASCA survey are unidentified, we can conservatively assume that all
detected sources that are brighter than
10-12.5 erg cm-2 s-1have luminosities exceeding 1034 erg s-1. At the flux limit of
the survey, a source with
![]() erg s-1 is detectable
out to a distance >16 kpc, i.e. almost to the outer boundary of the
Galactic disk. Using the model of stellar mass distribution in the
Galactic disk
erg s-1 is detectable
out to a distance >16 kpc, i.e. almost to the outer boundary of the
Galactic disk. Using the model of stellar mass distribution in the
Galactic disk
It can be seen from Fig. 11 that the differential
luminosity distribution of the X-ray emissivity of Galactic
low-mass close binaries has two maxima. The primary peak at
![]() erg s-1 is due to neutron-star LMXBs accreting at near the Eddington limit. The secondary peak, at
erg s-1 is due to neutron-star LMXBs accreting at near the Eddington limit. The secondary peak, at ![]() 1029-1033 erg s-1, is formed jointly by ABs and CVs. The XLF can be approximated by Eq. (5)
in the range 1028-1034 erg s-1 and by the LMXB
template given in Gilfanov (2004) (their Eqs. (8), (9) and Table 3)
in the range 1035-1039 erg s-1. Both
analytical fits are shown by dashed lines in Fig. 11.
1029-1033 erg s-1, is formed jointly by ABs and CVs. The XLF can be approximated by Eq. (5)
in the range 1028-1034 erg s-1 and by the LMXB
template given in Gilfanov (2004) (their Eqs. (8), (9) and Table 3)
in the range 1035-1039 erg s-1. Both
analytical fits are shown by dashed lines in Fig. 11.
In Fig. 12 we show the cumulative 2-10 keV
emissivity of ABs, CVs, and LMXBs as a function of luminosity. The LMXBs
provide by far the dominant contribution (![]() 1029 erg s-1
1029 erg s-1
![]() )
to the total emissivity, whereas ABs and CVs together contribute
)
to the total emissivity, whereas ABs and CVs together contribute ![]() 3%. Figure 12 also demonstrates the
effect of cutting out the bright end of the combined XLF: the cumulative emissivity of LMXBs with
3%. Figure 12 also demonstrates the
effect of cutting out the bright end of the combined XLF: the cumulative emissivity of LMXBs with
![]() (
(
![]() ) erg s-1 is
) erg s-1 is ![]() 50% (
50% (![]() 100%) of the
total emissivity of ABs and CVs.
100%) of the
total emissivity of ABs and CVs.
![\begin{figure}
\par\includegraphics[width=8.1cm,clip]{4297fi12.ps}\end{figure}](/articles/aa/full/2006/16/aa4297-05/img202.gif) |
Figure 12: Cumulative 2-10 keV emissivity (computed from low luminosities upward) of ABs, CVs, and LMXBS as a function of luminosity. The dashed lines show the levels of 100%, 150%, and 200% of the total emissivity of ABs and CVs. |
| Open with DEXTER | |
Finally Fig. 13 shows the predicted XLF and the
luminosity distribution of X-ray energy output of ABs, CVs
and LMXBs for the entire Galaxy. The predicted contribution
from ABs and CVs to the 2-10 keV luminosity of the Milky Way is ![]() 2
2 ![]() 1038 erg s-1, which agrees within the measurement
uncertainties with the total X-ray luminosity of the Galactic ridge
X-ray emission (see a detailed discussion in Revnivtsev et al. 2006).
1038 erg s-1, which agrees within the measurement
uncertainties with the total X-ray luminosity of the Galactic ridge
X-ray emission (see a detailed discussion in Revnivtsev et al. 2006).
![\begin{figure}
\par\includegraphics[width=8.05cm,clip]{4297fi13.ps}\end{figure}](/articles/aa/full/2006/16/aa4297-05/img203.gif) |
Figure 13:
Upper panel: XLF of Galactic low-mass close binaries. The
Galaxy stellar mass is assumed to be 7 |
| Open with DEXTER | |
In this paper we have constructed the X-ray (above 2 keV)
luminosity function of coronally active binaries, CVs, and LMXBs,
covering ![]() 12 orders of magnitude in luminosity.
12 orders of magnitude in luminosity.
We find that the differential luminosity distribution of X-ray emissivity (per unit stellar mass) of low-mass close binaries has a broad secondary peak at
![]() -1033 erg s-1 composed of ABs and CVs, in addition to the previously well-studied primary maximum at
-1033 erg s-1 composed of ABs and CVs, in addition to the previously well-studied primary maximum at
![]() 1038 erg s-1 made up of neutron-star LMXBs accreting
near the Eddington limit. The combined emissivity of ABs and CVs in
the 2-10 keV band is
1038 erg s-1 made up of neutron-star LMXBs accreting
near the Eddington limit. The combined emissivity of ABs and CVs in
the 2-10 keV band is
![]()
![]() 1027 erg s-1
1027 erg s-1
![]() ,
or
,
or ![]() 3% of the emissivity of LMXBs (averaged over nearby galaxies). About 65% of this total emissivity
is due to ABs. The estimated combined contribution of ABs and CVs to the 2-10 keV luminosity of the Milky Way is
3% of the emissivity of LMXBs (averaged over nearby galaxies). About 65% of this total emissivity
is due to ABs. The estimated combined contribution of ABs and CVs to the 2-10 keV luminosity of the Milky Way is ![]() 2
2 ![]() 1038 erg s-1.
1038 erg s-1.
Young coronal stars with luminosities
![]() erg s-1 provide an additional significant contribution
of
erg s-1 provide an additional significant contribution
of
![]()
![]() 1027 erg s
1027 erg s
![]() to
the cumulative 2-10 keV emissivity in the solar neighborhood
(within
to
the cumulative 2-10 keV emissivity in the solar neighborhood
(within ![]() 50 pc). However, the fractional contribution of YSs to
the X-ray emissivity is expected to vary substantially across the
Galaxy, reflecting local star formation history. In contrast, the
cumulative X-ray emission of ABs and CVs is expected to approximately
follow the distribution of stellar mass, as is known to be the case for LMXBs.
50 pc). However, the fractional contribution of YSs to
the X-ray emissivity is expected to vary substantially across the
Galaxy, reflecting local star formation history. In contrast, the
cumulative X-ray emission of ABs and CVs is expected to approximately
follow the distribution of stellar mass, as is known to be the case for LMXBs.
The results of this work find immediate application to the problem of the origin of Galactic ridge X-ray emission. Revnivtsev et al. (2006) use the XLF constructed here in combination with the X-ray surface brightness distribution of the ridge emission, which is shown to follow the stellar mass, to demonstrate that ABs and CVs (with a possible contribution from YSs) probably produce the bulk of the ridge emission.
The results of this work also indicate that in order to assess the
contribution of low-luminosity point X-ray sources (ABs and CVs) to
the apparently diffuse X-ray emission of gas-poor elliptical galaxies, it is
necessary to resolve the brightest LMXBs with
![]() erg s-1 (see Fig. 12). This
can already be achieved with Chandra for nearby galaxies. It
should be taken into account, however, that in elliptical galaxies a significant fraction of low-mass close binaries reside in globular clusters where their numbers are expected to be affected
by dynamical processes in combination with aging (e.g. Verbunt & Lewin 2005). It
will be important to compare the XLF derived here for the
solar neighborhood in future work with that determined for Galactic
globular clusters from deep Chandra observations (e.g. Heinke et al. 2005).
erg s-1 (see Fig. 12). This
can already be achieved with Chandra for nearby galaxies. It
should be taken into account, however, that in elliptical galaxies a significant fraction of low-mass close binaries reside in globular clusters where their numbers are expected to be affected
by dynamical processes in combination with aging (e.g. Verbunt & Lewin 2005). It
will be important to compare the XLF derived here for the
solar neighborhood in future work with that determined for Galactic
globular clusters from deep Chandra observations (e.g. Heinke et al. 2005).
Acknowledgements
This research has made use of the SIMBAD database (operated at the CDS, Strasbourg) and the High Energy Astrophysics Science Archive Research Center Online Service provided by the NASA/Goddard Space Flight Center.

![$\displaystyle K\left\{
\begin{array}{ll}
\left(L_{\rm b}/L_{\rm h}\right)^{\alp...
...L_{\rm h}\right)^{\alpha_2}, & L_{\rm h}>L_{\rm b},\\ [2mm]
\end{array}\right.$](/articles/aa/full/2006/16/aa4297-05/img150.gif)
![\begin{displaymath}%
\rho\propto\exp\left[-\left(\frac{R_{\rm m}}{R}\right)^3-\frac{R}{R_{\rm
scale}}-\frac{z}{z_{\rm scale}}\right],
\end{displaymath}](/articles/aa/full/2006/16/aa4297-05/img190.gif)