A&A 450, 159-166 (2006)
DOI: 10.1051/0004-6361:20054112
A. C. Krabbe - M. V. F. Copetti
Laboratório de Análise Numérica e Astrofísica, Departamento de Matemática, Universidade Federal de Santa Maria, 97119-900 Santa Maria, RS, Brazil
Received 27 August 2005 /Accepted 1 December 2005
Abstract
An observational study of chemical abundances in the galactic planetary
nebulae NGC 1535, NGC 2438, NGC 2440,
NGC 3132, NGC 3242, NGC 6302, and NGC 7009
based on long-slit spectra of high signal-to-noise ratio in the 3100 to 6900 Å range is presented. We determined the N, O, Ne, S, and Cl abundances from collisionally
excited lines and the He and
![]() abundances from recombination lines.
The
abundances from recombination lines.
The
![]() estimates derived from
recombination lines are about a factor of four and two higher
than those derived from forbidden lines
for NGC 7009 and NGC 3242, respectively.
Spatial profiles of
estimates derived from
recombination lines are about a factor of four and two higher
than those derived from forbidden lines
for NGC 7009 and NGC 3242, respectively.
Spatial profiles of
![]() abundance from O II
permitted lines and from [O III] forbidden lines were obtained for the planetary nebula
NGC 7009. The differences between
abundance from O II
permitted lines and from [O III] forbidden lines were obtained for the planetary nebula
NGC 7009. The differences between
![]() derived from
recombination and from forbidden lines present smooth variations along the nebular surface of NGC 7009, with the differences decreasing from
the center to the edges of the nebula. If these abundance differences are explained by the presence
of electron temperature fluctuations, quantified by the parameter t2, a value of about
t2=0.09 is required for NGC 3242 and NGC 7009.
derived from
recombination and from forbidden lines present smooth variations along the nebular surface of NGC 7009, with the differences decreasing from
the center to the edges of the nebula. If these abundance differences are explained by the presence
of electron temperature fluctuations, quantified by the parameter t2, a value of about
t2=0.09 is required for NGC 3242 and NGC 7009.
Key words: ISM: planetary nebula: general - ISM: abundances
Almost all the determinations of abundances of heavy elements in H II regions and planetary nebulae published up to now are based on the analysis of collisional excited emission lines, which depend exponentially on electron temperature. This fact makes necessary the use of precise determinations of electron temperature to obtain reliable estimates of ionic abundances. On the other hand, recently it has been possible to determine abundances of heavy elements from recombination lines, which have the advantage of being weakly dependent on the electron temperature and in principle can be reliable indicators of chemical abundances. However, these lines are very faint, about 103-104 times fainter than the strong forbidden lines, and thus are very difficult to detect and measure, mainly in objects with low surface brightness.
A common result reported in the literature is that the ionic abundances derived from recombination lines are systematically higher than those obtained from forbidden lines. These discrepancies can be very large, as for example, the factor of 10 found by Liu et al. (2000) in the CNO abundances for the planetary nebula NGC 6153. One potential explanation to these discrepancies would be the presence of temperature fluctuations inside of H II regions and planetary nebulae (Peimbert 1967). However, the observed values of electron temperature fluctuations have been lower than the ones necessary to reconcile the abundances derived from forbidden and permitted lines (O'Dell et al. 2003; Rubin et al. 2002; Liu 1998; Krabbe & Copetti 2005,2002; Rubin et al. 2003). Other solution that was suggested by Liu et al. (2000) would be the presence inside the nebula of hydrogen deficient clumps with high density and rich in heavy elements. A support for this hypothesis could arise from spatial profiles of abundances of heavy metals determined from recombination lines and forbidden lines in nebulae. However, only for the planetary nebulae NGC 6153 (Liu et al. 2000) and NGC 6720 (Garnett & Dinerstein 2001) has such a study been done to date.
In our previous paper (Krabbe & Copetti 2005, hereafter Paper I), we presented a study on the spatial variation of electron density and temperature in a sample of galactic
planetary nebulae. In the present paper we used the Paper I data to determine
the ionic and total abundances of He, N, O, Ne,
S, and Cl in the planetary nebulae NGC 1535, NGC 2438,
NGC 2440, NGC 3132, NGC 3242,
NGC 6302, and NGC 7009. A comparison between the spatial profiles of
![]() derived from forbidden and recombination lines in the planetary nebula NGC 7009 is also given. Section 2 describes the data utilized and the adopted procedures for determination of total and ionic abundances.
The results and discussions are presented in Sect. 3 and the conclusions are given in Sect. 4.
derived from forbidden and recombination lines in the planetary nebula NGC 7009 is also given. Section 2 describes the data utilized and the adopted procedures for determination of total and ionic abundances.
The results and discussions are presented in Sect. 3 and the conclusions are given in Sect. 4.
The current paper is based on long slit spectrophotometry data in the range
of 3100 to 6900 Å obtained on January, July and December 2002 with the Boller & Chivens spectrograph attached to the 1.52 m telescope of the European Southern Observatory (ESO), Chile; and on September 1994 and May 2002 with the Cassegrain spectrograph of the 1.6 m telescope at the
Laboratório Nacional de Astrofísica (LNA), Brazil. The slits used have entrances on the plane of sky of 2
![]()
![]()
![]() for the observations at ESO and 2
for the observations at ESO and 2
![]()
![]()
![]() for the observations at LNA. We used a Loral CCD of 2688
for the observations at LNA. We used a Loral CCD of 2688 ![]() 512 pixels at ESO and at LNA we used a SITe CCD of 1024
512 pixels at ESO and at LNA we used a SITe CCD of 1024 ![]() 1024 pixels on May 2002 and an EEV CCD of 800
1024 pixels on May 2002 and an EEV CCD of 800 ![]() 1024 pixels on September 1994. We used a grid of 1200 grooves mm-1 at LNA and at ESO we used a grid of 2400 grooves mm-1 during the January and July runs and a grid of 1200 grooves mm-1 during the December run. The spatial scale was
1024 pixels on September 1994. We used a grid of 1200 grooves mm-1 at LNA and at ESO we used a grid of 2400 grooves mm-1 during the January and July runs and a grid of 1200 grooves mm-1 during the December run. The spatial scale was
![]() pxl-1 for the Loral CCD,
pxl-1 for the Loral CCD,
![]() pxl-1 for the EEV CCD, and
pxl-1 for the EEV CCD, and
![]() pxl-1 for the SITe CCD. The spectra obtained had a spectral resolution of 1.5 Å and 3.0 Å for the observations at ESO and 2.8 Å for the observations at LNA, measured as the full-width-at-half-maximum FWHM of the emission lines of the comparison lamps. In Paper I, we described the observations and the data reduction procedures with details.
pxl-1 for the SITe CCD. The spectra obtained had a spectral resolution of 1.5 Å and 3.0 Å for the observations at ESO and 2.8 Å for the observations at LNA, measured as the full-width-at-half-maximum FWHM of the emission lines of the comparison lamps. In Paper I, we described the observations and the data reduction procedures with details.
Combining multiple exposures we have obtained a mean spectrum for each nebula
after the integration of the light along the slit. The line intensities were obtained using Gaussian line profile fitting procedures. In the cases of line blending, we have employed
multiple Gaussian profile fitting in order to deconvolve the lines
and measure the line intensities of each individual line.
These measurements were carried out with the
splot routine of the ![]() package. All the line intensities of a given spectrum were normalized to H
package. All the line intensities of a given spectrum were normalized to H![]() .
We estimated the error associated with the line flux intensities by
.
We estimated the error associated with the line flux intensities by
![]() ,
where
,
where
![]() and
and
![]() are the continuum rms and the Poisson error of the line respectively. All the observed line intensities were corrected for the effect of the interstellar extinction. This correction was done by comparing the observed
are the continuum rms and the Poisson error of the line respectively. All the observed line intensities were corrected for the effect of the interstellar extinction. This correction was done by comparing the observed
![]() and
and
![]() ratios with the theoretical ones by Hummer (1987) for an electron temperature of 10 000 K and a density of 100
ratios with the theoretical ones by Hummer (1987) for an electron temperature of 10 000 K and a density of 100
![]() .
The Galactic reddening function,
.
The Galactic reddening function,
![]() ,
of Savage & Mathis (1979) was used. Table 1 lists Galactic reddening function,
,
of Savage & Mathis (1979) was used. Table 1 lists Galactic reddening function,
![]() ,
the emission line intensities corrected by reddening
,
the emission line intensities corrected by reddening
![]() ,
and the logarithmic extinction coefficient
,
and the logarithmic extinction coefficient
![]() for each object. We have measured the Balmer jump by linearly fitting the observed continua on both sides of the discontinuity (see more details in Paper I).
for each object. We have measured the Balmer jump by linearly fitting the observed continua on both sides of the discontinuity (see more details in Paper I).
Electron temperature estimates
![]() (O III) and
(O III) and
![]() (N II)
were derived from the [O III]
(N II)
were derived from the [O III]
![]() and [N II]
and [N II]
![]() intensity
ratios and electron densities
intensity
ratios and electron densities
![]() (S II),
(S II),
![]() (Cl III), and
(Cl III), and
![]() (Ar IV) from the [S II]
(Ar IV) from the [S II]
![]() ,
[Cl III]
,
[Cl III]
![]() ,
and [Ar IV]
,
and [Ar IV]
![]() intensity ratios, respectively. These electron temperatures
and densities were obtained by numerically solving the equilibrium
equations for an n-level atom using the temden routine of the nebular package of the STSDAS/IRAF, using the same atomic parameters and electron density and temperature
adopted in Paper I. We have also calculated the electron temperature from the ratio of the
nebular Balmer discontinuity to
intensity ratios, respectively. These electron temperatures
and densities were obtained by numerically solving the equilibrium
equations for an n-level atom using the temden routine of the nebular package of the STSDAS/IRAF, using the same atomic parameters and electron density and temperature
adopted in Paper I. We have also calculated the electron temperature from the ratio of the
nebular Balmer discontinuity to
![]() ,
,
![]() for NGC 1535, NGC 2440,
NGC 3242, and NGC 7009. In Paper I we have discussed in detail the possible sources of uncertainty in the determination of electron temperature and density.
for NGC 1535, NGC 2440,
NGC 3242, and NGC 7009. In Paper I we have discussed in detail the possible sources of uncertainty in the determination of electron temperature and density.
We derived the
![]() abundance from the emission lines
abundance from the emission lines
![]() ,
,
![]() ,
and
,
and
![]() and then averaged these abundances weighting according to the intensity of the line. The
and then averaged these abundances weighting according to the intensity of the line. The
![]() ratios were obtained from the He II
ratios were obtained from the He II
![]() line. The recombination coefficients used were from Storey & Hummer (1995) for H and He II and from Benjamin et al. (1999) for He I, which includes the effects
of collisional excitation from both 23 S and 21 metastable level.
The elemental abundance of He was given by
line. The recombination coefficients used were from Storey & Hummer (1995) for H and He II and from Benjamin et al. (1999) for He I, which includes the effects
of collisional excitation from both 23 S and 21 metastable level.
The elemental abundance of He was given by
![]() .
.
We have derived ionic abundances of N, O, Ne, S and Cl from collisionally excited lines. These ionic abundances were derived by solving numerically the equilibrium equations for an n-level atom using the abund routine of the nebular package of the STSDAS/IRAF. The references used for the collision strengths C, transition probabilities A, and energy levels E are listed in Table 2.
The determination of ionic abundances derived from forbidden lines
presents an exponential dependence on the assumed electron temperature.
Therefore, appropriate temperatures must be adopted to calculate the abundance for a given
ion. On the other hand, the dependence of ionic abundance estimates on the assumed electron density
is insignificant. We have assumed the following scheme in the
derivation of the ionic abundances: ![]() (N II) and
(N II) and ![]() (S II) were adopted for
(S II) were adopted for
![]() ,
,
![]() ,
,
![]() and
and
![]() ,
apart from the cases of NGC 1535 and
NGC 3242, for which
,
apart from the cases of NGC 1535 and
NGC 3242, for which ![]() (O III) was adopted instead, because
(O III) was adopted instead, because ![]() (N II) was not measured and NGC 1535, where
(N II) was not measured and NGC 1535, where ![]() (Ar IV) was
the only density estimate;
(Ar IV) was
the only density estimate; ![]() (O III) and a mean density obtained from
(O III) and a mean density obtained from ![]() (Cl III) and
(Cl III) and ![]() (Ar IV) were adopted for
(Ar IV) were adopted for
![]() ,
,
![]() and
and
![]() ;
for
;
for
![]() and
and
![]() we used
a mean density from
we used
a mean density from ![]() (Cl III) and
(Cl III) and ![]() (Ar IV) and an electron temperature of
(Ar IV) and an electron temperature of
![]() ,
which was indicated by Kingsburgh & Barlow (1994) based on the the results of photoionization models.
,
which was indicated by Kingsburgh & Barlow (1994) based on the the results of photoionization models.
As discussed by Kingsburgh & Barlow (1994), the fractions of neutral heavy element are assumed to be the same as neutral hydrogen and therefore the final abundances relative to hydrogen are not altered. So, the abundances of neutral species were not derived. The total abundance for a given element was a sum of the ionic abundances. We used the ionization correction factors icf discussed by Kingsburgh & Barlow (1994) to correct for the unseen ions for a given element, except for Cl, which was not discussed by those authors. For Cl we assumed the ionization correction factor adopted by Liu et al. (2000), based on the similarities of the ionization potentials of the Cl ion stages to those of the S ion stages. The errors in the ionic abundance were obtained by propagating the errors in electron temperature and line fluxes.
Table 2: References for the atomic data.
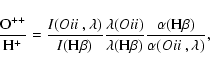
The
![]() abundance derived from observed recombination lines was obtained
adopting the following equation:
abundance derived from observed recombination lines was obtained
adopting the following equation:
We have derived
![]() abundances for NGC 3242 and
NGC 7009, the only planetary nebulae in our sample with good signal-to-noise
ratios in O II emission
lines. We also obtained a spatial profile of the
abundances for NGC 3242 and
NGC 7009, the only planetary nebulae in our sample with good signal-to-noise
ratios in O II emission
lines. We also obtained a spatial profile of the
![]() abundance for NGC 7009 from point-to-point measurements of the O II
abundance for NGC 7009 from point-to-point measurements of the O II
![]() line. Although
this O II
line. Although
this O II
![]() line is blended with the [Fe III] + C IV
line is blended with the [Fe III] + C IV
![]() line, it could be deconvolved and measured accurately. In Fig. 1 a sample of the spectral region around 4661 Å for NGC 7009 is presented.
line, it could be deconvolved and measured accurately. In Fig. 1 a sample of the spectral region around 4661 Å for NGC 7009 is presented.
![\begin{figure}
\par\includegraphics[width=8.2cm,clip]{4112fig1.eps}\end{figure}](/articles/aa/full/2006/16/aa4112-05/img55.gif) |
Figure 1: A sample of the spectral region around 4661 Å for NGC 7009. |
| Open with DEXTER | |
Table 3 presents the temperatures and densities estimated from the integrated
spectrum for each planetary nebula in our sample. We have compared these estimates
with those obtained from point-to-point measurements along the nebular surface published in Paper I. In general the estimates of electron temperatures and densities
obtained from the integrated spectrum and from point-to-point measurements are
consistent with each other within the error estimates, although some differences are found in some objects. These two methods provide mean values of electron temperatures and densities with different weights, so different mean temperatures and densities can be obtained from these methods. We can
find differences in the estimates obtained with the two methods mainly
in objects that presents systematic variations of electron temperature and density along the nebular surface. In particular, we have found large differences in the determinations
of [S II] and [Cl III] electron densities for NGC 6302.
The [S II] and [Cl III] densities of NGC 6302 obtained from
the integrated spectrum are about
![]() and
and
![]() lower than those derived from the point-to-point measurements. As this object shows an impressive spatial gradient of electron density, with the electron density peaking at the centre of the nebula and decreasing from the centre to the outer regions, we can expect higher densities derived from the point-to-point measurements (see Paper I).
lower than those derived from the point-to-point measurements. As this object shows an impressive spatial gradient of electron density, with the electron density peaking at the centre of the nebula and decreasing from the centre to the outer regions, we can expect higher densities derived from the point-to-point measurements (see Paper I).
Table 3: Electron temperatures and densities.
Table 4: Ionic and total abundances.
Table 5: Comparison of elemental abundances from different sources.
Table 4 lists the He abundances derived from He I and He II recombination lines, the ionic and elemental abundances for heavy elements derived from forbidden lines, and the icf adopted. Table 5 presents a comparison between the elemental abundances derived in this paper and the ones previously published, expressed in units of log (X/H) + 12, for X = He, N, O, Ne, S and Cl. We verified that our elemental abundances are in good agreement with those obtained by other authors. Also, our estimations support the classification of NGC 2440, NGC 3132,and NGC 6302 as type I planetary nebulae (Peimbert & Torres-Peimbert 1983; Peimbert 1978), which represents objects rich in helium and nitrogen.
The S/O abundance ratios derived for our sample of planetary nebulae are 0.11 to 0.92 dex
lower than the values estimated for H II regions and the Sun (Esteban et al. 1998; Grevesse et al. 1996), with
considerably larger discrepancies for NGC 2438, NGC 2440 and
NGC 3242. These subsolar S/O ratios for the
planetary nebulae also found by other authors (Aller & Keyes 1987; Aller & Czyzak 1983; Kingsburgh & Barlow 1994; de Freitas Pacheco et al. 1991)
were extensively discussed by Henry et al. (2004), who suggested that
the problem lies in the S abundance estimates, which
fail to adequately evaluate, through the use of icfs, the amount of
![]() in the planetary nebulae. In particular, the standard ionization corrections might not be adequate if a nebula is matter-bounded, as is often the case for planetary nebulae.
in the planetary nebulae. In particular, the standard ionization corrections might not be adequate if a nebula is matter-bounded, as is often the case for planetary nebulae.
The O/H ratio for NGC 6302 is 0.2 to 0.5 dex lower than those
obtained by other authors. Greater differences were found from Aller et al. (1981), who
did not measure the [O III]
![]() lines. They
calculated the chemical abundances with some measurements of emission line
intensities combined with a simple theoretical model. For de Freitas Pacheco et al. (1991) and Tsamis et al. (2003), more modest differences of about 0.2 dex were found.
In the case of the estimates of de Freitas Pacheco et al. (1991)
the [O III]
lines. They
calculated the chemical abundances with some measurements of emission line
intensities combined with a simple theoretical model. For de Freitas Pacheco et al. (1991) and Tsamis et al. (2003), more modest differences of about 0.2 dex were found.
In the case of the estimates of de Freitas Pacheco et al. (1991)
the [O III]
![]() line was not measured;
line was not measured; ![]() (O III)
was not adopted to calculate the
(O III)
was not adopted to calculate the
![]() abundance. The values of the oxygen emission line intensities, mean electron temperatures and densities adopted
by Tsamis et al. (2003) to calculate the
abundance. The values of the oxygen emission line intensities, mean electron temperatures and densities adopted
by Tsamis et al. (2003) to calculate the
![]() and
and
![]() and
the ionic abundances are themselves very close to ours. However, they derived the
and
the ionic abundances are themselves very close to ours. However, they derived the
![]() abundance from the O IV]
abundance from the O IV]
![]() ultraviolet line.
Thus, their ionization correction scheme was simpler and the atomic abundance obtained is
probably more precise than ours, since they only needed to indirectly evaluate
the presence of oxygen ions with higher stages of ionization.
The lack of O IV] line measurements should be less noticeable in low ionization
objects. The central star of NGC 6302 is the hottest of our
sample with a temperature of about 250 000 K (Casassus et al. 2000).
This difference of about 0.2 dex in the O/H ratio gives a general idea of the errors in the total abundance for planetary nebulae with very hot central stars introduced by the use of
different icfs.
ultraviolet line.
Thus, their ionization correction scheme was simpler and the atomic abundance obtained is
probably more precise than ours, since they only needed to indirectly evaluate
the presence of oxygen ions with higher stages of ionization.
The lack of O IV] line measurements should be less noticeable in low ionization
objects. The central star of NGC 6302 is the hottest of our
sample with a temperature of about 250 000 K (Casassus et al. 2000).
This difference of about 0.2 dex in the O/H ratio gives a general idea of the errors in the total abundance for planetary nebulae with very hot central stars introduced by the use of
different icfs.
Table 6 lists the
![]() abundance derived from recombination
lines for NGC 3242 and NGC 7009. The values of the
abundance derived from recombination
lines for NGC 3242 and NGC 7009. The values of the
![]() abundance estimated from different O II emission lines are
quite similar to one another,
both for NGC 3242 and NGC 7009.
However, these abundances are significantly higher than those obtained from
collisionally excited lines, by a factor of about two for NGC 3242 and of four
for NGC 7009. Similar results were found by Liu et al. (1995)
for NGC 7009 and by Tsamis et al. (2004,2003) for NGC 3242.
abundance estimated from different O II emission lines are
quite similar to one another,
both for NGC 3242 and NGC 7009.
However, these abundances are significantly higher than those obtained from
collisionally excited lines, by a factor of about two for NGC 3242 and of four
for NGC 7009. Similar results were found by Liu et al. (1995)
for NGC 7009 and by Tsamis et al. (2004,2003) for NGC 3242.
Table 6:
![]() abundances derived from recombination lines.
abundances derived from recombination lines.
Figure 2 presents the spatial profiles in the emission lines
[O III]
![]() ,
O II
,
O II
![]() ,
and
,
and
![]() for NGC 7009 along the East-West direction. The emission of
[O III]
for NGC 7009 along the East-West direction. The emission of
[O III]
![]() and O II
and O II
![]() lines are more concentrated in the central region of the nebula, while the emission of
lines are more concentrated in the central region of the nebula, while the emission of
![]() line is distributed in a larger area of the nebula.
line is distributed in a larger area of the nebula.
Figure 3 shows the spatial profiles for NGC 7009
of the
![]() abundances derived from recombination and
forbidden lines and of the ratio between these two abundance estimates.
The
abundances derived from recombination and
forbidden lines and of the ratio between these two abundance estimates.
The
![]() abundances derived from the O II
abundances derived from the O II
![]() recombination line are relatively constant along the nebular surface, while those derived
from the [O III]
recombination line are relatively constant along the nebular surface, while those derived
from the [O III]
![]() forbidden lines exhibit a strong
variation across the nebula. Consequently, the ratio
between the
forbidden lines exhibit a strong
variation across the nebula. Consequently, the ratio
between the
![]() abundances derived from recombination lines and those
from forbidden lines is not constant along the
nebular surface, decreasing smoothly from the center to the edges of the nebula (see Fig. 3, lower panel), which suggests that the discrepancy between abundances from permitted and forbidden lines is at least in part caused by a large scale spatial variation of some
physical proprieties of the nebula and not entirely explained by localized fluctuations of any property. Interestingly, the discrepancy between
abundances derived from recombination lines and those
from forbidden lines is not constant along the
nebular surface, decreasing smoothly from the center to the edges of the nebula (see Fig. 3, lower panel), which suggests that the discrepancy between abundances from permitted and forbidden lines is at least in part caused by a large scale spatial variation of some
physical proprieties of the nebula and not entirely explained by localized fluctuations of any property. Interestingly, the discrepancy between
![]() abundance from permitted and
forbidden lines is also not constant along the nebular surface of the planetary nebulae NGC 6720 (Garnett & Dinerstein 2001) and NGC 6153 (Liu et al. 2000). For these nebulae,
the differences in the
abundance from permitted and
forbidden lines is also not constant along the nebular surface of the planetary nebulae NGC 6720 (Garnett & Dinerstein 2001) and NGC 6153 (Liu et al. 2000). For these nebulae,
the differences in the
![]() abundances are higher in the central part of the nebulae and lower in the outer regions of the nebulae.
abundances are higher in the central part of the nebulae and lower in the outer regions of the nebulae.
![\begin{figure}
\par\includegraphics[width=8cm,clip]{4112fig2.eps}\end{figure}](/articles/aa/full/2006/16/aa4112-05/img273.gif) |
Figure 2:
Spatial profiles of the
|
| Open with DEXTER | |
![\begin{figure}
\par\includegraphics[width=8cm,clip]{4112fig3.eps}\end{figure}](/articles/aa/full/2006/16/aa4112-05/img274.gif) |
Figure 3:
Spatial profiles of the
|
| Open with DEXTER | |
![\begin{figure}
\par\includegraphics[width=8cm,clip]{4112fig4.eps}\end{figure}](/articles/aa/full/2006/16/aa4112-05/img275.gif) |
Figure 4:
Ratio between the values of
|
| Open with DEXTER | |
We have looked for correlations between our
![]() abundance ratios and some
physical properties of NGC 7009 to explain these discrepancies. We found a relationship between the argon electron density estimate
abundance ratios and some
physical properties of NGC 7009 to explain these discrepancies. We found a relationship between the argon electron density estimate ![]() (Ar IV) and
(Ar IV) and
![]() abundance ratio, with the abundance discrepancy increasing with the electron density (see Fig. 4).
abundance ratio, with the abundance discrepancy increasing with the electron density (see Fig. 4).
One of the possible solutions to interpret the discrepancies between
![]() abundances estimated from recombination lines and forbidden lines is the presence of electron temperature variations in ionized nebulae
(Peimbert et al. 2004,1993; Esteban et al. 1998,1999; Ruiz et al. 2003). These temperature fluctuations were introduced by Peimbert (1967) and are usually characterized by the parameter t2, the mean square temperature variation over the observed volume. If we assume that the ionic abundances derived from recombination lines are correct,
we can estimate the t2 value needed to obtain the same ionic abundances from forbidden lines, using the expressions given by
Peimbert (1967) relating
abundances estimated from recombination lines and forbidden lines is the presence of electron temperature variations in ionized nebulae
(Peimbert et al. 2004,1993; Esteban et al. 1998,1999; Ruiz et al. 2003). These temperature fluctuations were introduced by Peimbert (1967) and are usually characterized by the parameter t2, the mean square temperature variation over the observed volume. If we assume that the ionic abundances derived from recombination lines are correct,
we can estimate the t2 value needed to obtain the same ionic abundances from forbidden lines, using the expressions given by
Peimbert (1967) relating
![]() to the t2and T0. We can obtain compatible estimates of
to the t2and T0. We can obtain compatible estimates of
![]() derived from recombination and
forbidden lines assuming a value of
derived from recombination and
forbidden lines assuming a value of
![]() for both planetary nebulae
NGC 3242 and NGC 7009.
for both planetary nebulae
NGC 3242 and NGC 7009.
Direct estimations of electron temperature fluctuations can be obtained through point-to-point measurements of the electron temperature across the nebula. In Paper I, we measured a temperature distribution with a variance relative to the mean corresponding to
![]() for NGC 3242 and
for NGC 3242 and
![]() for NGC 7009 from point-to-point measurements of [O III] electron temperature, which are much too low to have a significant impact on the determination of abundances derived from forbidden lines. However, as the temperature measured at any point is a mean value along the line of sight,
for NGC 7009 from point-to-point measurements of [O III] electron temperature, which are much too low to have a significant impact on the determination of abundances derived from forbidden lines. However, as the temperature measured at any point is a mean value along the line of sight,
![]() (O III) can only give a lower limit to t2. From the difference between the [O III] and Balmer electron temperatures we have found
t2= 0.057 for NGC 3242 and
t2= 0.027 for NGC 7009, which are about two and three times lower than the value required to obtain the same abundances from recombination and forbidden lines, for NGC 3242 and NGC 7009, respectively.
These differences between the [O III] and Balmer electron temperatures have
been suggested as evidence in support of the presence of electron temperature fluctuations in gaseous nebulae to explain the discrepancies in abundances (Liu & Danziger 1993; Peimbert 1967).
(O III) can only give a lower limit to t2. From the difference between the [O III] and Balmer electron temperatures we have found
t2= 0.057 for NGC 3242 and
t2= 0.027 for NGC 7009, which are about two and three times lower than the value required to obtain the same abundances from recombination and forbidden lines, for NGC 3242 and NGC 7009, respectively.
These differences between the [O III] and Balmer electron temperatures have
been suggested as evidence in support of the presence of electron temperature fluctuations in gaseous nebulae to explain the discrepancies in abundances (Liu & Danziger 1993; Peimbert 1967).
Other explanation that has been suggested is the presence of abundance inhomogeneities in the nebulae (Torres-Peimbert et al. 1990; Peimbert 1993; Liu et al. 2000). Liu et al. (2000) have produced models for NGC 6153 that consider the presence of hydrogen deficient clumps, which occupy a small fraction of the volume of the nebula. In these models the heavy element recombination lines are produced in a dense and cool region, while the forbidden lines are emitted in a hotter and less dense region. These models seem to reproduce well the intensities of the recombination and collisionally excited lines. However, according to Ruiz et al. (2003) and Peimbert et al. (2004), the similarities found between the widths and radial velocities of the O II and [O III] lines in the planetary nebulae NGC 5307 and NGC 5315, imply that these lines are produced in the same regions, in contradiction to the hypothesis of chemical inhomogeneities. Also, the models of Liu et al. (2000) fail to reproduce the low Balmer temperature observed.
Unfortunately, we did not find sufficient evidence from our data to explain the abundance discrepancies detected in NGC 7009 and NGC 3242. Detailed observational studies about spatial variations of abundances from recombination and forbidden lines in more objects could provide clues to solve this problem.
A study on the determination of the elemental abundances from collisional excited and permitted lines in the galactic planetary nebulae NGC 1535, NGC 2438, NGC 2440, NGC 3132, NGC 3242, NGC 6302, and NGC 7009 is presented. The data analyzed were obtained with long-slit spectrophotometry of high signal-to-noise ratio in the range of 3100 to 6900 Å.
We found that the
![]() estimates derived from recombination lines are about a factor of four and two higher than those derived from forbidden lines
for NGC 7009 and NGC 3242, respectively. The values
of
estimates derived from recombination lines are about a factor of four and two higher than those derived from forbidden lines
for NGC 7009 and NGC 3242, respectively. The values
of
![]() abundance estimated from different O II emission lines are similar to one another, both for NGC 3242 and NGC 7009. The differences between
abundance estimated from different O II emission lines are similar to one another, both for NGC 3242 and NGC 7009. The differences between
![]() ratios derived from recombination lines and from forbidden lines decrease smoothly from the center to the edges in NGC 7009; this suggests that the discrepancies
between the abundances from forbidden and permitted lines are at least in part caused by a large scale spatial variation of some physical proprieties of the nebula and not entirely explained by localized fluctuations of any single property. If we attribute these abundance differences to the presence of electron temperature fluctuations, a value of
ratios derived from recombination lines and from forbidden lines decrease smoothly from the center to the edges in NGC 7009; this suggests that the discrepancies
between the abundances from forbidden and permitted lines are at least in part caused by a large scale spatial variation of some physical proprieties of the nebula and not entirely explained by localized fluctuations of any single property. If we attribute these abundance differences to the presence of electron temperature fluctuations, a value of
![]() is
required. However, direct estimations of electron temperature fluctuations were obtained through point-to-point measurements of the electron temperature across
the nebula, with a variance relative to the mean corresponding to
is
required. However, direct estimations of electron temperature fluctuations were obtained through point-to-point measurements of the electron temperature across
the nebula, with a variance relative to the mean corresponding to
![]() for NGC 3242 and
for NGC 3242 and
![]() for NGC 7009 (Paper I), which are much low to have a significant impact on the determination of abundances
derived from forbidden lines.
for NGC 7009 (Paper I), which are much low to have a significant impact on the determination of abundances
derived from forbidden lines.
Acknowledgements
This work was partially supported by the Brazilian institutions CAPES, CNPQ, and LNA.
Table 1:
Dereddened relative line fluxes
![]() .
.