A&A 448, 433-438 (2006)
DOI: 10.1051/0004-6361:20042245
Local models of stellar convection
III. The Strouhal number
P. J. Käpylä1,2 -
M. J. Korpi3 -
M. Ossendrijver2
-
I. Tuominen1,3
1 - Astronomy Division, Department of Physical Sciences,
PO Box 3000, 90014 University of Oulu, Finland
2 - Kiepenheuer-Institut für Sonnenphysik,
Schöneckstrasse 6, 79104 Freiburg, Germany
3 - Observatory, PO Box 14, 00014 University of Helsinki,
Finland
Received 25 October 2004 / Accepted 9 November 2005
Abstract
Aims. The Strouhal number (St), which is a nondimensional measure of the correlation time, is determined from numerical models of convection. The Strouhal number arises in the mean-field theories of angular momentum transport and magnetic field generation, where its value determines the validity of certain widely used approximations, such as the first order smoothing (hereafter FOSA). More specifically, the relevant transport coefficients can be calculated by means of a cumulative series expansion if
 .
.
Methods. We define the Strouhal number as the ratio of the correlation and turnover times, which we determine separately, the former from the autocorrelation of velocity, and the latter by following test particles embedded in the flow.
Results. We find that the Strouhal numbers are, generally, of the order of 0.1 to 0.4 which is close to the critical value above which deviations from FOSA become significant. Increasing the rotational influence tends to shorten both timescales in such a manner that St decreases. However, we do not find a clear trend as a function of the Rayleigh number for the parameter range explored in the present study.
Key words: hydrodynamics
The mean-field theories of angular momentum transport
(e.g. Rüdiger 1980, 1989) and
hydromagnetic dynamos (e.g. Steenbeck & Krause 1969;
Krause & Rädler 1980) require knowledge of the
Reynolds stresses and the mean electromotive force,
respectively. Direct analytical calculation of these quantities for
astrophysical purposes is not possible at present due to the lack of
an established theory of turbulence. Numerical calculations are not
much better off since in most astrophysical systems the
computational resources needed in order to resolve all physically
relevant scales are several orders of magnitude larger than
currently available.
In mean-field theories these problems are circumvented by relating
the Reynolds stresses and electromotive force to the mean quantities
(the rotation vector
 and the mean magnetic field
 ,
respectively) and their gradients by
means of a cumulative series expansion (see van Kampen
1974a,b). In the best known and
most often used approach, the first order smoothing approximation
(FOSA), only the first terms of these expansions are taken into
account. This approach can be shown to be valid if either the
relevant Reynolds number,
,
respectively) and their gradients by
means of a cumulative series expansion (see van Kampen
1974a,b). In the best known and
most often used approach, the first order smoothing approximation
(FOSA), only the first terms of these expansions are taken into
account. This approach can be shown to be valid if either the
relevant Reynolds number,
 ,
or the Strouhal number
,
or the Strouhal number
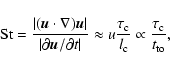 |
(1) |
is sufficiently small. Above, u and l are the typical velocity
and length scales, and
 and
and  are the
correlation time and length of the turbulence, respectively. We show
in Sect. 3.3 that
are the
correlation time and length of the turbulence, respectively. We show
in Sect. 3.3 that
 .
Only the case of small
.
Only the case of small  is relevant in astrophysical
circumstances, where typically Re, Rm
is relevant in astrophysical
circumstances, where typically Re, Rm  1. Hence the condition
 should be fulfilled if FOSA is to be valid in stellar
convection zones. If this is not the case then FOSA is likely to be
too crude a truncation but, as long as St is smaller than the
critical value for convergence it is possible to construct
higher-order mean-field theories by including more terms of the
cumulant expansion. However, a universal critical value of St for
convergence of the cumulant expansion does not exist because this
depends on the geometry of the problem and on the flow itself. In
general though, the critical value is thought to be less than unity.
For simple turbulence models it is possible to compute it; Nicklaus
& Stix (1988, hereafter NS88) obtained
should be fulfilled if FOSA is to be valid in stellar
convection zones. If this is not the case then FOSA is likely to be
too crude a truncation but, as long as St is smaller than the
critical value for convergence it is possible to construct
higher-order mean-field theories by including more terms of the
cumulant expansion. However, a universal critical value of St for
convergence of the cumulant expansion does not exist because this
depends on the geometry of the problem and on the flow itself. In
general though, the critical value is thought to be less than unity.
For simple turbulence models it is possible to compute it; Nicklaus
& Stix (1988, hereafter NS88) obtained
 for their model. Furthermore, the results of NS88 show
that the higher order effects remain small in comparison to the FOSA
result when
for their model. Furthermore, the results of NS88 show
that the higher order effects remain small in comparison to the FOSA
result when
 .
.
It is well-known that the requirement for a small Reynolds number is
not satisfied in stellar environments. However, the question of the
Strouhal number is not settled. On account of the observations of
the solar surface granulation, one can estimate the correlation and
turnover times to be roughly equal, indicating that
 at the solar surface (see e.g. Chap. 6 of Stix
2002). Similar values can also be estimated for
supergranulation for which typical numbers are
at the solar surface (see e.g. Chap. 6 of Stix
2002). Similar values can also be estimated for
supergranulation for which typical numbers are
 m s-1,
 m, and
 s. However, even for granulation the precise value has, to our
knowledge, not been established, and nothing is known about St in
the deeper layers. Furthermore, recent results from forced
turbulence calculations indicate that if the higher order
correlations in the equations of the passive scalar flux
(Brandenburg et al. 2004, hereafter BKM) and
electromotive force (Brandenburg & Subramanian 2005)
are taken into account via the so-called minimal
s. However, even for granulation the precise value has, to our
knowledge, not been established, and nothing is known about St in
the deeper layers. Furthermore, recent results from forced
turbulence calculations indicate that if the higher order
correlations in the equations of the passive scalar flux
(Brandenburg et al. 2004, hereafter BKM) and
electromotive force (Brandenburg & Subramanian 2005)
are taken into account via the so-called minimal
 -approximation (Blackman & Field 2002,
2003), the Strouhal number can be seen to
substantially exceed unity and roughly equal to unity, respectively.
-approximation (Blackman & Field 2002,
2003), the Strouhal number can be seen to
substantially exceed unity and roughly equal to unity, respectively.
Although forced turbulence is rather different in comparison to
convection, the aforementioned studies still raise the question
whether the results of the convection calculations can be
interpreted within the framework of the standard mean-field theory
as has been done in numerous studies during recent years
(e.g. Brandenburg et al. 1990; Pulkkinen et
al. 1993; Ossendrijver et al. 2001,
2002; Käpylä et al. 2004; Rüdiger et al.
2005). Motivated by the unknown status of the
Strouhal number for convection and the previous studies on the
subject in different contexts, we set out to calculate St from
numerical calculations of convection. In order to do this, we
calculate the correlation time from the autocorrelation of velocity
and determine the turnover time by following test particles embedded
into the flow and define the Strouhal number as the ratio of the
two.
The remainder of the paper is organised as follows:
Sect. 2 summarises briefly the numerical model used
and in Sect. 3 the results of the study are
discussed. Finally, Sect. 4 gives the conclusions.
2 The model
A detailed description of the convection model can be found in
Käpylä et al. (2004, hereafter Paper I) and the
convection calculations are made with a setup identical to that used
in Paper I. See Table 1 for a summary of the main
parameters.
For the purposes of the present study we have added the possibility
to follow the trajectories of Lagrangian test particles in the
model. In order to integrate the trajectory we need the
velocity at the position of the test particle at each integration
step. This is done by finding the grid points
(nx,ny,nz) next
to the test particle and using linear interpolation to obtain the
velocity at the correct position
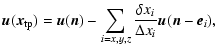 |
|
|
(2) |
where
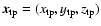 is the
position vector of the test particle,
is the
position vector of the test particle,
 denotes the grid point next to the test particle,
  the
unit vector in direction i,
the
unit vector in direction i,
 the
distance between the test particle and the grid point next to it,
and
the
distance between the test particle and the grid point next to it,
and
 the grid spacing in direction i. In the present
calculations we follow one thousand test particles that are
introduced at the middle of the convectively unstable layer at
random horizontal positions after convection has reached a
statistically stationary state.
the grid spacing in direction i. In the present
calculations we follow one thousand test particles that are
introduced at the middle of the convectively unstable layer at
random horizontal positions after convection has reached a
statistically stationary state.
The calculations were made with a modified version of the numerical
method described in Caunt & Korpi (2001). The
calculations were carried out on the KABUL and BAGDAD Beowulf
clusters at the Kiepenheuer-Institut für Sonnenphysik, Freiburg,
Germany, and on the IBM eServer Cluster 1600 supercomputer hosted by
CSC Scientific Computing Ltd., in Espoo, Finland.
Table 1:
Summary of the calculations and the main
parameters. From left to right: the Rayleigh, Reynolds, Taylor,
and Coriolis numbers, the latitude, and the grid size.
3 Results
3.1 Correlation time
We determine the correlation time from the velocity autocorrelation
function
![$\displaystyle C[u_{i}(\vec{x},t_0),u_{i}(\vec{x},t)] = \frac{\langle u_{i}(\vec...
...\sqrt{\langle u_{i}^2(\vec{x},t_0) \rangle
\langle u_{i}^2(\vec{x},t)\rangle}},$](/articles/aa/full/2006/11/aa2245-04/img41.gif) |
|
|
(3) |
where i denotes the velocity component used, t0 and t are the
times from which the snapshots were taken, and the brackets denote
horizontal averaging. We estimate the correlation time,
,
to be the time after which the correlation drops below a
fixed threshold value, in this case 0.5. However, the correlation
time still depends on depth, and there are discrete time intervals
between the stored snapshots (see Fig. 1). To remedy
the latter, we calculate the correlation time within the convection
zone for each depth and use linear interpolation to find a more
accurate value for the time when C = 0.5. Furthermore, it makes
sense to average the correlation time over the convectively unstable
layer since convection is more of a global rather than local nature
with the present parameters (see Fig. 3). To check
the time dependence of
we calculate it with respect
to about two hundred snapshots for each calculation. The final
correlation time is an average of these individual values.
![\begin{figure}
\par\includegraphics[width=8.8cm,clip]{2245fig1.eps} \end{figure}](/articles/aa/full/2006/11/aa2245-04/Timg42.gif) |
Figure 1:
Horizontally averaged correlations of  with
respect to the snapshot at t = 100 for the run Co0. Each
curve is separated by
with
respect to the snapshot at t = 100 for the run Co0. Each
curve is separated by
 in time units of
 . . |
| Open with DEXTER |
Figure 1 gives an example from run Co0, showing the
horizontally averaged correlations of the vertical velocity uz from twelve snapshots, each separated by one time unit, with respect
to the snapshot at t0 = 100. The correlation diminishes
monotonically as a function of time and for the eleventh snapshot
the correlation is below 0.5 in the whole convection zone. Using the
procedure described above, we find the correlation time to be
 for this snapshot (average over the
correlation times with respect to 206 different snapshots gives a
value 9.4, see the third column of Table 2). If
the correlation is calculated for one of the horizontal velocity
components,
is similar in magnitude, except near the
surface and in a layer immediately below the convection zone where
it is somewhat longer than the one calculated from the vertical
velocity. This effect can be understood to arise from the persistent
horizontal flows near the boundaries of the convection zone where
the up- and downflows diverge to the horizontal directions. In what
follows we estimate the correlation time from the vertical velocity,
for which
remains more or less constant within the
convection zone as indicated by Fig. 1. As stated
above, our final result is an average over snapshots and the
corresponding standard deviations of the correlation times are given
in Table 2.
for this snapshot (average over the
correlation times with respect to 206 different snapshots gives a
value 9.4, see the third column of Table 2). If
the correlation is calculated for one of the horizontal velocity
components,
is similar in magnitude, except near the
surface and in a layer immediately below the convection zone where
it is somewhat longer than the one calculated from the vertical
velocity. This effect can be understood to arise from the persistent
horizontal flows near the boundaries of the convection zone where
the up- and downflows diverge to the horizontal directions. In what
follows we estimate the correlation time from the vertical velocity,
for which
remains more or less constant within the
convection zone as indicated by Fig. 1. As stated
above, our final result is an average over snapshots and the
corresponding standard deviations of the correlation times are given
in Table 2.
In principle, the correlation length of the turbulence can be
determined from Eq. (3) using
 as the argument instead of the time. In order to do
this, we choose one thousand random grid points within the
convectively unstable layer and compute the crosscorrelations of the
velocities between all the points. We do this procedure for the same
snapshots from which the correlation times were calculated, and
average over all snapshots. Due to the finite spatial resolution of
the calculations the smallest distance between two points cannot be
smaller than the grid spacing. Thus the correlations are binned,
each bin covering a range
as the argument instead of the time. In order to do
this, we choose one thousand random grid points within the
convectively unstable layer and compute the crosscorrelations of the
velocities between all the points. We do this procedure for the same
snapshots from which the correlation times were calculated, and
average over all snapshots. Due to the finite spatial resolution of
the calculations the smallest distance between two points cannot be
smaller than the grid spacing. Thus the correlations are binned,
each bin covering a range
 .
A characteristic
result is shown in Fig. 2, where the correlations
from runs with different Coriolis numbers at the southern pole are
presented. The main conclusion is that the correlation diminishes
faster as a function of r when rotation is more rapid, implying that
decreases as a function of rotation. There is, however,
a problem of how exactly to define .
Due to the binning
the average correlation in the bin with the smallest r varies from
one calculation to the other, and setting a fixed threshold value
would be more arbitrary than in the case of the correlation time. We
see that a reasonable solution to bypass this problem is to use test
particles in order to determine the turnover time,
.
A characteristic
result is shown in Fig. 2, where the correlations
from runs with different Coriolis numbers at the southern pole are
presented. The main conclusion is that the correlation diminishes
faster as a function of r when rotation is more rapid, implying that
decreases as a function of rotation. There is, however,
a problem of how exactly to define .
Due to the binning
the average correlation in the bin with the smallest r varies from
one calculation to the other, and setting a fixed threshold value
would be more arbitrary than in the case of the correlation time. We
see that a reasonable solution to bypass this problem is to use test
particles in order to determine the turnover time,
 ,
that captures the changing spatial
scale of convection as a function of rotation.
,
that captures the changing spatial
scale of convection as a function of rotation.
![\begin{figure}
\par\includegraphics[width=7.8cm,clip]{2245fig2.eps} \end{figure}](/articles/aa/full/2006/11/aa2245-04/Timg47.gif) |
Figure 2:
Velocity autocorrelations for uz as functions
of r and rotation for the runs indicated in the legend. |
| Open with DEXTER |
3.3 Turnover time
The turnover time is usually estimated by dividing a characteristic
length scale by a characteristic velocity. For convection
calculations one often uses the depth of the convection zone divided
by the volume-averaged rms velocity, i.e.
 |
(4) |
where the superscript s refers to "simple estimate''. For example,
for the Co0 run,
 and d = 1, giving
 .
Using this estimate with
.
Using this estimate with
 would indicate that St is approximately
0.8. Although this simple method probably gives the correct order of
magnitude of the turnover time, it is still quite a crude estimate
since the values for the typical scales and velocities are rather
uncertain and vary nonlinearly as function of rotation and Rayleigh
number (see below). Thus a more precise way of calculation is
desirable.
would indicate that St is approximately
0.8. Although this simple method probably gives the correct order of
magnitude of the turnover time, it is still quite a crude estimate
since the values for the typical scales and velocities are rather
uncertain and vary nonlinearly as function of rotation and Rayleigh
number (see below). Thus a more precise way of calculation is
desirable.
![\begin{figure}
\par\includegraphics[width=7.9cm,clip]{2245fig3.eps} \end{figure}](/articles/aa/full/2006/11/aa2245-04/Timg52.gif) |
Figure 3:
Vertical positions of two test particles in the run
Co0. The dotted vertical lines denote the times where the
particle denoted by the solid line changes direction from
downward motion to upward motion. The dash-dotted line shows a
particle which is stuck in the lower overshoot layer for the
whole duration of the calculation. |
| Open with DEXTER |
A way to improve the estimate given by Eq. (4) is
to follow the trajectories of Lagrangian test particles in the flow.
This is done by finding the times where a particle changes its
direction, i.e. turns over. Thus, one turnover time would be the
time between two consecutive turns to the same direction, e.g. from
downward motion to upward motion. The advantage of this method is
that the assumption of the vertical scale of convection is removed.
However, the danger with this method is that the smallest scales
begin to dominate due to, for example, contributions from particles
stuck in the stable layer. This problem is discussed below.
Table 2:
From left to right: rms-velocity averaged over the
convectively unstable region and time, correlation time from the
autocorrelation of the vertical velocity, turnover time from
test particle trajectories, and the Strouhal number. The last
column states the number of snapshots with respect to which the
correlation times and lengths were calculated.
Figure 3 shows the trajectories of two test particles
in the run Co0. The solid line shows a particle which is carried by
the convective flow throughout the calculation (the particles were
introduced in the flow at t = 60). In the figure we only denote
the turnovers from downward to upward motion, but including also the
opposite changes of direction a total of 21 turnovers are
registered. Figure 4 shows a histogram of the
registered turnover times from run Co0. In total, the thousand
particles make 21 300 individual turnovers in the course of the
calculation. The distribution is centered near 20 having an
exponential tail towards longer times. Arithmetic average over the
distributions shown in Fig. 4 gives a turnover time
 ,
which indicates that the Strouhal number to
be significantly less than 0.8 which was obtained with the simple
estimate of the turnover time.
,
which indicates that the Strouhal number to
be significantly less than 0.8 which was obtained with the simple
estimate of the turnover time.
The test particle method takes into account the variable spatial
scale of convection but it also picks up the small scale turnovers
in the stable layer. A small number of particles get stuck in the
lower overshoot layer for a long time and some even stay there for
the complete duration of the calculation (the dash-dotted line in
Fig. 3) and contribute a large number of small
turnover times. These particles, however, have only a small effect
on the estimate of
 for the nonrotating and slowly
rotating cases where the turnover time might be slightly
underestimated.
for the nonrotating and slowly
rotating cases where the turnover time might be slightly
underestimated.
![\begin{figure}
\par\includegraphics[width=7.8cm,clip]{2245fig4.eps} \end{figure}](/articles/aa/full/2006/11/aa2245-04/Timg72.gif) |
Figure 4:
Distribution of turnover times from run the Co0 with the
test particle method. |
| Open with DEXTER |
From Fig. 2 and the second column of Table 2 we can determine that whilst
decreases as a function of rotation, a similar trend is visible in
 .
Thus we would expect that the ratio
.
Thus we would expect that the ratio
 not to vary much as a function of Co. This is indeed the trend
that we observe for
which seems to support the
conjecture that
not to vary much as a function of Co. This is indeed the trend
that we observe for
which seems to support the
conjecture that
 .
.
![\begin{figure}
\par\includegraphics[width=16.8cm,clip]{2245fig5.eps} \end{figure}](/articles/aa/full/2006/11/aa2245-04/Timg75.gif) |
Figure 5:
The correlation time
( left) and the
Strouhal number
( right) functions of the Coriolis
number. Powerlaws
 and
and
 are plotted. The stars,
diamonds, triangles, and squares represents the calculations at
latitudes
are plotted. The stars,
diamonds, triangles, and squares represents the calculations at
latitudes
 (equator),
 , ,
 ,
and ,
and
 (south pole), respectively.
 |
| Open with DEXTER |
We have made a set of runs varying the Rayleigh number from
 to 106, denoted by lCo0, Co0, mCo0, and hCo0 in Table 2. With the test particle method
decreases slightly as a function of Ra which can be explained by the
fact that contributions of smaller scales are now resolved in the
model leading to a shorter correlation length, indications of which
are also visible in the velocity autocorrelations. However, we do
not find any significant trend in the correlation time as function
of Ra. It follows that with the present definition the Strouhal
number saturates a value approximately 0.4. This behaviour is
similar to the Reynolds number independence of the Strouhal number
found by Brandenburg et al. (2004).
to 106, denoted by lCo0, Co0, mCo0, and hCo0 in Table 2. With the test particle method
decreases slightly as a function of Ra which can be explained by the
fact that contributions of smaller scales are now resolved in the
model leading to a shorter correlation length, indications of which
are also visible in the velocity autocorrelations. However, we do
not find any significant trend in the correlation time as function
of Ra. It follows that with the present definition the Strouhal
number saturates a value approximately 0.4. This behaviour is
similar to the Reynolds number independence of the Strouhal number
found by Brandenburg et al. (2004).
3.3.2 Effects of rotation
In Paper I, we have shown that the efficiency of convection and
overshooting is reduced as rotation increases. The latter effect
indirectly indicates that the spatial scale of convection decreases,
which could lead to shorter turnover time if the overall velocities
are less affected. The decreasing horizontal scale of convection as
a function of rotation can be seen for example in Fig. 4 of Paper
I. In order to study the effects of rotation on the Strouhal number
we have made three sets of calculations with varying rotational
influence. We denote these runs by the prefix Co01, Co1, and Co10,
which correspond to the approximate Coriolis numbers 0.1, 1, and 10
in the runs (the actual values of Co achieved in the calculations
vary, see Table 1). We also probe the latitudinal
dependence by making calculations at latitudes
,
,
,
and
for each rotation rate. The correlation
and turnover times, and the resulting Strouhal numbers for all the
calculations are presented in Table 2.
For the slowest rotation, we find little differences to the
nonrotating case Co0 which was discussed above. Also the variation
of the timescales as function of latitude is small in comparison to
the variation within individual runs. For the Co1 set the
correlation time is markedly shorter (about 6-7 time units as
opposed to 9-10 in the run Co0 and the Co01 set). This can be
explained by the deflection of the vertical flows by the Coriolis
force, leading to smaller vertical scale of convection which tends
to shorten the correlation time. Support for this conjecture is
given by the decrease of the turnover time from the test
particles. A similar decrease in correlation time is noted to occur
also if it is estimated from the horizontal velocities.
For the most rapidly rotating case, Co10, the trend of decreasing
spatial scales continues. This is manifested in the clearly shorter
turnover time
as opposed to the more slowly rotating
runs discussed above. Here, it is also important to note the
misleading value of the turnover time given by the simple method,
Eq. (4). Whereas
 increases with
rotation due to the smaller velocities in general, the actual
turnover time decreases due to the smaller spatial scale of
convection. As for the correlation time, the strong Coriolis forces
tend to disrupt the cellular structure of the convection rapidly
resulting in a shorter
.
Considering the Strouhal
number, the decrease in
overweights the decrease of
the turnover time so that the actual value of St decreases as well.
increases with
rotation due to the smaller velocities in general, the actual
turnover time decreases due to the smaller spatial scale of
convection. As for the correlation time, the strong Coriolis forces
tend to disrupt the cellular structure of the convection rapidly
resulting in a shorter
.
Considering the Strouhal
number, the decrease in
overweights the decrease of
the turnover time so that the actual value of St decreases as well.
We find that
is more or less consistent with a powerlaw
as a function of the Coriolis number for
moderate and rapid rotation (see Fig. 5).
The relatively large values of
raise question of the validity of
the first order smoothing approximation. To our knowledge, this
question has been considered only by NS88, who derive a fourth order
correlation approximation from which they derive the transport
coefficient responsible for the generation ( -effect) and
diffusion of the mean magnetic field for homogenuous and isotropic
turbulence for which the velocity field and the correlation time is
known. Their results indicate that the fourth order contributions,
become comparable to the second order effects, i.e. the FOSA result,
if the Strouhal number is of the order 0.5 or larger and that the
cumulative expansion fails to converge if
-effect) and
diffusion of the mean magnetic field for homogenuous and isotropic
turbulence for which the velocity field and the correlation time is
known. Their results indicate that the fourth order contributions,
become comparable to the second order effects, i.e. the FOSA result,
if the Strouhal number is of the order 0.5 or larger and that the
cumulative expansion fails to converge if
 .
In this light
our results would indicate that one should be cautious in applying
FOSA in the interpretation of the present convection
calculations. Direct testing of this, however, requires that we
compare analytical mean-field expressions of the relevant transport
coefficients to the numerical results. Preliminary results indicate
that the correlation time needed to fit the numerical data is
significantly shorter than that measured from the velocity
autocorrelation function (see Käpylä et al. 2005).
.
In this light
our results would indicate that one should be cautious in applying
FOSA in the interpretation of the present convection
calculations. Direct testing of this, however, requires that we
compare analytical mean-field expressions of the relevant transport
coefficients to the numerical results. Preliminary results indicate
that the correlation time needed to fit the numerical data is
significantly shorter than that measured from the velocity
autocorrelation function (see Käpylä et al. 2005).
4 Conclusions
We estimate the nondimensional measure of the correlation time,
the Strouhal number, from numerical models of convection. We
calculate the correlation and turnover times separately from the
velocity autocorrelation function and the trajectories of embedded
test particles, respectively, and define the Strouhal number as the
ratio of the two.
The Strouhal number arises in the mean-field theories of angular
momentum transport and hydromagnetic dynamos where its value
determines the validity of certain widely used approximations, such
as the first order smoothing. These approximations are based on a
cumulative series expansion of the relevant turbulent correlation,
e.g. the electromotive force in the dynamo theory. Essentially, the
higher order terms in this expansion are proportional to the
Strouhal number. Thus the value of St determines whether or not the
expansion converges.
The main results can be summarised as follows:
Our inability to find any dependence on the Rayleigh number and the
relatively high values (
 )
of the Strouhal number
raise the question of the validity of FOSA. In the study of NS88,
although not from a directly comparable context, the higher order
effects became visible when St was of similar magnitude. At the
moment, we cannot draw a firm conclusion whether or not it is safe
to use FOSA or not. We think that the next step in the direction of
determining this would be to develop mean-field expressions for the
transport coefficients that are directly applicable to the present
numerical calculations. Furthermore, these expressions should be
derived using FOSA and preferably also with some higher order
expansion in order to determine which of them gives a better
description of the numerical result, and, more importantly, whether
the whole concept of the cumulative expansion is applicable. This
study, however, does not fit in the scope of the present paper.
)
of the Strouhal number
raise the question of the validity of FOSA. In the study of NS88,
although not from a directly comparable context, the higher order
effects became visible when St was of similar magnitude. At the
moment, we cannot draw a firm conclusion whether or not it is safe
to use FOSA or not. We think that the next step in the direction of
determining this would be to develop mean-field expressions for the
transport coefficients that are directly applicable to the present
numerical calculations. Furthermore, these expressions should be
derived using FOSA and preferably also with some higher order
expansion in order to determine which of them gives a better
description of the numerical result, and, more importantly, whether
the whole concept of the cumulative expansion is applicable. This
study, however, does not fit in the scope of the present paper.
Acknowledgements
P.J.K. acknowledges the financial support from the Finnish graduate
school of astronomy and space physics and travel support from the
Kiepenheuer intitute. P.J.K. thanks NORDITA and its staff for their
hospitability during his visit. M.J.K. acknowledges the hospitality of
LAOMP, Toulouse and the Kiepenheuer-Institut, Freiburg during her
visits, and the Academy of Finland project 203366. Travel support
from the Academy of Finland grant 43039 is acknowledged. The authors
thank Axel Brandenburg and Michael Stix for their useful comments on
the manuscript and Wolfgang Dobler for illuminating discussions. The
anonymous referee is acknowledged for the helpful comments on the
manuscript.
-
Blackman, E. G., & Field, B. G. 2002, Phys. Rev. Lett., 89,
265007 [NASA ADS] [CrossRef] (In the text)
-
Blackman, E. G., & Field, B. G. 2003, Phys. Fluids, 15,
L73 [NASA ADS] [CrossRef] (In the text)
- Brandenburg, A.,
Tuominen, I., Nordlund, Å., Pulkkinen, P., & Stein, R. F.
1990, A&A, 232, 277 [NASA ADS] (In the text)
- Brandenburg, A.,
Käpylä, P. J., & Mohammed, A. 2004, Phys. Fluids, 16,
1020 [NASA ADS] [CrossRef] (In the text)
- Brandenburg,
A., & Subramanian, K. 2005, A&A, 439, 835 [EDP Sciences] [NASA ADS] [CrossRef] (In the text)
- Caunt, S. E., &
Korpi, M. J. 2001, A&A, 369, 706 [EDP Sciences] [NASA ADS] [CrossRef] (In the text)
- Chan, K. L. 2001, ApJ,
548, 1102 [NASA ADS] [CrossRef]
- Käpylä,
P. J., Korpi, M. J., & Tuominen, I. 2004, A&A, 422, 793 [EDP Sciences] [NASA ADS] [CrossRef]
(Paper I)
(In the text)
- Käpylä,
P. J., Korpi, M. J., Ossendrijver, M., & Tuominen, I. 2005, AN,
326, 186 [NASA ADS] (In the text)
- Krause, F., &
Rädler, K.-H. 1980, Mean-Field Electrodynamics and Dynamo
Theory (Berlin: Akademie-Verlag)
(In the text)
- Nicklaus, B.,
& Stix, M. 1988, Geophys. Astrophys. Fluid Dynamics, 43, 149
(NS88)
(In the text)
- Ossendrijver, M.,
Stix, M., & Brandenburg, A. 2001, A&A, 376, 726 [NASA ADS] (In the text)
- Ossendrijver, M.,
Stix, M., Brandenburg, A., & Rüdiger, G. 2002, A&A,
394, 735 [EDP Sciences] [NASA ADS] [CrossRef] (In the text)
- Pulkkinen, P.,
Tuominen, I., Brandenburg, A., Nordlund, Å., & Stein, R.
F. 1993, A&A, 267, 265 [NASA ADS] (In the text)
- Rüdiger, G.
1980, Geophys. Astrophys. Fluid Dyn., 16, 239 [NASA ADS] (In the text)
- Rüdiger, G.
1989, Differential rotation and stellar convection: Sun and
solar-type stars (Berlin: Akademie-Verlag)
(In the text)
-
Rüdiger, G., Egorov, P., Kitchatinov, L. L., & Küker,
M. 2005, A&A, 431, 345 [EDP Sciences] [NASA ADS] [CrossRef] (In the text)
- Steenbeck,
M., & Krause, F. 1969, AN, 291, 49 [NASA ADS] (In the text)
- Stix, M. 2002, The Sun:
An introduction, Second edition (Berlin, Heidelberg, New York:
Springer-Verlag)
(In the text)
- van
Kampen, N. G. 1974a, Physica, 74, 215 [CrossRef] (In the text)
- van
Kampen, N. G. 1974b, Physica, 74, 239 [CrossRef]
Copyright ESO 2006
![\begin{figure}
\par\includegraphics[width=8.8cm,clip]{2245fig1.eps} \end{figure}](/articles/aa/full/2006/11/aa2245-04/img42.gif)
![\begin{figure}
\par\includegraphics[width=7.8cm,clip]{2245fig2.eps} \end{figure}](/articles/aa/full/2006/11/aa2245-04/img47.gif)
![\begin{figure}
\par\includegraphics[width=7.9cm,clip]{2245fig3.eps} \end{figure}](/articles/aa/full/2006/11/aa2245-04/img52.gif)
![\begin{figure}
\par\includegraphics[width=7.8cm,clip]{2245fig4.eps} \end{figure}](/articles/aa/full/2006/11/aa2245-04/img72.gif)
![\begin{figure}
\par\includegraphics[width=16.8cm,clip]{2245fig5.eps} \end{figure}](/articles/aa/full/2006/11/aa2245-04/img75.gif)