A&A 447, 769-781 (2006)
DOI: 10.1051/0004-6361:20034226
F. Pajot1 - B. Stepnik1 - J.-M. Lamarre2 - J.-P. Bernard3 - X. Dupac34 - M. Giard3 - G. Lagache1 - B. Leriche1 - C. Meny3 - G. Recouvreur1 - J.-C. Renault5 - C. Rioux1 - I. Ristorcelli3 - G. Serra3 - J.-P. Torre6
1 - Institut d'Astrophysique Spatiale (IAS), Bât. 121,
Université Paris-Sud 11 and CNRS (UMR8617), 91405 Orsay, France
2 -
LERMA, CNRS, Observatoire de Paris, 61 av. de l'Observatoire,
75014 Paris, France
3 -
Centre d'Étude Spatiale des Rayonnements, CNRS,
9 av. du Colonel Roche, BP 4346, 31028 Toulouse, France
4 -
ESA-ESTEC, Astrophysics Division, Keplerlaan 1, 2201 AZ Noordwijk, The
Netherlands
5 - Institut d'Astrophysique de Paris, CNRS, 98 bis bd.
Arago, 75014 Paris, France
6 -
Service d'Aéronomie, CNRS, BP 3, 91371 Verrières
Le Buisson, France
Received 25 August 2003 / Accepted 14 October 2005
Abstract
Aims. PRONAOS is a stratospheric balloon-borne project dedicated to submillimeter astronomy. Sensitive to low emission gradients, PRONAOS allowed pointed observations in four photometric bands between 200 ![]() m and 1.2 mm with an angular resolution of 2
m and 1.2 mm with an angular resolution of 2![]() to 3.5
to 3.5![]() .
We present here the PRONAOS calibration strategy and the accuracy achieved.
.
We present here the PRONAOS calibration strategy and the accuracy achieved.
Methods. An absolute calibration scheme based on an Internal Calibration System provided original photometric data. The accurate determination of the spectral dependence of the measured fluxes is a key to the understanding of the cold universe.
Results. We demonstrate that the PRONAOS absolute photometric accuracy is 8% (1-![]() )
and that the channel to channel relative accuracy is 6% (1-
)
and that the channel to channel relative accuracy is 6% (1-![]() ). This calibration is checked against observations of Saturn. We show that the PRONAOS calibration is in good agreement with the present knowledge of the Saturn submillimeter emission. PRONAOS observations also agrees with the observations of several compact and extended sources by the COBE/DIRBE or the ISOPHOT instruments.
). This calibration is checked against observations of Saturn. We show that the PRONAOS calibration is in good agreement with the present knowledge of the Saturn submillimeter emission. PRONAOS observations also agrees with the observations of several compact and extended sources by the COBE/DIRBE or the ISOPHOT instruments.
Key words: submillimeter - techniques: photometric - standards - balloons - planets and satellites: individual: Saturn
Absolute calibration to the level of a few percent in the
submillimeter range (100 ![]() m to 1 mm) needs careful instrument
design and characterisation. Two major physical effects make the
calibration a difficult process in this range.
m to 1 mm) needs careful instrument
design and characterisation. Two major physical effects make the
calibration a difficult process in this range.
First, all components along the optical path radiate a submillimeter thermal emission which is several order of magnitude larger than the astrophysical signal. The total power received by the detectors is therefore dominated by a strong background emission whose control and knowledge are required to carry out the appropriate response corrections. The background emission can be dramatically reduced using appropriate techniques. The instrument is usually cooled down to very low temperatures (between a few and a few tenth of Kelvin) reducing both the thermal emission and the associated photon noise. Optical modulation such as chopping and nodding can be used to extract the astrophysical signal from the background due to the telescope and to the atmosphere. However, these techniques increase the calibration and operational complexity.
Second, the dimensions of optical components are not very
large compared to the wavelength. Large diffraction effects are
difficult to model or measure but need to be characterized for the
determination of the optical efficiency and the far sidelobes. These
two physical effects contribute to make submillimeter photometry among
the least accurate astronomical measurements. The accuracy of
absolute submillimeter calibrations is generally not better than 10%,
and often much poorer, leading to poor photometric standards in this
range. An important exception is the FIRAS instrument on the COBE
satellite, which achieved an excellent absolute calibration accuracy
of 3% (Fixsen et al. 1997) thanks to space conditions and
the use of movable external blackbody filling the whole beam.
However, FIRAS had a very small collecting optics diameter (less than
15 cm) giving a poor angular resolution (7![]() )
and this method
cannot be used for a large diameter telescope with better angular
resolution, such as PRONAOS .
)
and this method
cannot be used for a large diameter telescope with better angular
resolution, such as PRONAOS .
PRONAOS ("PROgramme National d'AstrOnomie Submillimétrique'') is a
stratospheric balloon borne project devoted to submillimeter
astronomy. PRONAOS carries a two meter telescope and measures the
submillimeter continuum emission in four large photometric bands with
an angular resolution from 2![]() to 3.5
to 3.5![]() (FWHM).
Ground and on-board blackbodies and a physical model of the telescope
were used to calibrate the PRONAOS experiment. This provided an
absolute calibration to point and extended sources without using any
prior observations with other instruments or sky modelling. The
calibration accuracy achieved for the PRONAOS experiment is 6% in
relative (band to band) and 8% in absolute, as derived further in
this paper. As of today, this is the best calibration accuracy obtained for
a large diameter telescope observing in the submillimeter range. Such
an accuracy was essential to the scientific analysis of the PRONAOS
data on the Sunyaev-Zel'dovich (SZ) effect (Lamarre et al.
1998), and on the interstellar medium emission
(Ristorcelli et al. 1998; Bernard et al.
1999; Dupac et al. 2001; Stepnik et al.
2003; Dupac et al. 2002; Serra et al.
2002; Dupac et al. 2003) for which fine spectral
variations and the absolute intensity of the interstellar medium
emission were analysed. The absolute calibration accuracy of the
PRONAOS project is one of its major strength. This paper describes the
calibration scheme of the experiment and quantifies its accuracy.
(FWHM).
Ground and on-board blackbodies and a physical model of the telescope
were used to calibrate the PRONAOS experiment. This provided an
absolute calibration to point and extended sources without using any
prior observations with other instruments or sky modelling. The
calibration accuracy achieved for the PRONAOS experiment is 6% in
relative (band to band) and 8% in absolute, as derived further in
this paper. As of today, this is the best calibration accuracy obtained for
a large diameter telescope observing in the submillimeter range. Such
an accuracy was essential to the scientific analysis of the PRONAOS
data on the Sunyaev-Zel'dovich (SZ) effect (Lamarre et al.
1998), and on the interstellar medium emission
(Ristorcelli et al. 1998; Bernard et al.
1999; Dupac et al. 2001; Stepnik et al.
2003; Dupac et al. 2002; Serra et al.
2002; Dupac et al. 2003) for which fine spectral
variations and the absolute intensity of the interstellar medium
emission were analysed. The absolute calibration accuracy of the
PRONAOS project is one of its major strength. This paper describes the
calibration scheme of the experiment and quantifies its accuracy.
The paper is organised as follows. In Sect. 2, we present the PRONAOS instrument and detail the optics, detectors and observing strategy aspects important to guaranty a good calibration. In Sect. 3, we describe the original calibration scheme developed for the PRONAOS experiment and the calibration accuracy reached for the whole experiment. In Sect. 4, we compare the point source absolute calibration of PRONAOS with a model of the Saturn planet emission (detailed in Appendix A). In Sect. 5, we compare our measurements with COBE/DIRBE observations of Galactic compact and extended sources and in Sect. 6 with ISOPHOT maps of Galactic sources.
PRONAOS is a French project conducted by CNES, designed and built
in cooperation between CNES and several CNRS laboratories. PRONAOS
is a stratospheric balloon-borne two meter telescope, devoted to
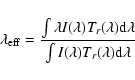
submillimeter astronomy (see Fig. 1). A
dedicated stellar sensor (Buisson & Durand 1990; Serra
et al. 1997) allows telescope pointing with an absolute
accuracy and stability of 20
![]() .
PRONAOS was launched
from Fort Sumner, New Mexico (USA), as part of the NSBF-NASA launch
campaigns. Three flights were conducted in 1994 (FS94), 1996 (FS96)
and 1999 (FS99). About 20 sources of 0.5
.
PRONAOS was launched
from Fort Sumner, New Mexico (USA), as part of the NSBF-NASA launch
campaigns. Three flights were conducted in 1994 (FS94), 1996 (FS96)
and 1999 (FS99). About 20 sources of 0.5
![]() were observed
totalling about 30 h of observations.
were observed
totalling about 30 h of observations.
The PRONAOS focal plane instrument SPM (Spectro Photomètre
Multibande, Lamarre et al. 1994), has been designed to
simultaneously perform sensitive measurements in four wide spectral
bands at 200, 260, 360 and
![]() (Table 1).
PRONAOS/SPM is a single beam multi-band instrument. Background
emission, including the contributions of the optics, telescope and the
residual atmosphere at the flight altitude is reduced using a wobbling
mirror (Sect. 2.3). Beam switching on the sky is
performed at a constant zenith angle, with a 6
(Table 1).
PRONAOS/SPM is a single beam multi-band instrument. Background
emission, including the contributions of the optics, telescope and the
residual atmosphere at the flight altitude is reduced using a wobbling
mirror (Sect. 2.3). Beam switching on the sky is
performed at a constant zenith angle, with a 6![]() peak-to-peak
amplitude and a sampling frequency of 19.5 Hz. Thus, the measured
signal is a difference between sky fluxes at +3
peak-to-peak
amplitude and a sampling frequency of 19.5 Hz. Thus, the measured
signal is a difference between sky fluxes at +3![]() ("plus beam'')
and -3
("plus beam'')
and -3![]() ("minus beam'') of the telescope axis. The
Sunyaev-Zel'dovich measurements were carried using a 5 sky position
sequence where the "plus beam'' successively observes on source, left,
on, right, on, above, on, below, on (Lamarre et al. 1998).
In order to obtain maps of extended or compact sources, the sky was
scanned in an "on the fly'' mode. In all observing modes, beam
switching was employed and the observations are therefore sensitive
only to the emission gradients of the sky brightness and
reconstruction of the astrophysical signal therefore requires
deconvolution from the dual beam pattern. Note that this is also true
for ground based submillimeter continuum observations.
("minus beam'') of the telescope axis. The
Sunyaev-Zel'dovich measurements were carried using a 5 sky position
sequence where the "plus beam'' successively observes on source, left,
on, right, on, above, on, below, on (Lamarre et al. 1998).
In order to obtain maps of extended or compact sources, the sky was
scanned in an "on the fly'' mode. In all observing modes, beam
switching was employed and the observations are therefore sensitive
only to the emission gradients of the sky brightness and
reconstruction of the astrophysical signal therefore requires
deconvolution from the dual beam pattern. Note that this is also true
for ground based submillimeter continuum observations.
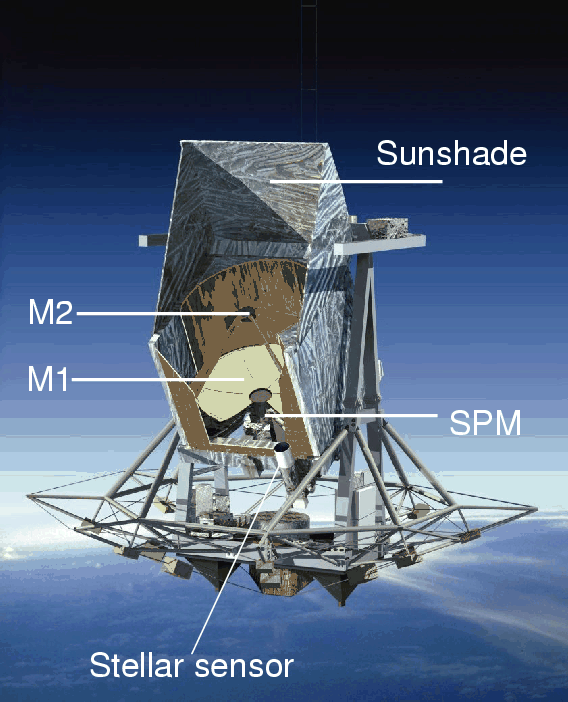 |
Figure 1: Artist view of the PRONAOS/SPM gondola in flight. The front side of the telescope is not represented in order to show the primary mirror structure and the focal plane instrument. |
| Open with DEXTER | |
Table 1:
PRONAOS/SPM bands characteristics.
![]() is the effective wavelength for a standard 30 K dust spectrum with
a
is the effective wavelength for a standard 30 K dust spectrum with
a
![]() emissivity
law and
emissivity
law and
![]() is the effective wavelength for the
Sunyaev-Zel'dovich thermal effect (Lamarre et al. 1998).
The definitions of
is the effective wavelength for the
Sunyaev-Zel'dovich thermal effect (Lamarre et al. 1998).
The definitions of
![]() and
and
![]() are detailed in
Sect. 3.1.2.
are detailed in
Sect. 3.1.2.
Each channel uses one DC polarised bolometer. Bolometers of channels
1 and 2 are commercial silicon bolometers from Infrared Laboratories
Inc. Channel 3 uses a composite bolometer (Leblanc et al.
1975) with a 30 ![]() m thick diamond substrate and a
monolithic doped germanium thermistor (Leblanc et al.
1977). The bolometer of channel 4 is a "spider web''
bolometer developed by Bock et al. (1995), a design
used since in a number of ground based or balloon submillimeter
experiments and in the HFI instrument of the forthcoming Planck
satellite mission (Lamarre et al. 2000). Each bolometer
is fitted into an integrating sphere (Leblanc et al. 1985;
Lamarre 1977). In order to achieve the lowest possible
Noise Equivalent Power (NEP), the bolometers are cooled down to 0.3 K.
The detectors cooling is produced by two closed cycle 3He
mini-fridges (Torre & Channin 1985) inside the liquid
4He cryostat (Sect. 2.3). This system
provides an intrinsic NEP smaller than 10-15 W Hz-1/2 at
19.5 Hz, below (bands 1 and 2) or close (bands 3 and 4) to the photon
noise.
m thick diamond substrate and a
monolithic doped germanium thermistor (Leblanc et al.
1977). The bolometer of channel 4 is a "spider web''
bolometer developed by Bock et al. (1995), a design
used since in a number of ground based or balloon submillimeter
experiments and in the HFI instrument of the forthcoming Planck
satellite mission (Lamarre et al. 2000). Each bolometer
is fitted into an integrating sphere (Leblanc et al. 1985;
Lamarre 1977). In order to achieve the lowest possible
Noise Equivalent Power (NEP), the bolometers are cooled down to 0.3 K.
The detectors cooling is produced by two closed cycle 3He
mini-fridges (Torre & Channin 1985) inside the liquid
4He cryostat (Sect. 2.3). This system
provides an intrinsic NEP smaller than 10-15 W Hz-1/2 at
19.5 Hz, below (bands 1 and 2) or close (bands 3 and 4) to the photon
noise.
PRONAOS is a Cassegrain focus telescope (diameter D=2 m, equivalent
focal length F=20 m). The primary mirror (M 1) is segmented, with six
light-weight panels (see Fig. 1). The panels and
the secondary mirror (M 2) are held by a carbon fiber structure.
Moreover, position sensors and actuators support the panels and
compensate for the gravity and temperature effects. This system keeps
the long term surface deformations to RMS values smaller than
![]() .
.
The whole telescope is embedded in a sunshade protecting the optical system from external sources of heat, such as the sun, the earth and the balloon. The sunshade limits the temperature gradients along a diameter of the primary mirror to values less than a few Kelvin which is an important characteristic for a beam switching instrument. A cone placed on the secondary mirror prevents the instrument from seeing itself through the central hole of the primary mirror.
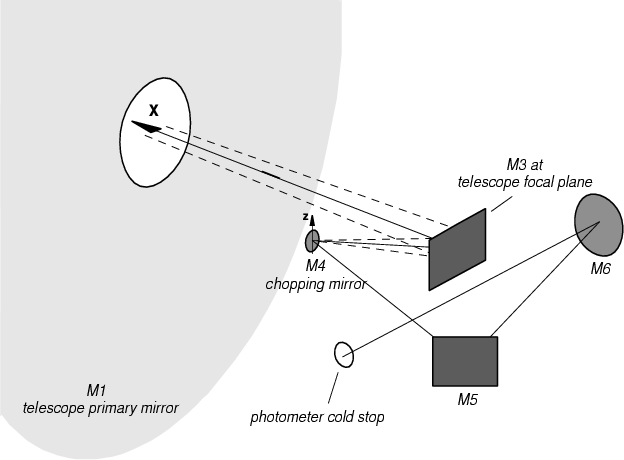 |
Figure 2: Design of the warm optics of the SPM instrument located behind the primary mirror M 1. |
| Open with DEXTER | |
The SPM instrument is composed of a warm and a cold optics. Both have been designed to minimize the spurious direct and diffracted thermal emission from the instrument.
The warm optics drives the radiation from the telescope into the
cryostat (Fig. 2). The sky chopping is performed using a
wobbling mirror (M 4) which is the optical conjugate of the telescope
secondary mirror (M 2) through the M 3 mirror. The wobbling
stability achieved is better than 1
![]() on the sky. The
wobbling mirror is in turn imaged by M 6 on the entrance cold stop in
the cryostat. All mirrors are oversized with respect to the
geometrical beam in order to limit the flux seen by diffraction from
the outside of the mirrors. Special care was taken in the baffling
around M 3, located in
the focal plane, since it is where the field modulation takes place.
on the sky. The
wobbling mirror is in turn imaged by M 6 on the entrance cold stop in
the cryostat. All mirrors are oversized with respect to the
geometrical beam in order to limit the flux seen by diffraction from
the outside of the mirrors. Special care was taken in the baffling
around M 3, located in
the focal plane, since it is where the field modulation takes place.
The cold optics is inside a 4He cryostat cooled down to 4 K at
ground pressure and about 1.6 K at flight altitude pressure. The 1.6 K
cold stop is the actual pupil of the optical system. At the cryostat
entrance short wavelengths blocking filters (
![]() )
are
attached to the cryostat thermal screens. The four spectral bands are
separated by three dichroics. For each channel, a short wavelength
pass filter is located just in front of the field stop defining the
field of view. Then, an off-axis parabolic mirror forms the image of
the cold pupil on the entrance of the light cones and sends the image of
the field stop at infinity. The toroidal-parabolic light cone,
attached to the detector, achieves the optical matching of the beam
with the bolometer.
)
are
attached to the cryostat thermal screens. The four spectral bands are
separated by three dichroics. For each channel, a short wavelength
pass filter is located just in front of the field stop defining the
field of view. Then, an off-axis parabolic mirror forms the image of
the cold pupil on the entrance of the light cones and sends the image of
the field stop at infinity. The toroidal-parabolic light cone,
attached to the detector, achieves the optical matching of the beam
with the bolometer.
Special attention has been given to straylight. Microwave absorbing baffles divide the different optical subsystems and allow to control the flux not coming from the optical path.
The alignment of optics and the knowledge of the beam characteristics is essential to high sensitivity submillimeter photometry. The first step consists on aligning the telescope primary segmented mirror. The specific procedure used is described in Ristorcelli et al. (1997). The second step consists in the internal alignment of the focal instrument. Finally the instrument and telescope are aligned with respect to each other.
After an optical alignment in the visible using a HeNe laser beam, the
adjustment of the SPM instrument optics is done in the submillimeter range. A
dedicated modulated source is imaged on a small flat mirror (2 or 8 mm
diameter) maintained at a 45![]() angle in the beam by a thin
mount in order to minimize obscuration. This source is mounted on a
two axis motorized table, and scanned across the beam. Maps
representing the response of the system at different locations in the
optical path are obtained and used to optimize the alignment of the
different mirrors. Special care was given to the optical matching of
the aperture stops (photometer cold stop, chopping mirror M 4,
telescope secondary mirror M 2), taking into account the extended
diffraction wings present at these wavelengths. Field stop alignment
and size are also checked with the same method, and data are used to
derive a first order model of the beam on the sky.
angle in the beam by a thin
mount in order to minimize obscuration. This source is mounted on a
two axis motorized table, and scanned across the beam. Maps
representing the response of the system at different locations in the
optical path are obtained and used to optimize the alignment of the
different mirrors. Special care was given to the optical matching of
the aperture stops (photometer cold stop, chopping mirror M 4,
telescope secondary mirror M 2), taking into account the extended
diffraction wings present at these wavelengths. Field stop alignment
and size are also checked with the same method, and data are used to
derive a first order model of the beam on the sky.
The PRONAOS/SPM calibration is based on ground based extensive characterisation and in-flight calibration. It only relies on measurements of blackbodies and on a physical instrument model. For this purpose, we have developed an extended absolute blackbody used on ground as a primary calibrator and an Internal Calibration System (ICS) composed of two blackbodies which is used in-flight as a secondary calibrator. The PRONAOS/SPM calibration is an absolute calibration against the ICS.
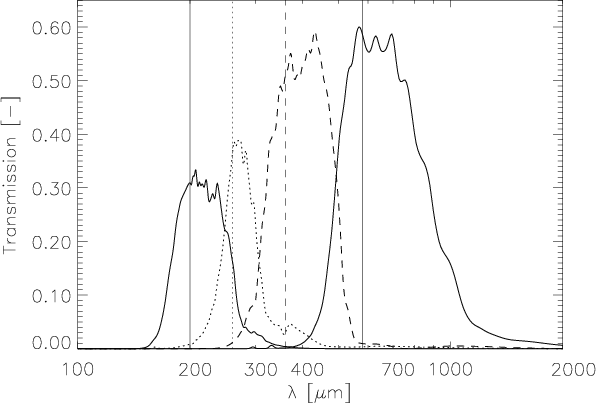 |
Figure 3: Measurements of the PRONAOS/SPM spectral response. The vertical lines correspond to the effective wavelength positions for each band (Sect. 3.1.2). |
| Open with DEXTER | |
The spectral transmission measurement of the photometer is done on the ground. It
has been measured using a Fourier transform spectrometer.
Figure 3 shows the total transmission of the
four PRONAOS/SPM bands. They are large bands covering the whole
spectral range from 180 to
![]() (Table 1).
(Table 1).
We refer to the PRONAOS/SPM photometric channels by the value of their
reference wavelength, a rounded value close to their effective
wavelength. The effective wavelength is a weighted average of the
wavelength, using the product of the source spectral intensity by the
transmission of the band as the weighting function:
Wide photometric bands require color correction. The flux intensities
measured using PRONAOS/SPM are computed at the reference wavelengths
of Table 1. Different sources accounting for the
same power measured in one PRONAOS spectral band but with different
emission spectral shape will therefore have different intensities at
the reference wavelengths. For example, at
![]() the flux
intensity of a source with
the flux
intensity of a source with
![]() ,
,
![]() is about 20% larger than
that of a source with T=10 K,
is about 20% larger than
that of a source with T=10 K, ![]() .
When the source spectrum is
poorly known, color correction must be done iteratively: a first
order correction is made assuming a given spectrum. Then, using the
four PRONAOS/SPM channels, a better determination of the spectrum is
obtained and the color correction is determined. This process is
repeated until the correction gets smaller than 0.5%.
Table 2 shows the color corrections taken
into account when transforming the PRONAOS flux intensities from a
.
When the source spectrum is
poorly known, color correction must be done iteratively: a first
order correction is made assuming a given spectrum. Then, using the
four PRONAOS/SPM channels, a better determination of the spectrum is
obtained and the color correction is determined. This process is
repeated until the correction gets smaller than 0.5%.
Table 2 shows the color corrections taken
into account when transforming the PRONAOS flux intensities from a
![]() spectrum
to a
spectrum
to a
![]() spectrum.
spectrum.
Table 2:
Color correction factors to be taken into account in order to
transform the PRONAOS flux intensities from a (T=30 K, ![]() )
spectrum to a (T,
)
spectrum to a (T, ![]() )
or Rayleigh-Jeans (RJ) spectrum.
)
or Rayleigh-Jeans (RJ) spectrum.
Table 3:
PRONAOS/SPM transmission computed in the PRONAOS/SPM
photometric bands and their 3![]() errors.
errors.
The PRONAOS/SPM instrument is calibrated against blackbodies. Color
correction from calibration data to astronomical data, as shown in
Table 2, relies on the knowledge of the
spectral transmission of the photometric channels. An upper limit on
the error on the color correction factors due to uncertainties on the
filters transmission knowledge is determined using a simple simulation: the spectral transmission of a given channel is increased by 5%
(3-![]() )
for
)
for
![]() ,
a very pessimistic case.
This leads to an error smaller than 1% (3
,
a very pessimistic case.
This leads to an error smaller than 1% (3![]() )
on the color
correction factors of Table 2, the maximum
error beeing obtained for Band 1, and a (
)
on the color
correction factors of Table 2, the maximum
error beeing obtained for Band 1, and a (
![]() ,
,
![]() )
spectrum.
)
spectrum.
The PRONAOS/SPM response is obtained using the ICS, located close to the interface between the instrument and the telescope. The ICS over-illuminates the wobbling mirror (M 4). Determination of the absolute response on the sky then requires the evaluation of the telescope optical coupling with the mirror M 4 and of the sky transmission.
The optical coupling of the focal instrument with the sky is
characterized by a factor combining the transmission of the telescope
and the losses by diffraction. This factor is the ratio of the powers
received by the instrument to (1) an extended uniform source filling
the SPM instrument beam and (2) the same source filling the
PRONAOS/SPM beam. Its measurement would require a very large vacuum
chamber facility (>10 m) to hold both the telescope and a source
simulator. Instead, we used an optical model of the telescope,
developed during the design phase. This model uses classical
diffraction Fresnel laws at finite distance, integrated numerically
after proper use of symmetries. Straylight is computed by
using a reverse propagation for the rays, starting from the exit pupil
of the photometer and propagating them towards the sky. The results,
shown in Table 3, take into account the presence
of the secondary mirror (M 2) support spider, the transmission of the
primary mirror (M 1), diffraction losses around it, the transmission of
the secondary mirror, losses due to the cone on the secondary mirror
(M 2), losses around the secondary mirror (M 2) and losses around the
wobbling mirror (M 4). The instrument/sky coupling is the most
important source of error in the PRONAOS/SPM error budget:
the grid used for the numerical integration is optimized to
limit the computing time and the real design is simplified in the
model. This yield a 6% (3-![]() )
error contribution on the
calibration.
)
error contribution on the
calibration.
We use the MODTRAN code (Berk et al. 1989) to compute the
atmospheric transmission in the PRONAOS flight conditions. MODTRAN
(MODerate-resolution TRANsmission) is a medium resolution atmospheric
model (spectral resolution ![]() 1 cm-1) derived from the program
LOWTRAN (spectral resolution
1 cm-1) derived from the program
LOWTRAN (spectral resolution ![]() 20 cm-1). These programs are
commonly used by the atmospheric community and are based on the best
data from laboratory spectroscopy taken in the Air Force Geophysics
Laboratory database. We have used the version 7.0 of the MODTRAN
program and computed the atmospheric transmission at 38 km, which is
the PRONAOS/SPM flight altitude, and towards a 45
20 cm-1). These programs are
commonly used by the atmospheric community and are based on the best
data from laboratory spectroscopy taken in the Air Force Geophysics
Laboratory database. We have used the version 7.0 of the MODTRAN
program and computed the atmospheric transmission at 38 km, which is
the PRONAOS/SPM flight altitude, and towards a 45![]() elevation
direction, which is the mean elevation pointing direction of the
PRONAOS/SPM observations. The results are presented in
Table 3. The
atmospheric absorption is almost negligible in the submillimeter range
at stratospheric altitude (
elevation
direction, which is the mean elevation pointing direction of the
PRONAOS/SPM observations. The results are presented in
Table 3. The
atmospheric absorption is almost negligible in the submillimeter range
at stratospheric altitude (![]() ).
).
The calibration strategy exposed so far applies to extended sources (filling the beam) with uniform brightness. Beam characterisation is a crucial point in order to determine fluxes for point or compact sources. Straylight and beam profile are controlled by a careful design of the PRONAOS/SPM optics (Sect. 2.3). The beam profile is determined using measurements on point sources during the flight and a physical model of the optics.
Beam profiles of the focal instrument have been measured and optimised
on the ground during the optics alignment phase
(Sect. 2.4). The main beam profile on the
sky depends on the optical quality of the telescope
caracterised by its WFE (wavefront error), which value is estimated
between 15 and
![]() RMS for the PRONAOS telescope.
RMS for the PRONAOS telescope.
Therefore, the actual beam profiles of PRONAOS/SPM were derived from
point source observations. The planet Saturn has been observed using
PRONAOS/SPM during flight FS96. Saturn can be considered as a point
source (diameter
![]() )
at the resolution of
PRONAOS/SPM (beam FWHM
)
at the resolution of
PRONAOS/SPM (beam FWHM
![]() ). Saturn profiles across
20
). Saturn profiles across
20![]() scans were measured in the four photometric channels,
covering a total mapped area of
scans were measured in the four photometric channels,
covering a total mapped area of
![]() .
These profiles are shown in Fig. 4. They have been used
to derive the PRONAOS/SPM main beam shape for distances smaller than
6
.
These profiles are shown in Fig. 4. They have been used
to derive the PRONAOS/SPM main beam shape for distances smaller than
6![]() away from the observing direction
(Table 4).
away from the observing direction
(Table 4).
 |
Figure 4: PRONAOS/SPM dual beam section measured on Saturn. |
| Open with DEXTER | |
For distances larger than 6![]() ,
no reliable estimate of the
sidelobes shape could be obtained from the Saturn observations.
Therefore, the far sidelobes have been modelled using classical
diffraction laws for a Cassegrain telescope. This contribution was
added to the main beams to obtain the PRONAOS/SPM full beams.
Integration of the full beams leads to the beam solid angles presented
in Table 4.
,
no reliable estimate of the
sidelobes shape could be obtained from the Saturn observations.
Therefore, the far sidelobes have been modelled using classical
diffraction laws for a Cassegrain telescope. This contribution was
added to the main beams to obtain the PRONAOS/SPM full beams.
Integration of the full beams leads to the beam solid angles presented
in Table 4.
As explained in Sect. 3.4.2, the primary PRONAOS/SPM
calibration is an extended source calibration. An accurate estimate
of far sidelobes is needed to be confident in the use of the ground
calibration for sources measurements. Table 4 shows that
far sidelobes can account for at most 3% of the total power collected
for an uniform brightness source. We estimate the validity of the
determination of the beams solid angles to be better than 5%
(3-![]() ).
).
Table 4: Beam characteristics for the geometric optical conjugate of the cold stop (geometrical beam), the Saturn observations (main beam), and a combination of the Saturn observations and a telescope model (full beam).
The Internal Calibration System (ICS) is a subsystem of the PRONAOS/SPM experiment which guaranties the absolute calibration accuracy during the flight.
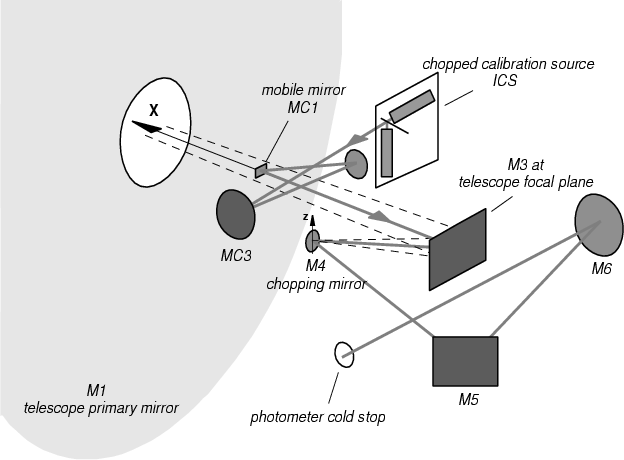 |
Figure 5: Optics design of the SPM instrument and the ICS as seen from the back of the telescope primary mirror (M 1). |
| Open with DEXTER | |
The ICS (Fig. 5) is composed of two blackbodies whose
optical axis intersect at 90![]() and a reflective chopper
selecting them alternately. The temperatures of the two blackbodies
are respectively set to 40
and a reflective chopper
selecting them alternately. The temperatures of the two blackbodies
are respectively set to 40 ![]() C and 100
C and 100 ![]() C. The
modulation is done at the frequency of the internal chopper of the
instrument, 19.5 Hz. The temperatures of the two blackbodies are
continuously monitored during the flight using thermometers. This
monitoring indicated that the blackbody temperatures are stable to
better than 20 mK/h and 60 mK/h respectively. The monitoring
allows to predict the amplitude of the ICS input signal with an
accuracy better than 1% (3-
C. The
modulation is done at the frequency of the internal chopper of the
instrument, 19.5 Hz. The temperatures of the two blackbodies are
continuously monitored during the flight using thermometers. This
monitoring indicated that the blackbody temperatures are stable to
better than 20 mK/h and 60 mK/h respectively. The monitoring
allows to predict the amplitude of the ICS input signal with an
accuracy better than 1% (3-![]() )
in brightness temperature. In
flight, a calibration sequence is done between each astronomical
sequence, typically every 30 to 60 min. This calibration signal
is used to determine the response of the SPM instrument. During a
calibration sequence, the wobbling of the M 4 mirror is turned off.
This stops the sky modulation and allows to center the beam on the
optical axis where a small mobile mirror (MC1) is placed, redirecting
the signal of the ICS onto the detectors. The warm ICS signal
(310-370 K) is seen against a cold background (around 50 K). However,
MC1 is small compared to the beam so that the ICS signal is diluted
and induces a background change limited to about 10% in brightness
temperature. This change is taken into account in the calibration
data processing (Sect. 3.5.2).
)
in brightness temperature. In
flight, a calibration sequence is done between each astronomical
sequence, typically every 30 to 60 min. This calibration signal
is used to determine the response of the SPM instrument. During a
calibration sequence, the wobbling of the M 4 mirror is turned off.
This stops the sky modulation and allows to center the beam on the
optical axis where a small mobile mirror (MC1) is placed, redirecting
the signal of the ICS onto the detectors. The warm ICS signal
(310-370 K) is seen against a cold background (around 50 K). However,
MC1 is small compared to the beam so that the ICS signal is diluted
and induces a background change limited to about 10% in brightness
temperature. This change is taken into account in the calibration
data processing (Sect. 3.5.2).
The ICS was calibrated on the ground against an absolute extended blackbody filling the SPM beam before each flight. This extended blackbody is the primary standard of the PRONAOS/SPM calibration scheme. All subsequent calibrations refer to the ICS.
The absolute extended blackbody has been designed and developed for
the PRONAOS/SPM calibration. It is operated between 30 ![]() C and
50
C and
50 ![]() C. It is composed of a cube of 400 mm on edge with a
square aperture of 200 mm centered on one face. The inside of the
cavity has a pyramidal structure surface coated with black paint. The
statistical average number of reflexions of a ray in the cavity is 24
before exiting. Conservative assumptions of a minimum number of reflexions
of 8 and a black paint emissivity of 0.5 give a blackbody emissivity
larger than 0.98. The overall emissivity of the
blackbody is taken equal to 0.99
C. It is composed of a cube of 400 mm on edge with a
square aperture of 200 mm centered on one face. The inside of the
cavity has a pyramidal structure surface coated with black paint. The
statistical average number of reflexions of a ray in the cavity is 24
before exiting. Conservative assumptions of a minimum number of reflexions
of 8 and a black paint emissivity of 0.5 give a blackbody emissivity
larger than 0.98. The overall emissivity of the
blackbody is taken equal to 0.99 ![]() 0.01 (3-
0.01 (3-![]() ). The opening is
closed by a
). The opening is
closed by a
![]() mylar to obtain an homogeneous temperature of the
air inside the cavity equal to that of the walls. Homogeneity of the
temperature is checked using 3 thermometers at various locations
within the cavity and on the walls. The mylar is tilted at an angle
of about 5
mylar to obtain an homogeneous temperature of the
air inside the cavity equal to that of the walls. Homogeneity of the
temperature is checked using 3 thermometers at various locations
within the cavity and on the walls. The mylar is tilted at an angle
of about 5![]() to avoid reflexion of the detector onto itself
and its transmission in taken into account during the ICS calibration.
to avoid reflexion of the detector onto itself
and its transmission in taken into account during the ICS calibration.
First, the absolute extended blackbody is placed in front of the focal
instrument, filling entirely the SPM beam centered on the optical
axis, the sky modulation by M 4 being turned off. The blackbody
entrance is modulated by an oversized bow tie chopper covered with
Eccosorb at ambient temperature, tilted with respect to the optical
axis. The chopper temperature is permanently monitored, as well as
the environment temperature. During the calibrations, the ambient and
chopper temperature were close to 21 ![]() C and the absolute
blackbody set to 40
C and the absolute
blackbody set to 40 ![]() C. The total error on the knowledge of
this modulated signal is estimated to 3% (3-
C. The total error on the knowledge of
this modulated signal is estimated to 3% (3-![]() )
in brightness
temperature. Second, the bow tie chopper is stopped and a standard
calibration sequence on the ICS is done. The geometrical dilution of
the ICS in the beam is equal to the ratio of the measure of the signal
on the absolute extended blackbody to the measure obtained on the ICS.
Therefore this calibration is relevant for extended sources of uniform
brightness. Corrections are made to take into account the change of
background when chopping against the absolute blackbody, and the
slight deviations from the Rayleigh-Jeans regime. The value of the
dilution are found to be between
)
in brightness
temperature. Second, the bow tie chopper is stopped and a standard
calibration sequence on the ICS is done. The geometrical dilution of
the ICS in the beam is equal to the ratio of the measure of the signal
on the absolute extended blackbody to the measure obtained on the ICS.
Therefore this calibration is relevant for extended sources of uniform
brightness. Corrections are made to take into account the change of
background when chopping against the absolute blackbody, and the
slight deviations from the Rayleigh-Jeans regime. The value of the
dilution are found to be between
![]() and
and
![]() depending on the band.
depending on the band.
During the calibration procedure, special care was given to have an
equal atmospheric optical path from the input window of the photometer
to the entrance of the absolute blackbody and to the entrance of the
ICS. Thus the same atmospheric absorption applies for both paths.
However, the atmospheric transmission varies during the calibration
procedure inducing a bias estimated to 2% (3-![]() ). An
additional source of error is the position of the mobile MC1 mirror
(Sect. 3.4.1, Fig. 5) inside the beam
during the calibration sequence. Gravity bendings of the MC1 support
affect the position of MC1 in the beam for different zenith angle of
the telescope, and due to near field diffraction the beam at the MC1
position is not flat. This effect contributes to a maximum
calibration error of 5% (3-
). An
additional source of error is the position of the mobile MC1 mirror
(Sect. 3.4.1, Fig. 5) inside the beam
during the calibration sequence. Gravity bendings of the MC1 support
affect the position of MC1 in the beam for different zenith angle of
the telescope, and due to near field diffraction the beam at the MC1
position is not flat. This effect contributes to a maximum
calibration error of 5% (3-![]() ).
).
History of all calibration sequences acquired during the FS2 PRONAOS
flight are plotted in Fig. 6. During most of the
duration of the flight, the environment conditions of the instrument
were very stable and the response in the four bands showed a
dispersion smaller than 6 to 12% (3![]() ). The scientific data
reduction includes the correction to these variations.
). The scientific data
reduction includes the correction to these variations.
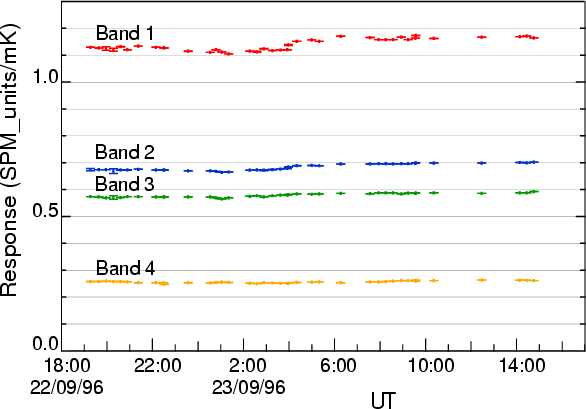 |
Figure 6: PRONAOS/SPM response variation on ICS during the 1996 flight. Response is expressed as SPM internal units vs. brightness temperature for extended sources in mK. |
| Open with DEXTER | |
The response of semiconductor bolometers depends on three variable parameters: the bias current, the temperature of the thermal reference and the optical background. The bias current is optimized and fixed before the flight to get the best signal-to-noise ratio on astronomical sources. The effect of the two other parameters on the response is discussed below.
The variation of the detector response with the temperature of the cold end of the 0.3 K 3He mini-fridge was measured on the ground. The relative variation coefficient for the four bands was found between 0.35%/mK and 0.7%/mK around 295 mK. The 3He mini-fridge temperatures during the 3 flights were very stable at the ceiling altitude (always in the range 290-300 mK, variation rate smaller than 1 mK/h). Using the calibration sequences acquired before and after each astronomical observation, there was no need to introduce any specific correction to the detector response due to detector reference temperature changes. The corresponding error is estimated to be less than 0.2% and can be neglected.
The background power received by the detectors is very stable at ceiling altitude during astrophysical observations, but is significantly larger during the calibration sequences (Sect. 3.4.1). The variation of response induced by this background change is determined in order to get the actual response on astrophysical sources.
We have calibrated the dependency of the response as a function of the background equivalent temperature at the entrance of the cryostat. First, the DC component of the bolometer read-out was measured at various known background levels at the cryostat input window, using a liquid Nitrogen bath and a set of 300 K geometrical occultations (0 to 100%). Then the response on a constant modulated signal was measured for various backgrounds, using the background scale provided in the previous step. These responses normalized at 293 K are represented in Fig. 7.
The absolute contribution of the ICS to the background is measured on
the ground against a large liquid nitrogen bath. In flight, the total
background (including the ICS) is estimated from the ICS response.
Then, the contribution of the ICS is subtracted and the bolometer
response variation between calibration on ICS and observations
sequences is computed from Fig. 7. This correction
varies from 1.09 to 1.16 for band 1 to 4. The absolute error
associated to this correction is estimated to 1% (3-![]() ).
).
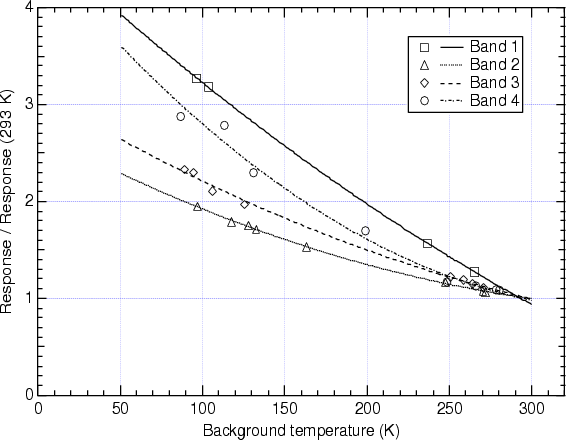 |
Figure 7: PRONAOS/SPM response variation with background temperature. Lines are polynomial fits to data points sets. |
| Open with DEXTER | |
During the PRONAOS/SPM development phase, special attention was given to the experiment electronic design in order to guaranty linearity and stability of all the detection system. The bolometers read-out, lock-in amplification and digitization have been checked for all amplifier gains (1 to 64) and over the full dynamic range (16 bits) and do show a linearity and a stability better than 0.1%.
Table 5 presents the different systematic error
sources of the PRONAOS/SPM calibration detailed in the previous
sections. In order to compute the total calibration accuracy, these
possible systematic errors have been linearly added. The PRONAOS/SPM
absolute calibration accuracy is 8% at the 1-![]() level. In the
band-to-band errors of Table 5, second order errors
are neglected (totality of the
contributions related to the absolute blackbody/chopper and to the
atmospheric path length, part of the contributions related to the ICS MC1
mirror position, to the ICS monitoring, to the background response
correction and to the instrument/sky coupling). Independent errors
(color correction, beam solid angle) are multiplied by
level. In the
band-to-band errors of Table 5, second order errors
are neglected (totality of the
contributions related to the absolute blackbody/chopper and to the
atmospheric path length, part of the contributions related to the ICS MC1
mirror position, to the ICS monitoring, to the background response
correction and to the instrument/sky coupling). Independent errors
(color correction, beam solid angle) are multiplied by ![]() .
The band-to-band calibration accuracy is 6% at the
1-
.
The band-to-band calibration accuracy is 6% at the
1-![]() level. We want to emphasis here, that thanks to a careful
optical design and a complete calibration procedure, these figures are
up to now among the most accurate for large telescope instruments in
the submillimeter range.
level. We want to emphasis here, that thanks to a careful
optical design and a complete calibration procedure, these figures are
up to now among the most accurate for large telescope instruments in
the submillimeter range.
Table 5: PRONAOS/SPM calibration error budget: absolute and band to band relative errors
The careful design and building of the PRONAOS/SPM instrument allows to reach high sensitivities. In order to illustrate the measurement accuracy, we give in Table 6 the PRONAOS/SPM NEFD (Noise Equivalent Flux Density) measured in flight. These NEFDs are computed on empty fields observed during the PRONAOS second flight. We present the NEFD of the galactic maps and the Sunyaev-Zel'dovich measurements corresponding to two different observation modes, mapping and 5 points (Sect. 2.1). These NEFDs are very similar.
Table 6: Noise Equivalent Flux Densities of the PRONAOS/SPM experiment measured in flight.
Table 7: Summary of the Saturn model: Rayleigh-Jeans brightness temperature of the Saturn sub-Earth point and the different contributions we have taken into account. The predictions of the model are compared with the PRONAOS/SPM observations.
Planets are usually used as primary calibrators in the submillimeter. In order to check the calibration procedure described above, we compare here the PRONAOS/SPM observation of Saturn with a detailed model of the planet's emission in the submillimeter. Due to visibility and observation planning constraints, Saturn was the only planet observed using PRONAOS/SPM.
Saturn is a true point source for PRONAOS (Sect. 3.3.1). The Saturn flux was derived from the maximum value in the map observed during the FS96 flight, and using the angular size of the planet (Sect. A.1) and the PRONAOS/SPM beam (Table 4). Table 7 presents the resulting fluxes in the four PRONAOS/SPM photometric channels, converted to Rayleigh-Jeans temperatures, and including the correction for the atmospheric transmission. The signal to noise ratio on the Saturn data is about 1000 in the data. Therefore, the error bars are only due to the absolute photometric accuracy of the instrument.
Large features in the submillimeter region of the Saturn spectrum require a careful spectral integration over the PRONAOS/SPM photometric bands. Moreover, in order to be consistent with the accuracy of the PRONAOS/SPM calibration, the contribution of the rings must be evaluated. We have built a model from literature data with the goal of obtaining an absolute photometric accuracy better than the PRONAOS/SPM one (i.e. 8%). The emission and the absorption spectra of the Saturn disk and rings, and the geometric configuration of the planet are taken into account. The model is detailed in Appendix A. Table 7 gives a summary of the predictions of this model in the PRONAOS/SPM channels.
The brightness temperature ratios between the observations and the model
are respectively 0.89, 0.89, 0.91 and 0.99 for the four PRONAOS/SPM
channels (see Table 7). The differences between
the model and the observation (![]() )
for all channels are compatible
with the combined error bars of the model (5
)
for all channels are compatible
with the combined error bars of the model (5![]() )
and the observations
(8
)
and the observations
(8![]() ). The difference observed in the first three channels is about
10% which is larger than the absolute calibration error alone. This
indicates that the model used may actually under-estimate the emission
in the 500-900
). The difference observed in the first three channels is about
10% which is larger than the absolute calibration error alone. This
indicates that the model used may actually under-estimate the emission
in the 500-900 ![]() m range.
m range.
We have compared several COBE/DIRBE and PRONAOS observations of
selected astrophysical targets, both compact (point-like for
COBE/DIRBE) and extended. The COBE/DIRBE wavelength range overlaps that of
Pronaos around
![]() ,
therefore this comparison provides cross-check
of the PRONAOS calibration procedure for the band 1. Table 8 lists the
PRONAOS observations used in these intercalibrations.
,
therefore this comparison provides cross-check
of the PRONAOS calibration procedure for the band 1. Table 8 lists the
PRONAOS observations used in these intercalibrations.
Table 8: List of the PRONAOS observations (second flight) used in the intercalibration with COBE/DIRBE and ISO/ISOPHOT .
In this section, we compare the DIRBE and PRONAOS observations towards M 82. Although this object is a point source for DIRBE, it is slightly resolved with PRONAOS. This is therefore a check of the PRONAOS calibration on compact objects.
The DIRBE fluxes for M 82 has been obtained using the
DIRBE Point Source Photometry tool (http://cobe.gsfc.nasa.gov/cio/browser.html), which uses
the time-ordered DIRBE data. The resulting fluxes are given in
Table 9, from 60 to
![]() .
.
The PRONAOS fluxes for M 82 were obtained using aperture photometry (e.g., Howell 1989) in the maps observed during flight FS96 (see Table 8). M 82 is a slightly extended object lying on a flat background in these maps. The quoted error has been computed outside the emission regions, the error being equal to the rms value in an empty region of the map divided by the square root of the number of pixels in the flux integration region.
Table 9:
Integrated fluxes of M 82 measured by PRONAOS and DIRBE in Jy.
The flux convention is
![]() in both cases.
in both cases.
We have fitted a grey body of the form
![\begin{figure}
\par\includegraphics[width=8.5cm]{0226f08.ps}
\end{figure}](/articles/aa/full/2006/08/aa0226-03/img77.gif) |
Figure 8:
Spectrum of M 82 measured by PRONAOS
and DIRBE . The data in Table 10 have been
iteratively color corrected in order to take into account of the actual
spectral shape:
|
| Open with DEXTER | |
Table 10: Fit parameters for the M 82 spectrum using PRONAOS data and PRONAOS +DIRBE data.
In order to check the absolute calibration of the
PRONAOS instrument on extended sources, we have carried out a comparison
between DIRBE and PRONAOS observations of several extended bright
regions. Unlike for compact sources, this is not an easy task and it
requires a good understanding of the characteristics of the two
instruments. In particular the sky modulation used during the
PRONAOS observations subtracts low spatial frequencies in the maps,
while DIRBE measurements are sensitive to the total sky power.
Simulations of PRONAOS observations taking into account the effect of
the scanning strategy and sky modulation have been carried out. They have
shown, provided that a linear background is subtracted from the DIRBE
data in order to account for the subtraction of the low spatial
frequencies in the PRONAOS data, that an accuracy better than ![]() can be obtained if the size of the PRONAOS map is larger than the
DIRBE beam size and the source is compact at the DIRBE scale. We
have therefore limited the comparison to those sources where a
sufficiently large region was mapped using PRONAOS. The selected regions for
this study are M 42, M 17,
can be obtained if the size of the PRONAOS map is larger than the
DIRBE beam size and the source is compact at the DIRBE scale. We
have therefore limited the comparison to those sources where a
sufficiently large region was mapped using PRONAOS. The selected regions for
this study are M 42, M 17, ![]() -Ophiuchi and Cygnus B (see
Table 8).
-Ophiuchi and Cygnus B (see
Table 8).
![\begin{figure}
\par\includegraphics[width=8cm,angle=0]{0226f09.eps} %
\end{figure}](/articles/aa/full/2006/08/aa0226-03/img89.gif) |
Figure 9:
This figure
illustrates the method used when comparing the PRONAOS and DIRBE
brightnesses for extended sources on the M 42 data. The grey scale
shows the DIRBE
|
| Open with DEXTER | |
We have used the DIRBE Zodi-Subtracted Mission Average (ZSMA) maps which
are the most accurate. Typical noise levels on empty regions of
these maps is estimated to be 0.03, 0.05, 2.5 and 1.3 MJy/sr (1-![]() )
at 60, 100, 140 and
)
at 60, 100, 140 and
![]() respectively.
respectively.
The DIRBE brightness value is taken to be the ZSMA value at the
brightest DIRBE pixel falling in the PRONAOS map. The DIRBE
background at this position is estimated through a linear regression
using the ZSMA values in the second concentric ring of pixels
surrounding the central DIRBE pixel (see
Fig. 9). This background value
is subtracted from the DIRBE brightness, leading to a background
subtracted value. The resulting values are shown as triangles in
Fig. 10. The above ZSMA
brightness errors are very small compared to the brightness of the
sources considered here. The uncertainty upon the DIRBE brightness
for each source is therefore dominated by that on the background
subtraction method, which we computed to be about ![]() of the
background value for each source.
of the
background value for each source.
The PRONAOS maps were convolved by the DIRBE beam centered on the
central ZSMA pixel, leading to the brightness values in the PRONAOS
bands at 200 and
![]() as would have been observed by DIRBE when
pointing toward the central ZSMA pixel. In this process, regions
falling outside the PRONAOS map have been replaced by the DIRBE
background subtracted value at this point, extrapolated in wavelength
to the pronaos bands using a grey body fit.
as would have been observed by DIRBE when
pointing toward the central ZSMA pixel. In this process, regions
falling outside the PRONAOS map have been replaced by the DIRBE
background subtracted value at this point, extrapolated in wavelength
to the pronaos bands using a grey body fit.
The contribution by
the regions not covered by the pronaos map is typically ![]() of the
final brightness. The errors were calculated from the PRONAOS noise
level taking into account the number of PRONAOS pixels used and their
weight in the convolution. The resulting values are shown as square
symbols in Fig. 10.
of the
final brightness. The errors were calculated from the PRONAOS noise
level taking into account the number of PRONAOS pixels used and their
weight in the convolution. The resulting values are shown as square
symbols in Fig. 10.
Table 11 gives the ratio of the PRONAOS to DIRBE average brightnesses, as computed above, for each source. The quoted errors are the quadratic sum of the PRONAOS and DIRBE error contribution.
![\begin{figure}
\par\includegraphics[width=8.5cm]{0226f10.eps}
\end{figure}](/articles/aa/full/2006/08/aa0226-03/img93.gif) |
Figure 10:
PRONAOS DIRBE intercalibration results on extended
sources. Spectra of M 42, M 17, |
| Open with DEXTER | |
Table 11:
Ratio of the PRONAOS to DIRBE
average brightnesses on extended sources. The average value is
weighted using 1/![]() .
.
The comparison between the PRONAOS and DIRBE fluxes over the
four extended sources above leads to a ![]() agreement in average
and better than
agreement in average
and better than ![]() in any case. Owing to the additional
difficulty of performing intercalibration on extended sources
(which is reflected in the quoted error bars), this confirms the
accuracy of the PRONAOS calibration summarized in Table 5.
in any case. Owing to the additional
difficulty of performing intercalibration on extended sources
(which is reflected in the quoted error bars), this confirms the
accuracy of the PRONAOS calibration summarized in Table 5.
We have carried a similar intercalibration on selected ISO/ISOPHOT observations of targets also observed using PRONAOS (Table 8).
The ISOPHOT instrument on board ISO has performed
observations at
![]() with an angular resolution of 1.6 arcmin,
similar to that of PRONAOS at this wavelength. Like DIRBE, ISOPHOT was
not equipped with an absolute calibration device. Its calibration relied
on point sources. We have selected regions which have been observed
with PRONAOS and with ISOPHOT in the
with an angular resolution of 1.6 arcmin,
similar to that of PRONAOS at this wavelength. Like DIRBE, ISOPHOT was
not equipped with an absolute calibration device. Its calibration relied
on point sources. We have selected regions which have been observed
with PRONAOS and with ISOPHOT in the
![]() channel. We have
restricted the selection to ISOPHOT observations obtained in the P22
mode where the ISOPHOT photometric calibration is the best understood
and to ISOPHOT observations with a map size large enough to allow a
good comparison with the PRONAOS data. As a result, only 3 ISOPHOT
observations were selected, two in M 42 and one in
channel. We have
restricted the selection to ISOPHOT observations obtained in the P22
mode where the ISOPHOT photometric calibration is the best understood
and to ISOPHOT observations with a map size large enough to allow a
good comparison with the PRONAOS data. As a result, only 3 ISOPHOT
observations were selected, two in M 42 and one in
![]() .
.
The ISOPHOT data were reduced using the PHOT Interactive Analysis
(PIA, Gabriel et al. 1997) in its version 7.2.2, in order to correct
for instrumental effects, remove glitches and calibrate the data. We
have checked that the data do not show any residual of transient
effects after treatment. The data have then been projected onto the
sky, using flat field correction softwares similar to that used by
Lagache and Dole (2001). The ISOPHOT maps obtained are
shown in Fig. 11, along with the region observed by
PRONAOS. As can be seen on the figure, only a partial overlap
sometimes exist betwen the two observations which makes a direct
comparison difficult. Most importantly, the beam modulation in the
PRONAOS data subtracts out the lowest spatial frequencies from the
sky signal, while ISOPHOT is sensitive to absolute power. This is
taken into account by simulating the PRONAOS observing strategy
(scanning and beam modulation) on the ISOPHOT maps at the positions
observed by PRONAOS. The simulated signal produced was processed in
the same way as the PRONAOS data and a linear regression analysis was
performed in the regions of overlap between the ISOPHOT data and the
PRONAOS data color-corrected to the
![]() convention
(Fig. 12).
This lead to the intercalibration factors given in
Table 12.
convention
(Fig. 12).
This lead to the intercalibration factors given in
Table 12.
It can be seen that the agreement between the ISOPHOT and the PRONAOS
calibration is good (![]() )
for the two observations of the M 42
region. The origin of the
)
for the two observations of the M 42
region. The origin of the ![]() difference between the observations
of the
difference between the observations
of the
![]() region remains unexplained. However, the
ISOPHOT observations of M 42 and
region remains unexplained. However, the
ISOPHOT observations of M 42 and
![]() have been
obtained at different dates, and it is known that the ISOPHOT
calibration has varied by about
have been
obtained at different dates, and it is known that the ISOPHOT
calibration has varied by about ![]() during the ISO observations.
during the ISO observations.
![\begin{figure}
\par\includegraphics[width=8cm,angle=0]{0226f13.eps}\includegraphics[width=8cm,angle=0]{0226f14.eps}
\end{figure}](/articles/aa/full/2006/08/aa0226-03/img99.gif) |
Figure 11:
ISOPHOT (grey scale) and PRONAOS
|
| Open with DEXTER | |
![\begin{figure}
\par\includegraphics[width=18cm]{0226f15.eps}
\end{figure}](/articles/aa/full/2006/08/aa0226-03/img100.gif) |
Figure 12:
Correlation diagrams between the ISOPHOT
and PRONAOS modulated data at
|
| Open with DEXTER | |
Table 12:
Ratio of the PRONAOS to
ISOPHOT average brightnesses on extended sources. The average value
is weighted using 1/![]() .
.
We have presented the absolute calibration of the PRONAOS/SPM
instrument. PRONAOS/SPM has observed the sky simultaneously in four
submillimeter wide photometric channels using a two meter telescope
carried onboard a stratospheric balloon. The PRONAOS/SPM instrument
has been carefully designed to guaranty clean beam shapes, sensitive
measurements and accurate photometry. An absolute photometric accuracy
of 8% (1-![]() )
and a
channel to channel relative calibration accuracy of 6% (1-
)
and a
channel to channel relative calibration accuracy of 6% (1-![]() )
are obtained thanks to the absolute
calibration, based on ground and in-flight measurements of controlled
blackbodies and a physical model of the instrument. This original calibration
scheme gives the best calibration accuracy
of today's large telescope submillimeter instruments. We have
validated the point source calibration accuracy of PRONAOS/SPM by comparing a
detailed submillimeter emission model of the Saturn planet and the
PRONAOS/SPM observations. We also checked the calibration on compact and
extended astrophysical sources by cross-calibration with the DIRBE
data and a detailed comparison with ISO/ISOPHOT data.
)
are obtained thanks to the absolute
calibration, based on ground and in-flight measurements of controlled
blackbodies and a physical model of the instrument. This original calibration
scheme gives the best calibration accuracy
of today's large telescope submillimeter instruments. We have
validated the point source calibration accuracy of PRONAOS/SPM by comparing a
detailed submillimeter emission model of the Saturn planet and the
PRONAOS/SPM observations. We also checked the calibration on compact and
extended astrophysical sources by cross-calibration with the DIRBE
data and a detailed comparison with ISO/ISOPHOT data.
These comparisons confirm the accuracy of the PRONAOS/SPM calibration and therefore validate the original scientific results obtained using the PRONAOS/SPM instrument.
The calibration methodology described in this paper has direct implications on the preparation of future submillimeter space missions such as Planck and Herschel.
Acknowledgements
The PRONAOS program was funded by CNES, with the support of the CNRS laboratories. We thank the CNRS technical team whose work was essential to the realisation of the SPM instrument, the CNES team for developing and operating the gondola and telescope and the NSBF team at Fort Sumner for the flight operations.We would like to thank E. Lellouche and R. Moreno for they helpful discussions on Saturn atmosphere models.
The emission spectrum of the center of the apparent Saturn disk
(sub-Earth point) is taken from the Bézard et al. 1986 model.
They have computed the submillimeter spectrum of
Saturn in the 10-200 cm-1 range with a spectral resolution
better than 0.1 cm-1. Figure A.1 presents
the predicted temperature brightness spectrum. In order to obtain the
sub-Earth temperature brightness observed by PRONAOS/SPM, we have integrated
this spectrum in the PRONAOS/SPM bands (see
Fig. A.1). In the four PRONAOS/SPM spectral
channels, the Rayleigh-Jeans brightness temperatures obtained for the
Saturn sub-point are 70.9, 79.3, 96.0 and 111.5 K (
![]() ).
The expected absolute accuracy of these temperatures is about 5%, as
quoted in Bézard et al. (1986).
).
The expected absolute accuracy of these temperatures is about 5%, as
quoted in Bézard et al. (1986).
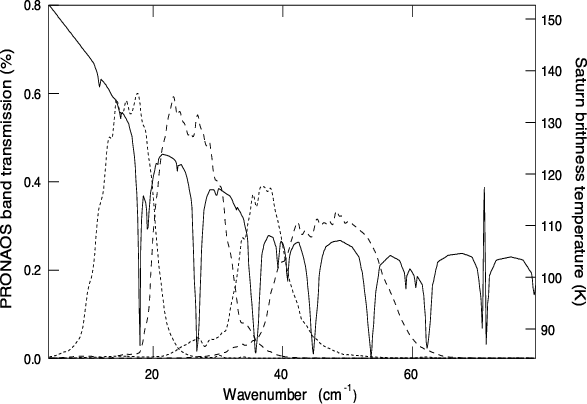 |
Figure A.1: Spectrum of Saturn's disk (continuous line) as quoted in Bézard et al. (1986), and the transmission shape of the four PRONAOS/SPM spectral channels (dashed lines). |
Then, the whole disk emission is computed from the radii dimensions of
Saturn and the flux intensity variations from the center to the edge
of the planet. We have used the radii at 1 bar pressure of
Mullin (1984), i.e.
![]() km,
km,
![]() km at
the equator and pole respectively. The Saturn disk emission is limb
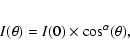
darkened in the submillimeter and millimeter range. Muhleman & Berge
(1982) have modelled it at 2.7 mm using the following law:
km at
the equator and pole respectively. The Saturn disk emission is limb
darkened in the submillimeter and millimeter range. Muhleman & Berge
(1982) have modelled it at 2.7 mm using the following law:
Finally, we have taken into account the dilution factor of the planet
inside the PRONAOS/SPM beams (Sect. 3.3;
Table 4). The apparent size of Saturn at the observing
time was
![]() ,
which
corresponds to a solid angle of
,
which
corresponds to a solid angle of
![]() sr (Astronomical
Almanac 1996). Note, that in our case, we do not need to
correct the apparent disk size for the polar angle tilt because the
tilt angle is less than 6
sr (Astronomical
Almanac 1996). Note, that in our case, we do not need to
correct the apparent disk size for the polar angle tilt because the
tilt angle is less than 6![]() (Astronomical Almanac
1996), which induces a correction smaller than 0.2%.
(Astronomical Almanac
1996), which induces a correction smaller than 0.2%.
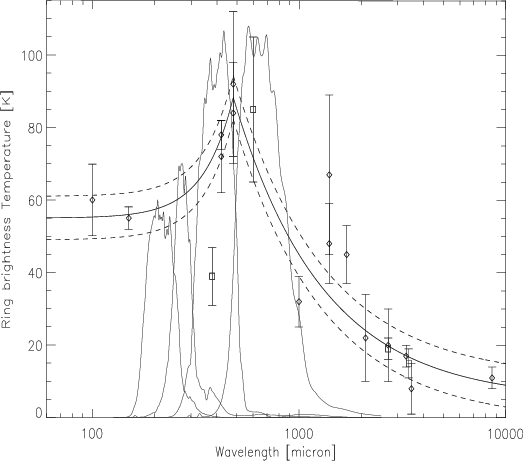 |
Figure A.2:
Brightness temperature spectrum of
the Saturn rings. The black diamonds are the data collected by
Esposito et al. (1984), the grey squares are the Roellig et al.
(1988), Grossman et al. (1990), Dowling et al. (1987) and de Pater & Dickel (1991) data and
their 1 |
We have used a simple model, inspired from Schloerb et al.
(1997), in order to predict the emission from the Saturn's
rings. The model considers only the contribution of the A, B and C
rings. The flux of the other rings is negligible because of their
smaller solid angle and density (Cuzzi et al. 1984). We have assumed
equal and uniform brightness temperature for the rings, and no
dependence upon ring inclination because of the lack of constraining
data. Saturn ring brightness temperatures have been collected by
Esposito et al. (1984) and de Pater & Dickel
(1991). They have shown strong variations upon wavelengths. de
Pater & Dickel (1991) have modelled these variations for wavelengths
above 480 ![]() m using:
m using:
Where the rings obscure the disk, the disk emission is reduced by the
ring optical depth ![]() ,
which varies with the ring inclination B as
,
which varies with the ring inclination B as

The geometry of the rings has been computed from the Astronomical
Almanac (1996) ephemerid. We have found thesolid angles 4.94, 6.64,
![]() sr for the rings A, B and C, and 0.88, 1.6 and
sr for the rings A, B and C, and 0.88, 1.6 and
![]() sr for the rings in front of the Saturn disk.
Therefore, on one hand the whole planet brightness temperature is
increased by 9.7
sr for the rings in front of the Saturn disk.
Therefore, on one hand the whole planet brightness temperature is
increased by 9.7 ![]() 1.7%, 11.1
1.7%, 11.1 ![]() 1.8%, 13.2
1.8%, 13.2 ![]() 1.5%, and
12.8
1.5%, and
12.8 ![]() 1.2% in the four PRONAOS/SPM bands, due to the ring
emission. On the other hand, the rings hide 5.9% of the disk surface
and the disk flux through the rings is only 0.6
1.2% in the four PRONAOS/SPM bands, due to the ring
emission. On the other hand, the rings hide 5.9% of the disk surface
and the disk flux through the rings is only 0.6 ![]() 0.2% of the
planet brightness temperature. Therefore, the whole planet brightness
temperature is also decreased by 5.3
0.2% of the
planet brightness temperature. Therefore, the whole planet brightness
temperature is also decreased by 5.3 ![]() 0.2% due to the ring
absorption.
0.2% due to the ring
absorption.
Note, that in our case, the angle between the Sun, Saturn, and the
Earth was only 0.6![]() (Astronomical Almanac 1996). Therefore,
no disk phase or ring shadowing was taken into account here.
(Astronomical Almanac 1996). Therefore,
no disk phase or ring shadowing was taken into account here.
Table 7 summarizes the contributions to the
whole planet emission mentioned previously. The Rayleigh-Jeans
temperatures in the PRONAOS/SPM spectral bands, obtained using the
model are 71.4 ![]() 3.7, 81
3.7, 81 ![]() 4.2, 99.9
4.2, 99.9 ![]() 5.0 and 115.8
5.0 and 115.8 ![]() 5.8.
The errors quoted are the quadratic sum of the different factors error.
5.8.
The errors quoted are the quadratic sum of the different factors error.