![\begin{figure}
\par\includegraphics[width=15.3cm,clip]{3832f1.eps}
\end{figure}](/articles/aa/full/2006/03/aa3832-05/Timg24.gif) |
Figure 1:
Spectra of the sample stars around H |
| Open with DEXTER | |
In the text
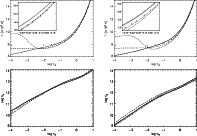 |
Figure 2:
Comparison of different model atmospheres:
temperature structure ( top) and electron density ( bottom) for two supergiant
models as a function of the Rosseland optical depth. On the left for the
LC Ib with stellar parameters
according to our model for |
| Open with DEXTER | |
In the text
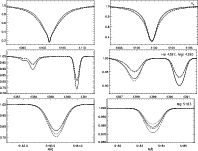 |
Figure 3:
Comparison of theoretical non-LTE profiles for several diagnostic
lines, calculated on the basis of different model
atmospheres for A0 supergiants of LC Ib ( |
| Open with DEXTER | |
In the text
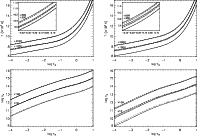 |
Figure 4:
Influence of the helium abundance on the atmospheric structure ( bottom)
and effects of metallicity ( middle) and microturbulence (top set of curves)
on the atmospheric line blanketing:
temperature structure ( upper panels) and electron density ( lower panels). On
the left the comparison is made for a LC Ib object with stellar parameters
matching those of our model for |
| Open with DEXTER | |
In the text
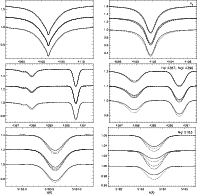 |
Figure 5:
Influence of the helium abundance ( bottom), metallicity ( middle) and
microturbulence ( top set of curves) on the profiles of diagnostic lines for
our models for |
| Open with DEXTER | |
In the text
![\begin{figure}
\par\includegraphics[width=8.2cm,clip]{3832f6.eps}
\end{figure}](/articles/aa/full/2006/03/aa3832-05/Timg44.gif) |
Figure 6:
Example for the occurrence of pressure inversion in supergiants of spectral types
later than |
| Open with DEXTER | |
In the text
![\begin{figure}
\par\includegraphics[width=7.8cm,clip]{3832f7a.eps}\par\vspace*{2mm}
\includegraphics[width=7.8cm,clip]{3832f7b.eps}\end{figure}](/articles/aa/full/2006/03/aa3832-05/Timg47.gif) |
Figure 7:
Comparison of non-LTE departure coefficients bi for O I
( top) and Fe II ( bottom) in HD 92207 as a function of
|
| Open with DEXTER | |
In the text
![\begin{figure}
\par\includegraphics[width=8cm,clip]{3832f8a.eps}\hspace*{4mm}
\includegraphics[width=8cm,clip]{3832f8b.eps}
\end{figure}](/articles/aa/full/2006/03/aa3832-05/Timg50.gif) |
Figure 8:
Impact of stellar parameter variations on non-LTE line profile fits
for H |
| Open with DEXTER | |
In the text
![\begin{figure}
\par\includegraphics[width=7.8cm,clip]{3832f9a.eps}\hspace*{4mm}
\includegraphics[width=7.8cm,clip]{3832f9b.eps}\end{figure}](/articles/aa/full/2006/03/aa3832-05/Timg52.gif) |
Figure 9:
Temperature determination for |
| Open with DEXTER | |
In the text
![\begin{figure}
\par\includegraphics[width=8cm,clip]{3832f10a.eps}\hspace*{4mm}
\includegraphics[width=8cm,clip]{3832f10b.eps}\end{figure}](/articles/aa/full/2006/03/aa3832-05/Timg53.gif) |
Figure 10:
Fit diagrams of temperature- and gravity-sensitive indicators for
|
| Open with DEXTER | |
In the text
![\begin{figure}
\includegraphics[width=12cm,clip]{3832f11.eps}\end{figure}](/articles/aa/full/2006/03/aa3832-05/Timg55.gif) |
Figure 11:
Determination of projected rotational and macroturbulent
velocities, exemplarily shown for three spectral regions of |
| Open with DEXTER | |
In the text
![\begin{figure}
\par\includegraphics[width=12cm,clip]{3832f12.eps}\end{figure}](/articles/aa/full/2006/03/aa3832-05/Timg72.gif) |
Figure 12:
Computed (red full lines) and measured spectral energy
distributions for the sample stars from the UV to the near-IR in the
K-band. Overall, good to excellent agreement is obtained.
Displayed are IUE spectrophotometry
(full lines), Johnson (boxes), Strömgren (triangles), Walraven (filled circles)
and Geneva photometry (open circles). The observations have been dereddened
using colour excesses according to Table 2. A ratio
RV =
AV/E(B-V) = 3.1, as typical for the local ISM, is assumed for
|
| Open with DEXTER | |
In the text
![\begin{figure}
\par\includegraphics[width=12cm,clip]{3832f13.eps}\end{figure}](/articles/aa/full/2006/03/aa3832-05/Timg92.gif) |
Figure 13:
Elemental abundances in |
| Open with DEXTER | |
In the text
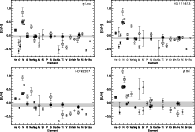 |
Figure 14:
Results from the elemental abundance analysis (relative to the
solar composition) for our sample stars. Filled symbols denote non-LTE, open
symbols LTE results. The symbol size codes the number of spectral lines
analysed - small: 1 to 5, medium: 6 to 10, large: more than 10.
Boxes: neutral, circles: single-ionized, diamonds: double-ionized species.
The error bars represent 1 |
| Open with DEXTER | |
In the text
![\begin{figure}
\par\includegraphics[width=16.5cm,clip]{3832f15.eps}\end{figure}](/articles/aa/full/2006/03/aa3832-05/Timg95.gif) |
Figure 15:
Comparison of our spectrum synthesis (thin red line) with
the high-resolution spectrum of HD 92207 (full line). The major spectral
features are identified, short vertical marks designate Fe II lines.
The location of the diffuse interstellar band around 4430 Å is indicated.
With few exceptions, excellent agreement between theory and observation is found
(H |
| Open with DEXTER | |
In the text
![\begin{figure}
\par\includegraphics[width=12cm]{3832f16.eps} %\end{figure}](/articles/aa/full/2006/03/aa3832-05/Timg97.gif) |
Figure 16:
The evolutionary status of the sample stars and mixing with
nuclear-processed matter. Evolutionary tracks
accounting for mass-loss and rotation from Meynet & Maeder (2003)
are displayed, for solar metallicity at an initial rotational velocity
of 300 km s-1 (full line) and the non-rotating case (dotted line).
Numbers along the tracks give the ratio of N/C (by mass, (N/C)0 is the
initial value). For the sample objects (dots) the
observed ratios are given. The three more massive supergiants
have most likely evolved directly from the main sequence, whereas |
| Open with DEXTER | |
In the text
![\begin{figure}
\par\includegraphics[width=16.5cm,clip]{3832f17.eps}
\end{figure}](/articles/aa/full/2006/03/aa3832-05/Timg99.gif) |
Figure 17:
Same as Fig. 15, however artifically degraded to 5 Å resolution. The excellent agreement between theory and observation is
preserved. Deviations are found only for H |
| Open with DEXTER | |
In the text
![\begin{figure}
\par\includegraphics[width=16.5cm,clip]{3832f18.eps}
\end{figure}](/articles/aa/full/2006/03/aa3832-05/Timg100.gif) |
Figure 18:
Same as Fig. 17, but artifically degraded to a
|
| Open with DEXTER | |
In the text