A&A 445, 889-899 (2006)
DOI: 10.1051/0004-6361:20053752
S. Tinti1 - G. De Zotti1,2
1 - SISSA/ISAS, via Beirut 4, 34014 Trieste, Italy
2 - INAF, Osservatorio Astronomico, Vicolo
dell'Osservatorio 5, 35122 Padova, Italy
Received 4 July 2005 / Accepted 8 September 2005
Abstract
We have used the available samples of Gigahertz Peaked
Spectrum (GPS) galaxies to investigate their evolution properties
in the framework of the "youth'' scenario. Care was taken to
properly allow for the different selection criteria used to define
the samples. We find that the observed redshift and peak frequency
distributions can be satisfactorily accounted for in terms of
simple luminosity evolution of individual sources, along the lines
discussed by Fanti et al. (1995, A&A, 302, 317) and Begelman (1996, in Proc. Cygnus A, Study of Radio Galaxy; 1999, in Proc. of KNAW Colloq.),
although the derived parameter values have large uncertainties due
to ambiguities in the selection of GPS sources and to the
incompleteness of redshift measurements. However the simplest
self-similar model, whereby the evolution is controlled only by
the radial profile of the density of the ambient medium is not
good enough and one additional parameter needs to be introduced.
The fit requires a decrease of the emitted power and of the peak
luminosity with source age or with decreasing peak frequency, at
variance with the Snellen et al. (2000, MNRAS, 319, 445) model. On the other hand,
our analysis confirms the rather flat slope of the luminosity
function, found by Snellen et al. (2000) who also report
indications of a high luminosity break, not required by the data
sets we have used. Our results suggest that the GPS galaxies are
the precursors of extended radio sources with luminosities below
the break of the luminosity function. No cosmological evolution of
the GPS galaxy population is required by presently available data.
Key words: galaxies: active - radio continuum: galaxies
Several lines of evidence increasingly point to Gigahertz Peaked Spectrum (GPS) sources (see O'Dea 1998 for a comprehensive review) being extremely young. Spectral age constraints, energy supply arguments and, most convincingly, VLBI kinematic studies, are all consistent with the current radio activity in these objects having turned on less than about 1000 years ago (Conway 2002), although in some cases there is evidence that this is not the first instance of activity, but sources appear to have been re-activated after a period of quiescence (Baum et al. 1990), perhaps by effect of merger activity (Tingay et al. 2003). These sources thus offer the exciting opportunity of studying radio sources in early stages of development.
There is a clear anti-correlation between the peak (turnover)
frequency, ![]() ,
and the projected linear size of GPS sources
(Fanti et al. 1990; O'Dea & Baum 1997). Although this
anti-correlation does not necessarily define the evolutionary
track, a decrease of the peak frequency as the emitting blob
expands is indicated, suggesting a scenario whereby GPS sources
evolve into Compact Steep Spectrum (CSS) sources and, finally,
into the classical large scale radio sources (Fanti et al. 1995;
Readhead et al. 1996; Begelman 1996; Snellen et al. 2000).
,
and the projected linear size of GPS sources
(Fanti et al. 1990; O'Dea & Baum 1997). Although this
anti-correlation does not necessarily define the evolutionary
track, a decrease of the peak frequency as the emitting blob
expands is indicated, suggesting a scenario whereby GPS sources
evolve into Compact Steep Spectrum (CSS) sources and, finally,
into the classical large scale radio sources (Fanti et al. 1995;
Readhead et al. 1996; Begelman 1996; Snellen et al. 2000).
The self-similar evolution model by Begelman (1996, 1999) imply that the evolution of the radio power as the source expands, depends on the radial profile of the external density. To test this scenario and to constrain the birth rates and the evolutionary properties of these sources, detailed comparisons of the model predictions with survey data are necessary. An exploratory study in this direction was presented by De Zotti et al. (2000), who showed that this kind of models may account for the observed counts, redshift and peak frequency distributions of the samples then available, but for rather unexpected values of the parameters.
Since then, new important surveys of GPS sources have been published, extending the coverage of the peak frequency-redshift plane. The Dallacasa et al. (2000) and Bolton et al. (2004) samples comprise sources with high turnover frequencies (called High Frequency Peakers, HFPs), which are presumably the youngest. Snellen et al. (2002) and Edwards & Tingay (2004) selected samples of southern GPS sources, thus improving the sky coverage. Snellen et al. (2004) focussed on the relatively rare low-zsources. The first year WMAP survey (Bennett et al. 2003b) has provided a complete sample of over 200 sources with simultaneous flux density measurements at 4 frequencies (22.8, 33.0, 40.7, 60.8, and 93.5 GHz), that can be exploited to search for extreme GPS sources, peaking at mm wavelengths.
Moreover, the variability study of the Dallacasa et al. (2000) sample, carried out by Tinti et al. (2005), has shown that most HFP candidates classified as quasars are most likely blazars caught by during a flare of a highly self-absorbed component dominating the emission, while candidates classified as galaxies are consistent with being bona fide HFPs. Polarization measurements (Dallacasa et al., in preparation) lend further support to this conclusion. Torniainen et al. (2005) from a study of the long term variability of 33 objects previously classified as GPS or HFP sources, mostly identified with quasars and mostly peaking above 5 GHz, concluded that only 5 keep the GPS properties over time. Clearly, a serious blazar contamination of GPS samples may lead astray analyses of their statistical properties.
In view of these new data, the previous conclusions on the evolution of the GPS population need to be reconsidered in depth. In this paper we present a new analysis, still in the framework of Begelman's (1996, 1999). Since, as mentioned above, there are strong evidences that samples of GPS sources identified as quasars are heavily contaminated by flaring blazars, we confine our analysis to GPS galaxies. Our reference evolutionary scenario is briefly described in Sect. 2, in Sect. 3 we give an account of the data sets we use, in Sect. 4 we analyze the effect of the different selection criteria adopted to define the samples, in Sect. 5 we present our results, in Sect. 6 we summarize and discuss our main conclusions.
We have adopted a flat ![]() CDM cosmology with
CDM cosmology with
![]() and
and
![]() (Bennett
et al. 2003a).
(Bennett
et al. 2003a).
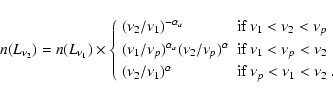
Following De Zotti et al. (2000), we make the following assumptions:
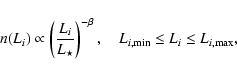 |
(1) |
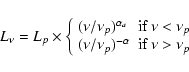 |
(2) |
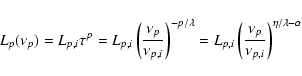
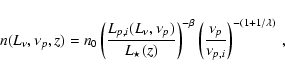
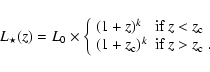
If the birth rate of GPS sources is constant on time scales much
shorter than the cosmological-expansion timescale, the peak
luminosity function per unit
![]() is:
is:
 |
(4) |
The luminosity function at a frequency ![]() is related to that
at a frequency
is related to that
at a frequency ![]() by:
by:
 |
(7) |
| |
= | ![$\displaystyle \int_0^{\min\left[z_f,z_m(S_\nu)\right]} {\rm d}z~
{{\rm d}V\over {\rm d}z}$](/articles/aa/full/2006/03/aa3752-05/img44.gif) |
|
![$\displaystyle \times
\int_{\max[\nu_{p,\rm {min}}(1+z),\nu(1+z)]}^{\min[\nu_{p,\rm {max}}
(1+z),\nu_{p,i}]} {\rm d}\nu_p$](/articles/aa/full/2006/03/aa3752-05/img45.gif) |
|||
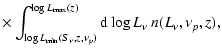 |
(8) |
 |
(9) |
 |
(10) |
 |
(11) |
 |
(12) |
 |
(13) |
Similarly, the number counts of GPS sources with an observed peak
frequency
![]() are given by
are given by
| |
= | |
|
![$\displaystyle \times
\int_{\nu_{p,\rm {min}}(1+z)}^{\min[\nu~(1+z),\nu_{p,\rm {max}}(1+z),\nu_{p,i}]}
{\rm d}\nu_p$](/articles/aa/full/2006/03/aa3752-05/img59.gif) |
|||
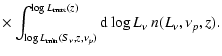 |
(14) |
![$\displaystyle {\cal N}(\nu_{p,0};>S_\nu) =
\int_0^{\min\left[z_f,z_m(S_\nu,\nu_{p,0})\right]} {\rm d}z~
{{\rm d}V\over {\rm d}z}$](/articles/aa/full/2006/03/aa3752-05/img63.gif) |
|||
![$\displaystyle \hspace*{15mm}\times \int_{\log L_{\rm min}(S_\nu,z,\nu_{p,0}(1+z...
...,\nu_{p,0}(1+z))}\!\!\!\!\!\!\!\! {\rm d}\log
L_\nu~ n[L_\nu,z,\nu_{p,0}(1+z)].$](/articles/aa/full/2006/03/aa3752-05/img64.gif) |
(15) |
There is no clear-cut definition of GPS sources and different criteria have been adopted for identifying them. On the other hand, we need to combine at least the most reliable samples to gather enough data for a meaningful analysis to be possible. We now describe the samples used and the corrections applied to make them as homogeneous as possible. The main properties of the samples are summarized in Table 1, where HFP, Stan, B_SA, B_SB, Snel, CORA, Park, and Edwa denote, respectively, the samples by Dallacasa et al. (2000, HFP sample), by Stanghellini et al. (1998), by Bolton et al. (2004, 9C samples A and B), by Snellen et al. (1998, as revised by Snellen et al. 2000, faint WENSS sample), by Snellen et al. (2004, CORALZ sample), by Snellen et al. (2002, Parkes sample), and by Edwards & Tingay (2004, ATCA sample).
Table 1: Summary of GPS samples.
Table 2: GPS candidates from Bolton et al. (2004).
Bolton et al. (2004) selected two complete samples of sources from
the first three regions of the 9C survey: a deeper sample (sample
A), complete to 25 mJy and containing 124 sources over a total
area of 176 square degrees; a shallower sample (sample B),
complete to 60 mJy, comprising 70 sources in an area of 246 square
degrees, including the area covered by sample A. Restricting the
sample B to the 70 sq. deg. not overlapping the sample A we are
left with 31 sources. Simultaneous observations of each source
were made at frequencies of 1.4, 4.8, 22 and 43 GHz with the VLA
and at 15 GHz with the Ryle Telescope. In addition, 51 sources
were observed within a few months at 31 GHz with the Owens Valley
Radio Observatory (OVRO) 40m telescope. Sources with spectral
index between 1.4 and 4.8 GHz
![]() (
(
![]() )
were referred to as GPS sources. The
adopted criterion implies that sources peaking at
)
were referred to as GPS sources. The
adopted criterion implies that sources peaking at
![]() GHz were preferentially (but not exclusively) selected. With
this definition, there are 22 GPS sources in sample A (14 galaxies,
6 quasars and 2 unidentified sources) and 8 (4 galaxies
and 4 quasars) in the (redefined) sample B.
GHz were preferentially (but not exclusively) selected. With
this definition, there are 22 GPS sources in sample A (14 galaxies,
6 quasars and 2 unidentified sources) and 8 (4 galaxies
and 4 quasars) in the (redefined) sample B.
In order to estimate the peak flux densities, Sp, and
frequencies, ![]() ,
of the sources, we have fitted the radio
spectra with the hyperbolic function used by Tinti et al. (2005):
,
of the sources, we have fitted the radio
spectra with the hyperbolic function used by Tinti et al. (2005):
No redshift measurements are available for these sources. However,
as shown by Snellen et al. (1996, 2002), GPS galaxies show a well
defined R-band Hubble diagram, with a low dispersion. In terms
of Gunn r magnitudes, Snellen et al. (1996) found a best fit
relation:
It is important to note that other criteria for selecting GPS samples include tighter constraints on the low- and/or high-frequency spectral indices. The effect of the different selection criteria is discussed in Sect. 4.
Table 3: The HFP galaxy sample. The * denotes an empty field, which was attributed z=1.5.
Although there are, in this sample, some sources with
![]() GHz, the selection criterion biases the sample against such
values of
GHz, the selection criterion biases the sample against such
values of ![]() in a way that we are unable to quantify.
Therefore we have chosen to confine ourselves to sources with
in a way that we are unable to quantify.
Therefore we have chosen to confine ourselves to sources with
![]() GHz. Moreover we have excluded from the sample the
objects with 4.9 GHz flux densities smaller than the completeness
limit of 300 mJy when were they re-observed by Dallacasa et al.
(2000) and Tinti et al. (2005). After having applied these
additional constraints, we are left with 5 HFP galaxies, listed in
Table 3.
GHz. Moreover we have excluded from the sample the
objects with 4.9 GHz flux densities smaller than the completeness
limit of 300 mJy when were they re-observed by Dallacasa et al.
(2000) and Tinti et al. (2005). After having applied these
additional constraints, we are left with 5 HFP galaxies, listed in
Table 3.
Table 4: The faint GPS galaxies from WENSS. The * denotes empty fields, which were attributed z=1.5. Values of z with 3 significant digits are spectroscopic, the others are photometric estimates.
The selection of this sample is described in detail in Snellen
et al. (1998). Snellen et al. (2000) applied stricter criteria
allowing a better control of selection effects; they kept only the
14 objects with inverted spectra between 325 and 5 GHz, and with
325 MHz flux densities > 20 mJy, over an area of
![]() .
The redshift of identified sources, all
classified as galaxies, had to be estimated from their optical
magnitudes, using Eq. (17). For the 4 unidentified
sources, also assumed to be galaxies, a redshift of z=1.5 was
assumed. The relevant data for all the 14 objects are given in
Table 4.
.
The redshift of identified sources, all
classified as galaxies, had to be estimated from their optical
magnitudes, using Eq. (17). For the 4 unidentified
sources, also assumed to be galaxies, a redshift of z=1.5 was
assumed. The relevant data for all the 14 objects are given in
Table 4.
Table 5: The bright GPS galaxies from Stanghellini et al. (1998). The * denotes photometric redshift estimates.
Stanghellini et al. (1998) selected candidate radio bright
GPS sources from the Kühr et al. (1981) catalogue (
![]() Jy), over an area of about
Jy), over an area of about
![]() .
The sample was then cleaned by means of multifrequency VLA and
WSRT observations, supplemented with literature data. They picked
out GPS candidates with a turnover frequency between 0.4 and 6 GHz, and an optically thin spectral index
.
The sample was then cleaned by means of multifrequency VLA and
WSRT observations, supplemented with literature data. They picked
out GPS candidates with a turnover frequency between 0.4 and 6 GHz, and an optically thin spectral index
![]() (
(
![]() ), beyond the peak. The final
complete sample consists of 33 GPS sources, 19 of which are
identified with galaxies. Four galaxies do not have spectroscopic
redshift; estimates by Snellen et al. (2000) from their optical
magnitudes (Eq. (17)) are denoted by a * in
Table 5, where the relevant data for the 19 galaxies
are listed.
), beyond the peak. The final
complete sample consists of 33 GPS sources, 19 of which are
identified with galaxies. Four galaxies do not have spectroscopic
redshift; estimates by Snellen et al. (2000) from their optical
magnitudes (Eq. (17)) are denoted by a * in
Table 5, where the relevant data for the 19 galaxies
are listed.
Table 6: The ATCA sample of GPS galaxies from (Edwards & Tingay 2004). The * denotes empty fields, which were attributed z=1.5.
Edwards & Tingay (2004) have used data from an Australia
Telescope Compact Array (ATCA) program of multi-frequency,
multi-epoch monitoring of the portion of the VSOP survey sample
(Hirabayashi et al. 2000) with declinations
![]() .
The
original sample is defined by:
.
The
original sample is defined by:
![]() Jy,
Jy,
![]() ,
,
![]() .
Taking into account the further
constraint
.
Taking into account the further
constraint
![]() ,
we estimate that the area covered
is
,
we estimate that the area covered
is ![]() sr. The selected sources have
sr. The selected sources have
![]() and spectral curvature
and spectral curvature
![]() .
.
We have excluded from the sample the gravitationally lensed source J0414+0534 because our models do not include the effect of lensing, and J1522-2730, classified as a BL Lac object, whose variability properties suggests that it is less likely to be a truly GPS source (Edwards & Tingay 2004). This leaves 7 GPS galaxies (5 having spectroscopic redshifts), 16 quasars (15 with spectroscopic redshift), and 2 empty fields (see Table 6).
Table 7: The Parkes half-Jansky sample of GPS galaxies (Snellen et al. 2002). The * denotes photometric redshift estimates.
Snellen et al. (2002) selected from the Parkes multifrequency
survey data in a region of about 3.9 sr a southern/equatorial
sample of GPS sources with
![]() Jy, excluding
objects identified as quasars. The sample (see
Table 7) consists of 49 objects with spectra peaking
at
Jy, excluding
objects identified as quasars. The sample (see
Table 7) consists of 49 objects with spectra peaking
at
![]() GHz, 38 of which are identified with galaxies,
10 are too faint to be identified and 1 is too close to a bright
star to allow identification, and is excluded from the statistical
analysis. The authors argue that, based on the magnitude
distribution of other GPS samples, the 10 faint sources are
unlikely to be quasars, and we assume them to be galaxies.
Spectroscopic redshifts are available for 18 objects. Estimates,
or lower limits, for the others have been obtained through
Eq. (17). No restrictions on either the low- or the
high-frequency spectral index are mentioned.
GHz, 38 of which are identified with galaxies,
10 are too faint to be identified and 1 is too close to a bright
star to allow identification, and is excluded from the statistical
analysis. The authors argue that, based on the magnitude
distribution of other GPS samples, the 10 faint sources are
unlikely to be quasars, and we assume them to be galaxies.
Spectroscopic redshifts are available for 18 objects. Estimates,
or lower limits, for the others have been obtained through
Eq. (17). No restrictions on either the low- or the
high-frequency spectral index are mentioned.
Table 8: The CORALZ sample of local GPS galaxies (Snellen et al. 2004).
The sample of Compact Radio sources at Low Redshift (CORALZ) was
selected by Snellen et al. (2004) solely on the basis of the radio
angular size (
![]() ), independent of radio spectra,
picking out sources associated with relatively bright galaxies. It
is estimated to be
), independent of radio spectra,
picking out sources associated with relatively bright galaxies. It
is estimated to be
![]() complete for
complete for
![]() mJy over the redshift range
0.005 < z < 0.16 in a region
of 2850 square degrees. The sample comprises 6 GPS galaxies with
mJy over the redshift range
0.005 < z < 0.16 in a region
of 2850 square degrees. The sample comprises 6 GPS galaxies with
![]() GHz, all with spectroscopic redshifts
(Table 8).
GHz, all with spectroscopic redshifts
(Table 8).
![\begin{figure}
\par\mbox{\includegraphics[width=6.5cm,clip]{3752f1_1.ps}\quad
\includegraphics[width=6.4cm,clip]{3752f1_2.ps} }\end{figure}](/articles/aa/full/2006/03/aa3752-05/img159.gif) |
Figure 1:
Peak flux density versus observed peak
frequency ( left) and peak luminosity versus rest frame turnover
frequency ( right) for GPS galaxies in the various samples. HFP:
filled circles; Bolton sample A: |
| Open with DEXTER | |
The WMAP point source catalogue (Bennett et al. 2003b) comprises
208 point sources with a
![]() detection in any of the 5 WMAP bands, in the range 22.8-93.5 GHz; 203 sources have
counterparts in existing 4.85 GHz, the remaining 5 sources being
probably spurious.
detection in any of the 5 WMAP bands, in the range 22.8-93.5 GHz; 203 sources have
counterparts in existing 4.85 GHz, the remaining 5 sources being
probably spurious.
This is the first simultaneous multifrequency survey at mm
wavelengths and is therefore well suited to select extreme HFPs.
Although the completeness limit is at
![]() Jy (De Zotti et al. 2005), to avoid that the estimates of
spectral indices are too affected by measurement errors we have
confined ourselves to sources with
Jy (De Zotti et al. 2005), to avoid that the estimates of
spectral indices are too affected by measurement errors we have
confined ourselves to sources with
![]() Jy,
and we have picked out those with inverted spectrum (
Jy,
and we have picked out those with inverted spectrum (![]() )
from 22.8 to 33 GHz and from 4.85 to 22.8 GHz. There are 18
sources satisfying these criteria, a number close to the
prediction of the De Zotti et al. (2000) model, for a maximum
initial peak frequency of 200 GHz. Most of these sources are well
known calibrators and have therefore many observations at many
frequencies (see Trushkin 2003). They all show strong variability,
consistent with that observed for blazars (see Tinti 2005); 9 of
them are classified as blazars by Terasranta et al. (1998) or
Donato et al. (2001). The data on the WMAP sample thus confirm
that most quasars showing a peak at tens of GHz are likely blazars
caught during a phase when a flaring, strongly self-absorbed
synchrotron component dominates the emission spectrum (Tinti et al. 2005).
)
from 22.8 to 33 GHz and from 4.85 to 22.8 GHz. There are 18
sources satisfying these criteria, a number close to the
prediction of the De Zotti et al. (2000) model, for a maximum
initial peak frequency of 200 GHz. Most of these sources are well
known calibrators and have therefore many observations at many
frequencies (see Trushkin 2003). They all show strong variability,
consistent with that observed for blazars (see Tinti 2005); 9 of
them are classified as blazars by Terasranta et al. (1998) or
Donato et al. (2001). The data on the WMAP sample thus confirm
that most quasars showing a peak at tens of GHz are likely blazars
caught during a phase when a flaring, strongly self-absorbed
synchrotron component dominates the emission spectrum (Tinti et al. 2005).
![\begin{figure}
\par\includegraphics[width=6.5cm,clip]{3752fig2.ps}
\end{figure}](/articles/aa/full/2006/03/aa3752-05/img164.gif) |
Figure 2: Distributions of measured and estimated redshifts for the HFP, Stanghellini et al. (1998), Snellen et al. (1998), Bolton et al. (2004, sample A), Parkes, and ATCA GPS galaxy samples. Note that the peaks at z=1.5 are due to unidentified sources, assumed to be galaxies at that redshift. |
| Open with DEXTER | |
The observational properties that generally define the different samples are:
To effectively explore the luminosity and peak frequency
evolution of GPS sources, we need samples that provide a wide
coverage of the ![]() -Sp plane. The coverage provided by the
present samples is shown in Fig. 1. HFP sources
(Dallacasa et al. 2000) have turnover frequencies greater than 4.9
GHz, at or above the upper limits of the samples of Stanghellini
et al. (1998) and Snellen et al. (1998, 2002, 2004). Because of
their high selection frequency, 15 GHz, the Bolton et al. (2004)
samples explore the high peak frequency region.
-Sp plane. The coverage provided by the
present samples is shown in Fig. 1. HFP sources
(Dallacasa et al. 2000) have turnover frequencies greater than 4.9
GHz, at or above the upper limits of the samples of Stanghellini
et al. (1998) and Snellen et al. (1998, 2002, 2004). Because of
their high selection frequency, 15 GHz, the Bolton et al. (2004)
samples explore the high peak frequency region.
The samples by Bolton et al. (2004) have flux limits similar to the faint GPS sample selected by Snellen et al. (1998), although at a very different frequency, while the HFP and the Stanghellini et al. (1998), and the Parkes samples contain bright sources.
The redshift distributions of the galaxies in the various samples are shown in Fig. 2. Many redshifts are estimated from optical magnitudes. The peak at z=1.5 is mostly due to optically unidentified GPS sources, assumed, following Snellen et al. (2000), to have that redshift.
![\begin{figure}
\par\mbox{\includegraphics[width=4.5cm,clip]{3752f3_1.ps}\qquad
\...
...ad
\includegraphics[width=4.5cm,clip]{3752f3_5.ps}\hspace*{2.5cm}}\end{figure}](/articles/aa/full/2006/03/aa3752-05/img166.gif) |
Figure 3: Spectra of GPS sources in the various samples, normalized in both frequency and flux density. |
| Open with DEXTER | |
Table 9: Median values of the optically thick and thin spectral indices for the various samples.
As noted above, selection criteria include constraints on the
spectral indices in the optically thick and/or in the optically
thin spectral region. Stanghellini et al. (1998) required
![]() ,
Dallacasa et al. (2000) demanded
,
Dallacasa et al. (2000) demanded
![]() ;
Edwards & Tingay (2004) applied
both constraints. For other samples, the adopted spectral criteria
are less explicit. Snellen et al. (1998, 2000) require an inverted
spectrum at low frequencies and that the Full Width at Half
Maximum of the spectrum is less than 2 decades in frequency; the
latter condition implies that, typically,
;
Edwards & Tingay (2004) applied
both constraints. For other samples, the adopted spectral criteria
are less explicit. Snellen et al. (1998, 2000) require an inverted
spectrum at low frequencies and that the Full Width at Half
Maximum of the spectrum is less than 2 decades in frequency; the
latter condition implies that, typically,
![]() and
and
![]() are
are ![]() ,
a somewhat less restrictive
constraint than adopted for the previously mentioned samples. An
even looser criterion was adopted by Bolton et al. (2004):
,
a somewhat less restrictive
constraint than adopted for the previously mentioned samples. An
even looser criterion was adopted by Bolton et al. (2004):
![]() .
Not many details are given on
spectral criteria for the Parkes sample (Snellen et al. 2002),
while the CORALZ sample (Snellen et al. 2004) was selected on the
basis of radio morphology, not of the spectra.
.
Not many details are given on
spectral criteria for the Parkes sample (Snellen et al. 2002),
while the CORALZ sample (Snellen et al. 2004) was selected on the
basis of radio morphology, not of the spectra.
In Fig. 3 we compare the shapes of the radio
spectra of the sources in the different samples, normalized to the
peak frequencies and to the peak flux densities. It is apparent,
and quantified in Table 9, that the median
![]() of Bolton et al. (2004) sources is
considerably flatter than for the other samples. To homogenize
this sample to the others, we have dropped sources with
of Bolton et al. (2004) sources is
considerably flatter than for the other samples. To homogenize
this sample to the others, we have dropped sources with
![]() .
.
We have fitted separately the redshift and the observed peak
frequency, ![]() ,
distributions of GPS galaxies in the
samples described above. The best fit values of the parameters
have been obtained minimizing the chi-square function with the
Minuit package (CERN libraries). We need to determine:
,
distributions of GPS galaxies in the
samples described above. The best fit values of the parameters
have been obtained minimizing the chi-square function with the
Minuit package (CERN libraries). We need to determine:
![\begin{figure}
\par\mbox{\includegraphics[height=4.2cm,clip]{3752f4_1.ps}\qquad
...
...hspace*{4.5mm}
\includegraphics[height=4.25cm,clip]{3752f4_6.ps} }\end{figure}](/articles/aa/full/2006/03/aa3752-05/img182.gif) |
Figure 4: Comparison of the redshift distributions yielded by the best fit model (dashed) with the observed ones (solid). |
| Open with DEXTER | |
![\begin{figure}
\par\mbox{\includegraphics[height=4.2cm,clip]{3752f5_1.ps}\qquad
...
...\hspace*{4.2mm}
\includegraphics[height=4.2cm,clip]{3752f5_6.ps} }\end{figure}](/articles/aa/full/2006/03/aa3752-05/img183.gif) |
Figure 5: Comparison of the peak frequency distributions yielded by the best fit model (dashed) with the observed ones (solid). |
| Open with DEXTER | |
Figures 4 and 5 compare the model with the observed redshift and peak frequency distributions. The overall agreement is reasonably good, indicating that the underlying scenario is consistent with the current data.
Table 10: Best fit values of the model parameters for GPS galaxies.
The best fit values of the parameters are given in
Table 10. The formal errors on them derived from the
![]() statistics are rather small, but we regard them as
unrealistic in view of the many uncertainties due to the
difficulties in the sample selection; also the redshift
distributions are largely built using photometric redshift
estimates rather than spectroscopic measurements. Thus we prefer
not to report uncertainties that are likely to be deceitful. That
the real uncertainties are probably large is indicated by a
comparison of the present best-fit values of the parameters with
those found by De Zotti et al. (2000) analyzing some of the
samples considered here. In particular, the values of
statistics are rather small, but we regard them as
unrealistic in view of the many uncertainties due to the
difficulties in the sample selection; also the redshift
distributions are largely built using photometric redshift
estimates rather than spectroscopic measurements. Thus we prefer
not to report uncertainties that are likely to be deceitful. That
the real uncertainties are probably large is indicated by a
comparison of the present best-fit values of the parameters with
those found by De Zotti et al. (2000) analyzing some of the
samples considered here. In particular, the values of ![]() and
and
![]() are widely different (the difference of n0 follows
from that of
are widely different (the difference of n0 follows
from that of ![]() ,
see Eq. (5)). Still both
analyses find positive values of
,
see Eq. (5)). Still both
analyses find positive values of ![]() and negative values of
and negative values of
![]() ,
implying that both the emitted radio
power and the peak luminosity decrease with increasing
source age, at variance with the evolution models by Snellen et al.
(2000) and Alexander (2000).
,
implying that both the emitted radio
power and the peak luminosity decrease with increasing
source age, at variance with the evolution models by Snellen et al.
(2000) and Alexander (2000).
The slope of the luminosity function is more stable: we find
![]() while De Zotti et al. (2000) found
while De Zotti et al. (2000) found
![]() .
Both
values are not far from the slope of the low luminosity portion of
the luminosity function of steep spectrum radio sources,
.
Both
values are not far from the slope of the low luminosity portion of
the luminosity function of steep spectrum radio sources,
![]() (Dunlop & Peacock 1990;
Magliocchetti et al. 2002).
(Dunlop & Peacock 1990;
Magliocchetti et al. 2002).
Although new samples have substantially improved the coverage of
the luminosity-redshift-peak frequency space of GPS galaxies,
the assessment of their evolutionary properties is still
difficult. First of all, there is no fully agreed set of criteria
to ascertain whether a source is truly a GPS. The frequently
adopted GPS identification conditions rely on the spectral shape.
However, as mentioned in Sects. 3 and
4, different spectral requirements have been
adopted by different groups and recovering a homogeneous set of
data is not easy and may be even impossible. Other properties that
GPS sources should have, include a compact structure (
![]() kpc), low polarization, low variability, and sub-luminal
component motions. Regrettably, measurements of these quantities
are available only for a limited number of GPS candidates. The
samples we are using may therefore be contaminated by sources of
different nature.
kpc), low polarization, low variability, and sub-luminal
component motions. Regrettably, measurements of these quantities
are available only for a limited number of GPS candidates. The
samples we are using may therefore be contaminated by sources of
different nature.
Also, a significant fraction of objects are still unidentified, and spectroscopy of identified objects is highly incomplete, so that many redshifts are estimated from optical magnitudes. Although GPS galaxies seem to have a rather well defined redshift-magnitude relationship, its dispersion is significant and may increase with redshift.
With these premises we cannot expect to be able to come out with a
clear assessment of the evolutionary properties of GPS galaxies.
Still, some interesting conclusions can be drawn. First, the
simple luminosity evolution scenario for individual sources
outlined in Sect. 2 appears to be fully
consistent with the data. We note however that, although the
formalism stems from the self-similar evolution models by Fanti et al. (1995) and Begelman (1996, 1999), according to which both the
parameters ![]() and
and ![]() are determined by the slope n of
the density profile of the ambient medium, the data can be
satisfactorily fitted only if the two parameters are treated as
independent. This is not surprising, since self-similarity
can be easily broken under realistic conditions, and indeed
deviations from self-similarity were found in the two-dimensional
hydrodynamical simulations of Carvalho & O'Dea (2002).
are determined by the slope n of
the density profile of the ambient medium, the data can be
satisfactorily fitted only if the two parameters are treated as
independent. This is not surprising, since self-similarity
can be easily broken under realistic conditions, and indeed
deviations from self-similarity were found in the two-dimensional
hydrodynamical simulations of Carvalho & O'Dea (2002).
The fit is obtained for a positive value of ![]() and a negative
value of p, implying a decrease of the emitted power and of the
peak luminosity with source age or with decreasing peak frequency,
at variance with the Snellen et al. (2000) model. On the other
hand, our analysis confirms the rather flat slope of the
luminosity function, found by Snellen et al. (2000) who also
report indications of a high luminosity break, not required by the
data sets we have used. Snellen et al. (2000) argue that, in the
framework of a scenario whereby GPS sources increase their
luminosity until they reach a size
and a negative
value of p, implying a decrease of the emitted power and of the
peak luminosity with source age or with decreasing peak frequency,
at variance with the Snellen et al. (2000) model. On the other
hand, our analysis confirms the rather flat slope of the
luminosity function, found by Snellen et al. (2000) who also
report indications of a high luminosity break, not required by the
data sets we have used. Snellen et al. (2000) argue that, in the
framework of a scenario whereby GPS sources increase their
luminosity until they reach a size ![]() kpc and dim
thereafter, during the CSS and extended radio source phases, the
luminosity function of GPS galaxies can evolve into that extended
radio sources. Our results suggest that the GPS galaxies are the
precursors of extended radio sources with luminosities below the
break of the luminosity function (
kpc and dim
thereafter, during the CSS and extended radio source phases, the
luminosity function of GPS galaxies can evolve into that extended
radio sources. Our results suggest that the GPS galaxies are the
precursors of extended radio sources with luminosities below the
break of the luminosity function (
![]() at 2.7 GHz,
cf. Dunlop & Peacock 1990, De Zotti et al. 2005). Our best fit
model implies that the source luminosity is, roughly, inversely
proportional to the source age. If GPS sources have typical ages
of
at 2.7 GHz,
cf. Dunlop & Peacock 1990, De Zotti et al. 2005). Our best fit
model implies that the source luminosity is, roughly, inversely
proportional to the source age. If GPS sources have typical ages
of
![]() yr and extended radio sources of
yr and extended radio sources of
![]() yr, we expect the latter to be
yr, we expect the latter to be
![]() times less
powerful than the former; as shown by Fig. 1, the
maximum value of the peak luminosity we found is
times less
powerful than the former; as shown by Fig. 1, the
maximum value of the peak luminosity we found is
![]() (but this may
be a lower limit, since we have arbitrarily set the maximum
redshift at zf=1.5), i.e. about 3 orders of magnitude larger
than
(but this may
be a lower limit, since we have arbitrarily set the maximum
redshift at zf=1.5), i.e. about 3 orders of magnitude larger
than
![]() .
The GPS sources in the samples considered
here are thus expected to evolve into large-scale radio galaxies
with
.
The GPS sources in the samples considered
here are thus expected to evolve into large-scale radio galaxies
with
![]() .
.
It must be stressed, however, that the uncertainties are very
large, so that firm conclusions must await for larger samples and
more complete redshift information. In particular, we have
checked that still acceptable fits can be obtained setting the
exponent ![]() of the relationship between the emitted radio
power and the source age to the value implied by Begelman's model
for n=2, i.e.
of the relationship between the emitted radio
power and the source age to the value implied by Begelman's model
for n=2, i.e. ![]() (the total
(the total ![]() increases by
increases by
![]() ). In this case, the source luminosities
would typically decrease by a factor of
). In this case, the source luminosities
would typically decrease by a factor of
![]() from the GPS to
the extended radio source phase, and GPS sources could be the
progenitors of extended radio sources with luminosities both above
and below
from the GPS to
the extended radio source phase, and GPS sources could be the
progenitors of extended radio sources with luminosities both above
and below
![]() .
It is plausible that sources have a
distribution of values of
.
It is plausible that sources have a
distribution of values of ![]() whereby the lower values become
increasingly rare, to account for the steepening of the luminosity
function above
whereby the lower values become
increasingly rare, to account for the steepening of the luminosity
function above
![]() .
Alternatively, the fraction of
prematurely fading sources may increase with luminosity. If
.
Alternatively, the fraction of
prematurely fading sources may increase with luminosity. If
![]() ,
the best fit value of
,
the best fit value of ![]() is 1.02, and the peak
luminosity,
is 1.02, and the peak
luminosity,
![]() increases, albeit slowly, with decreasing peak frequency (
increases, albeit slowly, with decreasing peak frequency (
![]() ,
cf.
Eq. (3)). The other values of the parameters keep values
very close to those in Table 10.
,
cf.
Eq. (3)). The other values of the parameters keep values
very close to those in Table 10.
Another key observable quantity potentially providing crucial
constraints on evolutionary models is the linear size. The
self-similar evolution models predict its dependence on source
age, given the density profile of the ambient medium, and on the
other fundamental observable, the radio power. However, as noted
above, we could not fit the data with strictly self-similar
models, so that we no longer have a well defined relationship
between radio power and linear size. Such a relationship, however,
can be recovered through the observed relationship between
turnover frequency and linear size,
![]() ,
with
,
with
![]() ;
we have
;
we have
![]() .
The anticorrelation between the latter
quantities implies that, since the radio power decreases
with decreasing peak frequency, it decreases with increasing
linear size. Once again, however, the uncertainties are very
large. The formal best fit values of the parameters would imply an
unrealistically steep decrease of the radio power, L, with
increasing linear size, l, but, if
.
The anticorrelation between the latter
quantities implies that, since the radio power decreases
with decreasing peak frequency, it decreases with increasing
linear size. Once again, however, the uncertainties are very
large. The formal best fit values of the parameters would imply an
unrealistically steep decrease of the radio power, L, with
increasing linear size, l, but, if ![]() ,
,
![]() and
and
![]() .
.
In turn, fixing the exponent ![]() of the relationship between
peak frequency and source age to the value implied by Begelman's
model for n=2, i.e.
of the relationship between
peak frequency and source age to the value implied by Begelman's
model for n=2, i.e.
![]() ,
we get again an
increase of the minimum
,
we get again an
increase of the minimum ![]() by
by
![]() ,
the
best fit value of
,
the
best fit value of ![]() is 0.76, while the other parameters are
essentially unchanged. In this case we have
is 0.76, while the other parameters are
essentially unchanged. In this case we have
![]() ,
,
![]() ,
and
,
and
![]() .
.
These examples illustrate the importance of the determination of linear sizes for large complete samples of GPS sources. Given their extreme compactness and their redshift distribution, images with milli-arcsec resolution are generally required. It is thus not surprising the the currently available information is scanty and inhomogeneous. New VLBA data are however being acquired and analyzed, for example on the HFP sample (Orienti et al. 2005). Future evolutionary models should comply also with the distributions of linear sizes and with relationships of sizes with radio power.
Complementary information on the proposed evolutionary sequence linking GPS sources to large scale radio sources is provided by CSS sources, which could correspond to the intermediate phase when sources have expanded out of the narrow line region but are still within the host galaxy. More complete evolutionary studies should take into account also these sources.
Acknowledgements
We warmly thank Daniele Dallacasa for useful discussions and suggestions. This work has made use of the NASA/IPAC Extragalactic Database NED which is operated by the JPL, California Institute of Technology, under contract with the National Aeronautics and Space Administration. The authors acknowledge financial support from the Italian ASI and MIUR.
![\begin{displaymath}\log(S)=\log(S_p)+
b-\left[b^2+c^2(\log\nu-\log\nu_{p})^2\right]^{1/2}.
\end{displaymath}](/articles/aa/full/2006/03/aa3752-05/img132.gif)