A&A 444, 861-870 (2005)
DOI: 10.1051/0004-6361:20053483
S. R. Pottasch1 - R. Surendiranath2
1 - Kapteyn Astronomical Institute, PO Box 800, 9700 AV Groningen,
The Netherlands
2 - Indian Institute of Astrophysics, Koramangala II Block,
Bangalore 560034, India
Received 20 May 2005 / Accepted 22 August 2005
Abstract
ISO spectra of the bipolar planetary
nebula Mz 3 are used to determine the element abundances in the
bright lobes of the nebula. The ISO spectra alone are sufficient to determine
nitrogen, neon, argon, sulfur and iron abundances. These spectra are combined
with spectra in the visual wavelength region (taken from the literature) to
obtain an extinction corrected spectrum which is used to determine the
abundance of oxygen and some other elements using a classical determination.
We have tried abundance determination using photoionization modeling using
CLOUDY, which is essential for determining the helium, silicon and
chlorine abundances. It was found difficult to model the entire spectrum.
New information about the central star could be determined. The abundances
determined are found to differ somewhat from earlier results using only visual
spectra. The reasons for this difference are discussed. An elevated helium
abundance is found, agreeing with the determination of Smith 2003.
Taken together with the high nitrogen abundance found, it is concluded that
the exciting star of Mz 3 had a high progenitor mass.
Key words: ISM: abundances - stars: AGB and post-AGB - planetary nebulae: individual: Mz 3
Mz 3 (Menzel 3) is an intrinsically bright young bipolar planetary
nebula (PN 331.7-01.0). It extends for more than 50
![]() along its
major axis, although its two bright polar lobes extend about 12
along its
major axis, although its two bright polar lobes extend about 12
![]() in an almost north-south direction on either side of its bright
unresolved nucleus. It has been well studied in recent years. The
visual and infrared spectrum has been studied by Zhang & Liu
(2002), by Smith (2003) and by Smith &
Gehrz (2005). A radio interferometric study of the nebula at
four wavelengths between 3.5 cm and 21 cm has been made by Bains et al. (2004); the 6 cm flux density they find, about 630 mJy
indicates that the nebula is one of the strongest emission sources
in the sky. It is therefore reasonably close although there is no
reliable estimate of its distance.
in an almost north-south direction on either side of its bright
unresolved nucleus. It has been well studied in recent years. The
visual and infrared spectrum has been studied by Zhang & Liu
(2002), by Smith (2003) and by Smith &
Gehrz (2005). A radio interferometric study of the nebula at
four wavelengths between 3.5 cm and 21 cm has been made by Bains et al. (2004); the 6 cm flux density they find, about 630 mJy
indicates that the nebula is one of the strongest emission sources
in the sky. It is therefore reasonably close although there is no
reliable estimate of its distance.
Narrow band HST images of the nebula have been studied by Guerrero et al. (2004) and Santander-Garcia et al. (2004). It is clearly a very complicated nebula. Besides the bright inner lobes, there are also cylindrical and conical lobes and an equatorial ellipse. These structures extend much further than the bright conical lobes and are at a much lower intensity level. None of these additional structures is seen in the radio maps of Bains et al. (2004). In this paper we concern ourselves only with the bright inner lobes and the central source.
The nebula is located close to the galactic plane, in a region of the sky with a rather high extinction. It is difficult to obtain an exact value of the extinction but in this direction it probably lies between 1 and 2 mag/kpc (see e.g. Lucke 1978). The extinction of the nebula is rather high: much of it is interstellar but some of it is local to the nebula. We shall discuss this presently. Here we may note one of the consequences of the high extinction: the attempt at obtaining an IUE spectrum of the nebula produced a very noisy and unusable spectrum, although other nebulae which are even weaker radio sources produced good IUE spectra with the same observing time.
![\begin{figure}
\par\includegraphics[height=8cm,width=8.4cm,clip]{fig1.eps}
\end{figure}](/articles/aa/full/2005/48/aa3483-05/img8.gif) |
Figure 1: Mz 3 in the [Ne II] 12.8 micron line with the ISO apertures superposed. The [Ne II] image is the deconvolved map of Smith & Gehrz (2005). |
| Open with DEXTER | |
We have earlier studied nebulae with bilobal structure which at first sight appear similar to Mz 3. These are NGC 6357 (Pottasch et al. 2000) and Hb5 (unpublished). Besides the bilobal structure both of these nebulae have a bright central source which is also nebular. In these two cases however most of the emission comes from the central nebula and the lobes make only a negligible contribution to the total emission. In Mz 3 it is the lobes which make the largest contribution to the total emission although the contribution of the central source is not negligible. It may be that Mz 3 is a younger version of these three nebulae. There are two reasons for this supposition. Firstly because the temperature of the central star is rather low (between 35 000 K and 40 000 K) compared to well over 100 000 K for the other two nebulae. Secondly because the electron density is very high in the central nebula of Mz 3, over 106 cm-3, i.e. at least two orders of magnitude higher than in the central source of the two other nebulae. In Mz 3 it is the lobes which have an electron density of 104 cm-3, while the lobes in the other two nebulae have a much lower density.
The nature of the central source is not completely understood. It
contains the source of nebular ionization (the central star) but it
also contains nebular emission. This is shown by several
measurements. First, the spectrum of the central source contains
emission lines. The visual spectrum through a very small diaphragm
shows nebular forbidden lines
([O II], [O III], [N II] etc.) and
emission lines of forbidden iron in several stages of ionization
(Zhang & Liu 2002; Smith 2003). The infrared images
clearly show [Ne II] strongly from the central source
(Smith 2003; the VISIR observations, Lagage et al. 2004). Secondly the hydrogen lines are clearly seen in
emission from the central source. Zhang & Liu (2002) measure
H![]() from the central source and Smith (2003) images
Paschen
from the central source and Smith (2003) images
Paschen ![]() .
The radio measurements show the central source
quite clearly (Bains et al. 2004) in continuum emission. It is
optically thick at the shortest wavelength measured (3.6 cm) and its
size is less than 1
.
The radio measurements show the central source
quite clearly (Bains et al. 2004) in continuum emission. It is
optically thick at the shortest wavelength measured (3.6 cm) and its
size is less than 1
![]() .
The VISIR observations show that the
central nebula is diffraction limited, which means that its diameter
probably is less than 0.4
.
The VISIR observations show that the
central nebula is diffraction limited, which means that its diameter
probably is less than 0.4
![]() ,
and further it has an expansion velocity of
about 50 to 70 km s-1. The small size is related to the high density
mentioned above, which was found from the forbidden iron lines. The
age of the central nebula (depending on the distance) is probably less
than 100 years and its mass is of order
,
and further it has an expansion velocity of
about 50 to 70 km s-1. The small size is related to the high density
mentioned above, which was found from the forbidden iron lines. The
age of the central nebula (depending on the distance) is probably less
than 100 years and its mass is of order
![]() solar masses.
solar masses.
In Fig. 1 an image of Mz 3 is shown in the light of the
[Ne II] line (taken from Smith & Gehrz 2005). The image
is very similar to that shown in the light of Paschen ![]() (Smith 2003). The ISO diaphragm is
shown superimposed on the figure. More will be said presently over the ISO
observations. We may already point out that one of the difficulties in
interpreting the ISO data lies in the fact that the central source and
the lobes were measured together, but they must be analyzed separately
because their densities are very different.
(Smith 2003). The ISO diaphragm is
shown superimposed on the figure. More will be said presently over the ISO
observations. We may already point out that one of the difficulties in
interpreting the ISO data lies in the fact that the central source and
the lobes were measured together, but they must be analyzed separately
because their densities are very different.
The purpose of this paper is primarily to determine the chemical abundances for this nebula which is of importance in discussing the evolution of the nebula. Secondly the analysis of the spectrum will yield information on the temperature of the exciting star. This goal is achieved first by analyzing the ISO spectroscopic data. Second, by applying state-of-the-art photoionization modeling, to attempt to reproduce the overall spectral energy distribution and the observed nebular emission line intensities in the visual and the infrared range. The abundances in this nebula have been determined earlier by Zhang & Liu (2002) and by Smith (2003), using only the visual spectrum.
The advantages of incorporating the ISO spectroscopy in our analysis have previously been discussed (e.g. see Pottasch & Beintema 1999; Pottasch et al. 2000, 2001; Bernard Salas et al. 2001), and can be summarized as follows.
The infrared lines originate
from very low energy levels and thus give an abundance which is
insensitive to the temperature in the nebula, and to possible temperature
fluctuations. Furthermore, when a line originating from a high-lying
energy level in the same ion is observed, it is possible to determine
an effective (electron) temperature ![]() at which the lines of that
particular ion are formed. When
at which the lines of that
particular ion are formed. When ![]() for many ions can be
determined, it is possible to make a plot of
for many ions can be
determined, it is possible to make a plot of ![]() against
ionization potential, which can be used to determine the
against
ionization potential, which can be used to determine the ![]() for ions for which only lines originating from a high energy level are
observed. Use of an effective electron temperature takes into account
the fact that ions are formed in different regions of the nebula. This way
possible temperature fluctuations within the nebula can be taken into account.
for ions for which only lines originating from a high energy level are
observed. Use of an effective electron temperature takes into account
the fact that ions are formed in different regions of the nebula. This way
possible temperature fluctuations within the nebula can be taken into account.
Use of the ISO spectra have further advantages. One of them is that the number of observed ions used in the abundance analysis is approximately doubled, which removes the need for using large "ionization correction factors'', thus substantially lowering the uncertainty in the abundances derived for some elements.
A further advantage is that the extinction in the infrared is almost negligible, especially important because of the large extinction in Mz 3, and the fact that some of the extinction varies over the nebula.
A second method of improving the abundances is by using a nebular model to determine them. This has several advantages. First it provides a physical basis for the electron temperature determination. Secondly it permits abundance determinations for elements which are observed in only one, or a limited number of ionic stages, which could not be accurately determined without a model. A further advantage of modeling is that it provides physical information on the central star and other properties of the nebula. It thus allows one to take a comprehensive view of the nebula-star complex.
A disadvantage of modeling is that there are possibly more unknowns than observations and some assumptions must be made, especially concerning the geometry. In our case this is a special problem, since as can be seen in Fig. 1 the nebula cannot be assumed to be spherical, even as a first approach. This will be discussed in Sect. 4.
This paper is structured as follows. First the spectroscopic data are presented in Sect. 2. Section 3 discusses a simple approach to determine the chemical composition of Mz 3 and presents the resultant abundances. In Sect. 4 the model is presented and the assumptions made are discussed; this is followed by the abundance derivation. Sect. 5 compares the model spectrum with the observations. In Sect. 6 a comparison with earlier abundance determinations is made. The evolutionary state of the star-nebula system and the conclusions are given in Sects. 7 and 8.
In the following we present the available infrared and visual spectroscopic data used in our analysis. A compilation of the extinction corrected spectral line fluxes and identifications are given in Table 6.
The ISO SWS observations were made with the SWS01 observing
template. These measurements (TDT27300834) were centered at RA(2000)
16![]() 17
17![]() 13.6
13.6![]() and
Dec(2000) -51$^$59
and
Dec(2000) -51$^$59![]() 06.4
06.4
![]() ,
which is very close to the
center of the nebula. Data reduction was carried out using ISAP (ISO Spectral
Analysis Package) version 2.1. The diaphragm used (shown in
Fig. 1) was 14
,
which is very close to the
center of the nebula. Data reduction was carried out using ISAP (ISO Spectral
Analysis Package) version 2.1. The diaphragm used (shown in
Fig. 1) was 14
![]()
![]() 20
20
![]() below 12
below 12 ![]() m,
m,
![]() between 12
between 12 ![]() m and 29
m and 29 ![]() m and
m and
![]() above this wavelength. The entire nebula fit within the diaphragm in
this last wavelength range, but it is possible that some nebular
radiation was missed below 29
above this wavelength. The entire nebula fit within the diaphragm in
this last wavelength range, but it is possible that some nebular
radiation was missed below 29 ![]() m. This is a difficult problem
because there may be an error of 1
m. This is a difficult problem
because there may be an error of 1
![]() or 2
or 2
![]() in the position
of the diaphragm and there may be a slight jitter during the
observation which could effectively increase the diaphragm size by as
much as 1
in the position
of the diaphragm and there may be a slight jitter during the
observation which could effectively increase the diaphragm size by as
much as 1
![]() .
We shall therefore try to compare the observed
fluxes with measurements taken with other diaphragms. The long wavelength
observations were made with an LWS01 observation (TDT0842133) at
essentially the same position, covering the wavelength
range from 45
.
We shall therefore try to compare the observed
fluxes with measurements taken with other diaphragms. The long wavelength
observations were made with an LWS01 observation (TDT0842133) at
essentially the same position, covering the wavelength
range from 45 ![]() m to 200
m to 200 ![]() m. The diaphragm used had a
diameter of 80
m. The diaphragm used had a
diameter of 80
![]() so the entire nebula was included. The intensity
of the lines
found in the spectrum is shown in Col. 3 of Table 1. The
uncertainty of measurement of the stronger lines is less than 10%,
while that of the
weaker lines could be as large as 30%. The intensities of the LWS
measurements agree reasonably well with those reported by Liu et al. (2001) shown in the last column. Also shown in the last
column are the IRAS measurements (Pottasch et al. 1986).
so the entire nebula was included. The intensity
of the lines
found in the spectrum is shown in Col. 3 of Table 1. The
uncertainty of measurement of the stronger lines is less than 10%,
while that of the
weaker lines could be as large as 30%. The intensities of the LWS
measurements agree reasonably well with those reported by Liu et al. (2001) shown in the last column. Also shown in the last
column are the IRAS measurements (Pottasch et al. 1986).
Table 1: ISO spectrum of Mz 3.
As can be seen from Fig. 1 it is not clear whether or not the entire SWS emission of the lobes is included in the diaphragm. This is somewhat complicated by the fact that the precise position of the center is uncertain by one or two arcsecs and there may be a small jitter which effectively increases the diaphragm size by about the same amount. To study this further we compare the ISO measurements with measurements of Mz 3 which have been made with larger diaphragms. Two such measurements are available: the IRAS measurements and the radio frequency measurements.
The IRAS measurements consist of the survey results which made
measurements with a large bandwidth and the low resolution spectrograph
(LRS) measurements. The survey results are 88.8 Jy in the 12 ![]() m
band (between 8 and 15
m
band (between 8 and 15 ![]() m) and 343 Jy in the 25
m) and 343 Jy in the 25 ![]() m band
(between 18 and 30
m band
(between 18 and 30 ![]() m). These measurements are plotted on a
"quick look'' ISO SWS spectrum in Fig. 2 where it can be seen that the IRAS
measurements are higher. A more detailed analysis gives the same
result: the IRAS results are about 25% to 35% higher than the ISO
results. This also agrees with the jump in the spectrum above
30
m). These measurements are plotted on a
"quick look'' ISO SWS spectrum in Fig. 2 where it can be seen that the IRAS
measurements are higher. A more detailed analysis gives the same
result: the IRAS results are about 25% to 35% higher than the ISO
results. This also agrees with the jump in the spectrum above
30 ![]() m by about this amount which was measured with the larger
aperture including the entire nebula.
m by about this amount which was measured with the larger
aperture including the entire nebula.
The LRS spectrum included the 12.8 ![]() m line of [Ne II]. A
recent unpublished reduction yields an intensity of
m line of [Ne II]. A
recent unpublished reduction yields an intensity of
![]() erg cm-2 s-1 for this line, which is somewhat higher than
an earlier reduction (Pottasch et al. 1986). It is also about 30% higher than the ISO SWS measurement shown in Table 1. The error
on the IRAS measurement is probably also about 30%, so that the only
conclusion which can be made is that it is consistent with 30% of
the flux being missed in the ISO diaphragm.
erg cm-2 s-1 for this line, which is somewhat higher than
an earlier reduction (Pottasch et al. 1986). It is also about 30% higher than the ISO SWS measurement shown in Table 1. The error
on the IRAS measurement is probably also about 30%, so that the only
conclusion which can be made is that it is consistent with 30% of
the flux being missed in the ISO diaphragm.
The radio continuum flux density, which can be measured separately for the
central source and the lobes, can be used to derive the intrinsic H![]() flux from each of these entities (Bains et al. 2004). These are
related as
follows. From the measured 6 cm flux density an intrinsic H
flux from each of these entities (Bains et al. 2004). These are
related as
follows. From the measured 6 cm flux density an intrinsic H![]() flux is derived. By using the theoretical hydrogen line intensity
ratios (Hummer & Storey 1987) for an electron temperature
of 7500 K (see below) the intrinsic values of Brackett
flux is derived. By using the theoretical hydrogen line intensity
ratios (Hummer & Storey 1987) for an electron temperature
of 7500 K (see below) the intrinsic values of Brackett ![]() and
Pfund
and
Pfund ![]() can be found and compared to the ISO measurements of
these lines in Table 1. There is one difficulty however: the radio
emission from the central source is optically deep at 6 cm, and possibly at
2 cm as well. To correct for this we assume
that the intrinsic radio emission from the central source is the same
percentage of the total radio emission as the measured H
can be found and compared to the ISO measurements of
these lines in Table 1. There is one difficulty however: the radio
emission from the central source is optically deep at 6 cm, and possibly at
2 cm as well. To correct for this we assume
that the intrinsic radio emission from the central source is the same
percentage of the total radio emission as the measured H![]() from
the central source is of the total measured H
from
the central source is of the total measured H![]() emission (22%,
see below). This leads to a total intrinsic radio flux density of
770 mJy at 6 cm (600 mJy from the lobes and 170 mJy from the central
source). This would predict a total H
emission (22%,
see below). This leads to a total intrinsic radio flux density of
770 mJy at 6 cm (600 mJy from the lobes and 170 mJy from the central
source). This would predict a total H![]() flux of
flux of
![]() erg cm-2 s-1, a Br
erg cm-2 s-1, a Br ![]() flux of
flux of
![]() erg cm-2 s-1 and a Pf
erg cm-2 s-1 and a Pf ![]() flux
of
flux
of
![]() erg cm-2 s-1. Comparing these expectations to the
measured values in Table 1 it appears that we are missing only 12 to 13% of the expected emission.
erg cm-2 s-1. Comparing these expectations to the
measured values in Table 1 it appears that we are missing only 12 to 13% of the expected emission.
Because of the uncertainties involved in these estimates we use an
average of the two methods and assume that we are missing between 10%
and 30% of the total emission below 30 ![]() m. Above this wavelength
no emission is being missed.
m. Above this wavelength
no emission is being missed.
There are several infrared measurements of the central source. Aitken &
Roche (1982) have measured the spectrum between 8 ![]() m and
13
m and
13 ![]() m with a 5.3
m with a 5.3
![]() diameter diaphragm which
allows only negligible lobe emission. Smith & Gehrz (2005) have
made narrow band filter measurements
using a 4
diameter diaphragm which
allows only negligible lobe emission. Smith & Gehrz (2005) have
made narrow band filter measurements
using a 4
![]() diaphragm. They obtain practically identical
results. For the 12.8
diaphragm. They obtain practically identical
results. For the 12.8 ![]() m line of [Ne II] they find an
intensity of
m line of [Ne II] they find an
intensity of
![]() erg cm-2 s-1. This is about 17%
of the emission found by ISO for the sum of emission from the lobes and the
central source. This agrees with the result of the previous section that
between 10% and 30% of the hydrogen emission comes from the central source. While the
spectrum of the central source and the lobes will not be exactly the same, it
is likely that an assumption that 20% of all measured line intensity
comes from the central source will not be substantially in error.
erg cm-2 s-1. This is about 17%
of the emission found by ISO for the sum of emission from the lobes and the
central source. This agrees with the result of the previous section that
between 10% and 30% of the hydrogen emission comes from the central source. While the
spectrum of the central source and the lobes will not be exactly the same, it
is likely that an assumption that 20% of all measured line intensity
comes from the central source will not be substantially in error.
![\begin{figure}
\par\includegraphics[width=8.8cm,clip]{fig2.eps}
\end{figure}](/articles/aa/full/2005/48/aa3483-05/img24.gif) |
Figure 2: The ISO spectrum with 12 and 25 micron IRAS fluxes overplotted as crosses. |
| Open with DEXTER | |
To obtain the abundances from a given ion, the intensity of a line of that
ionwith respect to a hydrogen line is required. For the ISO lines measured
with the SWS, the intensity from the lobes and the central source are measured
together and it is necessary to correct for the intensity of the central
source. As discussed in Sect.2.3, about 22% of the hydrogen emission comes
from the central source. In Sect.2.1.2 it was found that about 17% of the
[NeII] 12.8 ![]() m emission comes from the central source. Thus to a first
approximation the ratio of the [NeII] emission line to a hydrogen line is the
same is the same in the lobe as in the total emission as given in Table 1.
Whether or not this is true for the other SWS lines is not certain because the
spectrum of the central source and the lobes is not necessarily the same.
However the level of ionization of the other SWS lines is similar and it would
be surprising if large differences occur. Zhang & Liu (2002) have measured
the optical spectra in both regions and do not find a strongly differing
ionization state in the two regions. Even if, for example, the [ArIII] line
were only half as strong in the central source, the assumption that the spectra
are the same would introduce only a 10% error.
m emission comes from the central source. Thus to a first
approximation the ratio of the [NeII] emission line to a hydrogen line is the
same is the same in the lobe as in the total emission as given in Table 1.
Whether or not this is true for the other SWS lines is not certain because the
spectrum of the central source and the lobes is not necessarily the same.
However the level of ionization of the other SWS lines is similar and it would
be surprising if large differences occur. Zhang & Liu (2002) have measured
the optical spectra in both regions and do not find a strongly differing
ionization state in the two regions. Even if, for example, the [ArIII] line
were only half as strong in the central source, the assumption that the spectra
are the same would introduce only a 10% error.
Above 30 ![]() m the diaphragm was large enough
to measure the total emission and here also the radiation coming
from the central source should be subtracted. Thus lobe intensities
above 30
m the diaphragm was large enough
to measure the total emission and here also the radiation coming
from the central source should be subtracted. Thus lobe intensities
above 30 ![]() m are 20% lower than given in Table 1. The intensity ratio is
obtained by dividing this by the value of
the H
m are 20% lower than given in Table 1. The intensity ratio is
obtained by dividing this by the value of
the H![]() emission coming from the lobe, which is
emission coming from the lobe, which is
![]() erg cm-2 s-1; this value is corrected for extinction
since it is derived from the radio flux density. This affects only the N+,
N++ and O++ abundances. But because of the low state of ionization,
the nitrogen and oxygen abundances depend primarily on the N+ and O+
abundances. The N+ abundance obtained from the ISO far infrared line can be
checked using the
erg cm-2 s-1; this value is corrected for extinction
since it is derived from the radio flux density. This affects only the N+,
N++ and O++ abundances. But because of the low state of ionization,
the nitrogen and oxygen abundances depend primarily on the N+ and O+
abundances. The N+ abundance obtained from the ISO far infrared line can be
checked using the ![]() 6584 Åin the visual; these two lines yield
the same result, as shown in Table 4. The oxygen abundance is dependent on the
visual line at
6584 Åin the visual; these two lines yield
the same result, as shown in Table 4. The oxygen abundance is dependent on the
visual line at ![]() 3727 Å.
3727 Å.
Very early in the analysis we tried to make a model of the core in order to predict more precisely the spectrum of the central source. This was unsucessful, probably because the nature of the core is not well enough known.
The optical spectrum of Mz 3 has been measured on two occasions in the past
five years. Both Zhang & Liu (2002) and Smith (2003) have measured
the spectrum in similar ways. Both use a long slit about 2'' wide. The slit is
oriented north-south in both cases and goes through the central nebula. Both
are able to obtain a spectrum of the central nebula and the lobes on the north
and the south side. They find that the spectra are the same in the north as
in the south, The spectral resolutions used are quite similar and vary
somewhat with the spectral region. The spectrum of Smith extends further to
the red so that some of the Paschen lines are measured. Both spectra appear to
come from the same regions of the lobes but they differ somewhat from each
other. The measured intensities of both authors are similar on the red side of
H![]() .
They differ by approximately a factor of 2 on the blue side. They
therefore give different reddening corrections, using the same method of
trying to reproduce the expected theoretical hydrogen line intensities using
the theory of Hummer & Storey (1987). After reddening correction the
intensities relative to H
.
They differ by approximately a factor of 2 on the blue side. They
therefore give different reddening corrections, using the same method of
trying to reproduce the expected theoretical hydrogen line intensities using
the theory of Hummer & Storey (1987). After reddening correction the
intensities relative to H![]() agree better with one another. The H
agree better with one another. The H![]() intensity of Smith is rather high but his Paschen line intensities agree well
with theoretical predictions (except for Pa8 which is near the edge of his
spectrum). The critical OII lines at
intensity of Smith is rather high but his Paschen line intensities agree well
with theoretical predictions (except for Pa8 which is near the edge of his
spectrum). The critical OII lines at ![]() 3727 Å now agree to within 25%. We shall use the average value of the two authors after they have
corrected for reddening. The [SIII] line at
3727 Å now agree to within 25%. We shall use the average value of the two authors after they have
corrected for reddening. The [SIII] line at ![]() 9531 Å was taken
only from Smith. The averaged fluxes are listed in Table 6.
9531 Å was taken
only from Smith. The averaged fluxes are listed in Table 6.
There are several methods for estimating the extinction towards planetary
nebulae. We have already mentioned the
comparison of observed and theoretical Balmer decrement and the
uncertainties which can result. Perhaps the most reliable method is a
comparison of radio emission with ![]() flux. As discussed in
Sect. 2.1.1 the
flux. As discussed in
Sect. 2.1.1 the
![]() flux found from the radio measurement of the
lobes is -9.55. The measured
flux found from the radio measurement of the
lobes is -9.55. The measured
![]() flux from the entire
nebula is -11.09 (Webster 1969) while the
flux from the entire
nebula is -11.09 (Webster 1969) while the
![]() flux from the central source is -11.75. Thus
flux from the central source is -11.75. Thus
![]() originates from the lobes. Comparing this with the predicted H
originates from the lobes. Comparing this with the predicted H![]() we obtain c = 1.65 or
EB-V = 1.13. This is in rough
agreement with the much more uncertain values obtained from the Balmer
(and Paschen) decrement: Smith (2003) finds c = 1.5 and Zhang
& Liu (2002) give c = 2.0 for the lobes and a somewhat higher
value for the central region.
This value, c = 1.65 has been adopted in the remainder of this paper,
together with the extinction curves of Seaton (1979) and Fluks
et al. (1994). It is actually not needed for the visual
spectrum as discussed above, nor is it needed for the determination of
the H
we obtain c = 1.65 or
EB-V = 1.13. This is in rough
agreement with the much more uncertain values obtained from the Balmer
(and Paschen) decrement: Smith (2003) finds c = 1.5 and Zhang
& Liu (2002) give c = 2.0 for the lobes and a somewhat higher
value for the central region.
This value, c = 1.65 has been adopted in the remainder of this paper,
together with the extinction curves of Seaton (1979) and Fluks
et al. (1994). It is actually not needed for the visual
spectrum as discussed above, nor is it needed for the determination of
the H![]() flux which is found from the radio measurements. It is an
unusually high extinction so that even the far infrared fluxes are
slightly affected. We have corrected these values (the corrected
values are given in Table 6) but the correction is small, usually
less than 10%.
flux which is found from the radio measurements. It is an
unusually high extinction so that even the far infrared fluxes are
slightly affected. We have corrected these values (the corrected
values are given in Table 6) but the correction is small, usually
less than 10%.
The method of analysis is the same as used in the papers cited in the introduction. First the electron density and the temperature as function of the ionization potential are determined. Then the ionic abundances are determined, using the density and the temperature appropriate for the ion under consideration, together with Eq. (1). Then the element abundances are found for those elements for which a sufficient number of ionic abundances have been derived.
The ions used to determine
![]() are listed in the first
column of Table 2. The ionization potential required to reach that
ionization stage, and the wavelengths of the lines used, are given in
Cols. 2 and 3 of the table. Note that the wavelength units are Å when 4 ciphers are given and microns when 3 ciphers are shown. The
observed ratio of the lines is given in the fourth column; the
corresponding
are listed in the first
column of Table 2. The ionization potential required to reach that
ionization stage, and the wavelengths of the lines used, are given in
Cols. 2 and 3 of the table. Note that the wavelength units are Å when 4 ciphers are given and microns when 3 ciphers are shown. The
observed ratio of the lines is given in the fourth column; the
corresponding
![]() is given in the fifth column. The
temperature used is discussed in the following section, but is
unimportant since these line ratios are essentially determined by the
density. The atomic parameters used are the same as in the earlier
papers cited above. The only exception to this is the case of
[O II] for which the values recently recommended by Wang et al. (2004) have been used.
is given in the fifth column. The
temperature used is discussed in the following section, but is
unimportant since these line ratios are essentially determined by the
density. The atomic parameters used are the same as in the earlier
papers cited above. The only exception to this is the case of
[O II] for which the values recently recommended by Wang et al. (2004) have been used.
The electron density appears to be about 4000 cm-3. There is no indication that the electron density varies with ionization potential in a systematic way, although a limited number of values are determined.
Table 2: Electron density indicators in Mz 3.
A number of ions have lines originating from energy levels far enough
apart that their ratio is sensitive to the electron temperature. These
are listed in Table 3, which is arranged similarly to the
previous table. The electron temperature is found to increase as a
function of ionization potential. There is some scatter. A
value of
![]() cm-3 has been used in the
computations, but the temperature is in general not sensitive to the
electron density.
cm-3 has been used in the
computations, but the temperature is in general not sensitive to the
electron density.
Table 3: Electron temperature indicators in Mz 3.
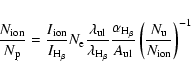
The ionic abundances have been determined using the following equation:
The results are given in Table 4, where the first column lists the
ion concerned, and the second column the line used for the abundance
determination. The third column gives the intensity of the line used
relative to H![]() .
The fourth column gives the electron
temperature used, which is a function of the ionization potential and
is found or interpolated from Table 3. The ionic abundances,
are in the fifth column, while the sixth column gives the Ionization
Correction Factor (ICF).This has been determined empirically. Notice
that the ICF is unity for carbon, nitrogen, oxygen, neon and argon
because all important stages of ionization have been observed. The ICFs
for the other elements have been determined by comparing the observed
ionization stages as a function of ionization potential with those
elements where all important ionization stages are present. Only one
stage of ionization has been observed in silicon and
chlorine for which only a model approach can give a trustworthy
result. No helium abundance has been given because no reliable
correction for neutral helium can be made without a model. The carbon
abundance is an upper limit because it is probable that the C+line at
.
The fourth column gives the electron
temperature used, which is a function of the ionization potential and
is found or interpolated from Table 3. The ionic abundances,
are in the fifth column, while the sixth column gives the Ionization
Correction Factor (ICF).This has been determined empirically. Notice
that the ICF is unity for carbon, nitrogen, oxygen, neon and argon
because all important stages of ionization have been observed. The ICFs
for the other elements have been determined by comparing the observed
ionization stages as a function of ionization potential with those
elements where all important ionization stages are present. Only one
stage of ionization has been observed in silicon and
chlorine for which only a model approach can give a trustworthy
result. No helium abundance has been given because no reliable
correction for neutral helium can be made without a model. The carbon
abundance is an upper limit because it is probable that the C+line at ![]() 157.6
157.6 ![]() m originates in the surrounding interstellar medium,
at least partially. No background spectrum is available because of the
presence of HII emission regions in the neighborhood (see the
discussion of Liu et al. 2001). The C++ abundance is derived from the
recombination line
m originates in the surrounding interstellar medium,
at least partially. No background spectrum is available because of the
presence of HII emission regions in the neighborhood (see the
discussion of Liu et al. 2001). The C++ abundance is derived from the
recombination line ![]() 4267 Å; while this give a reasonable
ratio for the two carbon ions, it sometimes overestimates the C++ abundance.
4267 Å; while this give a reasonable
ratio for the two carbon ions, it sometimes overestimates the C++ abundance.
Table 4:
Ionic concentrations and chemical abundances in Mz 3.
Wavelength in Angstrom for all values of ![]() above 1000, otherwise
in
above 1000, otherwise
in ![]() m.
m.
The ionized helium abundance has been derived using the theoretical work of
Benjamin et al. (1999). For recombination of singly ionized
helium, most weight is given to the ![]() 5875 Å line, because
the theoretical determination of this line is the most reliable.
5875 Å line, because
the theoretical determination of this line is the most reliable.
The final abundances are shown in the second column of Table 7. Of the eight elements for which an abundance is given, six can be determined using only ISO measurements. These are nitrogen, neon, sulfur, argon, iron and silicon. These abundances are essentially independent of electron temperature and not very dependent on electron density for the density range expected. The abundances in Mz 3 differ in general from solar abundances. The oxygen abundance is about half solar, while nitrogen is about a factor of five higher. Neon, argon, silicon, sulfur and chlorine are within a factor of two of solar. Iron is about a factor of four lower than solar but it is an order of magnitude higher than in other planetary nebulae.We shall discuss these abundances in more detail presently.
Modeling the nebula-star complex will allow characterizing not only the central star's temperature but other stellar parameters as well (i.e., log gand luminosity). It can determine distance and other nebular properties, especially the composition, including the composition of elements which are represented by a single stage of ionization, which cannot be determined by the simplified analysis above. This method can take into account the presence of dust and molecules in the nebular material and thus is very comprehensive in approach. While the line ratio method is simple and fast, the ICFs rest on uncertain physics. To this end, modeling serves as an effective means and the whole set of parameters are determined in an unified way, assuring self consistency. Finally, this way one gets a good physical insight about the PN, the method and the observations.
It is with this in mind that we have constructed a photoionization model for Mz 3 with the code Cloudy, using the latest version C96.01 (Ferland et al. 1998).
From the available literature on Mz 3, we find that this PN is quite complex
in many respects. Apart from the aforementioned factors like geometry and
density fluctuations, the nebula is also known to emit X-rays (Kastner et al.
2003). The X-ray luminosity is very small and so we neglect
it in the overall energetics. The central star
is thought to be a binary. Also high resolution spectroscopy
(Redman et al. 2000; Guerrero et al. 2004; and Santander-
Garcia et al. 2004), reveal that the gas is flowing along the polar
axis at high velocities of 300-500 km s-1. We have to look at the finer
aspects of this: the line photons from one lobe emitted towards the other lobe
would get doppler shifted and would not be absorbed by the other lobe, whereas
the continuum photons could be absorbed. Here we are modeling a
single static lobe in steady state and neglect the interaction with any
radiation from the other lobe. In early simulations, we tried to
incorporate dual central source (two stars, one hot and one cool), but
later on tried only a single star represented by model atmospheres (Atlas)
from Kurucz (1991). It was found that the addition of a cool star did
not make any significant difference.
We have considered only the gas phase abundances of the
various elements seen in the spectra (Table 6), though it is known that
dust grains are present (Smith & Gehrz 2005). For a bipolar
nebula, Mz 3 does not show any significant molecular emission. The angular
extent of the lobe to be modelled
was calculated as 16 arcsec from the distribution of emission along the
slit as shown in Fig. 6 of Smith (2003).
Almost all the lobe emission (in lines) is within this extent.
When comparing the model spectra with observed spectra, we had practical
difficulties.
The two recently published CCD spectra by Zhang & Liu (2002) and by
Smith (2003), differ in observed fluxes of various lines as mentioned
earlier in Sect. 2.2. We have used an average value, although we could have
given both values to indicate the range observed. The ISO spectrum was
observed over the entire nebula (see Fig. 1), and we assumed that the ratio
of line intensity to H![]() intensity is the same in both lobes.
The H
intensity is the same in both lobes.
The H![]() flux (see earlier) appropriate for the entire nebula was
derived as
flux (see earlier) appropriate for the entire nebula was
derived as
![]() .
We note that the
northern lobe emits slightly more radiaton and assumed that this is around 60% of the total(
.
We note that the
northern lobe emits slightly more radiaton and assumed that this is around 60% of the total(
![]() ). This 60:40
ratio is approximately the ratio of the radio emission of these lobes.
). This 60:40
ratio is approximately the ratio of the radio emission of these lobes.
Table 5: Parameters representing the best-fit model.
Table 6:
The emission line fluxes (
![]() ).
).
Table 5 gives the input parameters of the best matched model, and the corresponding output spectral fluxes are compared to the observed ones in Table 6.
The electron density and temperature as computed by our model
is plotted in Fig. 3 against nebular depth, i.e., the radial
distance calculated from the inner surface of the lobe.
The mean density of ![]()
![]() is reasonable compared to the
values in Table 2 which were derived from individual line
ratios. We have used a filling factor to take care of the
density fluctuations and the available HST image
(www.spacetelescope. org/images/html/heic0101a.html)
indicates quite complex variations. The agreement with
the determinations of Zhang & Liu (2002) and Smith (2003)
is very good. The mean electron temperature from our model of
is reasonable compared to the
values in Table 2 which were derived from individual line
ratios. We have used a filling factor to take care of the
density fluctuations and the available HST image
(www.spacetelescope. org/images/html/heic0101a.html)
indicates quite complex variations. The agreement with
the determinations of Zhang & Liu (2002) and Smith (2003)
is very good. The mean electron temperature from our model of
![]()
![]() is higher by about 1000 K as compared to the determinations
of both these authors. This has to do with the uncertainty
in the energy distribution of the ionizing source (see Sects. 5.2 and 5.3 below).
is higher by about 1000 K as compared to the determinations
of both these authors. This has to do with the uncertainty
in the energy distribution of the ionizing source (see Sects. 5.2 and 5.3 below).
![\begin{figure}
\par\includegraphics[width=8.4cm,clip]{fig3.ps}
\end{figure}](/articles/aa/full/2005/48/aa3483-05/img54.gif) |
Figure 3:
|
| Open with DEXTER | |
As mentioned earlier we have attempted to obtain a good match for about 50 observed lines and these are shown in Table 6. Cloudy computes by default the fluxes of continuum at various wavelengths and a very large of number emission lines (nearly 2000) in its output spectrum. The overall match seems to be all right except for some peculiarities. The diagnostic lines of O II, N II, S II and Cl III came out clean in the matching game. The helium lines also did well. If you consider S III, you find that it is represented by many lines over a range of wavelengths, and the model produces correct flux in the optical and far-red regions while IR lines are deviant. The reason could be either the integration of the optical with ISO spectra is not seamless or the fine structure lines are affected in a way we do not understand. The optical spectrum was observed with a long slit while the ISO observations were through apertures of varying sizes (see Fig. 1). As discussed earlier, this factor and the extent of contribution of the central region (core) to the lobe spectrum were taken care of, for the IR lines. O III lines also behave in a peculiar way. Fe III lines did fine while Fe II lines failed. One problem that we guess is that the density inhomogeneity is so great that the mechanism of filling factor could not handle it. There could also be a problem with the inputted model atmosphere fluxes for the central source, since we have no way of constraining them with observations (see next subsection). For carbon, increasing the model abundance increases the flux in C II lines but upsets the good match achieved in many other lines, more so in N II and O II. This is why the carbon abundance determined by the line ratio method (Table 4) must be too high. The model abundance of carbon given in Tables 5 and 7 should only be considered as an upper limit. Basically we sought an underlying simplicity behind the apparent complexity and we feel that our open geometric model for the polar wing of Mz 3 is a moderate success, when viewed in the backdrop of all the uncertainties and unknowns.
The central star of Mz 3 is not resolved. At the center of the PN there is a
sub-arcsecond high density (
![]() )
nebular core
(see Zhang & Liu 2002) which is not modelled here.
This region also hosts a dust torus. The ionizing source whose characteristics
we have derived from our model of the lobe does not describe the central star
since the energetics involved in ionizing the high density core is not known.
What is given in Table 5 for the ionizing source pertains to the energy
coming out at the exit point of this core. The difficulty we mentioned in
the previous subsection about the use of model atmosphere flux refers to
this aspect. A more realistic representation would involve
the modification of the model atmosphere flux distribution over select
wavelength regions as part of the modeling methodology or including core
modeling too, but we have not done either. Figure 4 shows the incident and
the transmitted energy in the model. The absorption below 912 Å is more
or less complete except between 500 Å and 650 Å. Therefore, we predict that
the central star ought to be hotter than the
)
nebular core
(see Zhang & Liu 2002) which is not modelled here.
This region also hosts a dust torus. The ionizing source whose characteristics
we have derived from our model of the lobe does not describe the central star
since the energetics involved in ionizing the high density core is not known.
What is given in Table 5 for the ionizing source pertains to the energy
coming out at the exit point of this core. The difficulty we mentioned in
the previous subsection about the use of model atmosphere flux refers to
this aspect. A more realistic representation would involve
the modification of the model atmosphere flux distribution over select
wavelength regions as part of the modeling methodology or including core
modeling too, but we have not done either. Figure 4 shows the incident and
the transmitted energy in the model. The absorption below 912 Å is more
or less complete except between 500 Å and 650 Å. Therefore, we predict that
the central star ought to be hotter than the
![]() listed in Table 5 or
more luminous than what we computed or both, since the core region would
consume some energy in getting ionized, apart from energy consumption by
dust grains as well.
listed in Table 5 or
more luminous than what we computed or both, since the core region would
consume some energy in getting ionized, apart from energy consumption by
dust grains as well.
![\begin{figure}
\par\includegraphics[width=8.5cm,clip]{fig4.ps}
\end{figure}](/articles/aa/full/2005/48/aa3483-05/img56.gif) |
Figure 4: Stellar ionizing radiation - Incident (continuous line) and transmitted (broken line). |
| Open with DEXTER | |
Two earlier abundance determinations are also listed in Table 7. Those of Zhang & Liu (2002) are based only on the visual spectrum so that no carbon abundance can be determined. Only one nitrogen line was observed (NII). Smith (2003) include part of the near infrared spectrum but the emphasis is on the visual lines in deriving the abundances.
We are capable of obtaining more accurate electron temperatures thanks to the inclusion of the far infrared observations. Eight temperature determinations are given in Table 4 over a wide range of ionization potentials, while earlier abundance analyzes had only two temperature determinations. Our carbon abundance may only be an upper limit however.
The helium abundance can only be found by correcting for the presence of neutral helium in the nebula. We have done this by making use of a model and we obtain the same result as Smith (2003). This is a very high helium abundance, comparable to that seen in the bipolar planetary nebulae NGC 6302 (Pottasch et al. 1999) and NGC 6537, and the rather amorphous PN He2-111 (Pottasch et al. 2000). Just as Mz 3 all these nebulae are located close to the galactic plane and have high extinction. Furthermore they all have abundances very similar to Mz 3. As example, the abundances in NGC 6537 are shown in the sixth column of Table 7. In all these nebula the helium must have been produced in the course of the evolution of the central stars of these objects. The large amount of nitrogen found in Mz 3 is the same as found in these other nebulae. All have nitrogen to oxygen ratios of about unity and an oxygen abundance of about one half solar. A consequence of this is that the rather high nitrogen and helium abundance was probably produced by hot bottom burning. For this to occur the initial stellar mass should be at least 4 solar masses. Since the three nebulae cited all have carbon to oxygen ratios between 0.5 and 1 strengthens our feeling that the carbon abundance given in Table 7 for Mz 3 is only an upper limit.
The results are given in Tables 4 and 5 and summarized in Table 7. A comparison with earlier work is also given in the last table. The abundances found are also very similar to those found in other bilobal planetary nebulae showing high helium and nitrogen abundances.
The difficulty in deriving the details of the central star's ionizing energy
distribution has been discussed. Lower limits to the
![]() and luminosity
are obtained.
Taken together, the nebular abundances and the probable stellar parameters
suggest that Mz 3 is probably descended from a star of at least 4 solar masses.
and luminosity
are obtained.
Taken together, the nebular abundances and the probable stellar parameters
suggest that Mz 3 is probably descended from a star of at least 4 solar masses.
Acknowledgements
We would like to acknowledge the use of SIMBAD and ADS for this work. RS thanks Baba Antony Varghese for help with the graphics and data recovery after a system crash; J.S. Nathan helped by lending a "linux box'' in time.