A&A 444, L41-L44 (2005)
DOI: 10.1051/0004-6361:200500208
Anomalous X-ray line ratios in the cTTS TW Hydrae
J.-U. Ness1 - J. H. M. M. Schmitt2
1 - Department of Physics, Rudolf Peierls Centre for Theoretical Physics,
University of Oxford, 1 Keble Road, Oxford OX1 3NP, UK
2 -
Hamburger Sternwarte, Universität Hamburg, Gojenbergsweg 112,
21029 Hamburg, Germany
Received 31 August 2005 / Accepted 26 October 2005
Abstract
The cTTS TW Hya has been observed with high-resolution X-ray
spectrometers. Previously found high densities inferred from He-like f/i
triplets strongly suggested the detected X-ray emission to be dominated by an accretion
shock. Because of their radiation field dependence He-like f/i ratios do not provide
unambiguous density diagnostics. Here we present additional evidence for high densities
from ratios of Fe XVII lines. Key Fe XVII line ratios in TW Hya
deviate from theoretical expectations at low densities as well as from the
same measurements in a large sample of stellar coronae. However, a quantitative
assessment of
densities is difficult because of atomic physics uncertainties. In addition, estimates
of low optical depth in line ratios sensitive to resonance scattering effects also
support a high-density emission scenario in the X-ray emitting regions of cTTS.
Key words: X-rays: stars - stars: individual: TW Hya - stars: pre-main sequence -
stars: coronae - stars: activity - accretion
T Tauri stars are young pre-main sequence (PMS) late-type stars. "Classical'' T Tauri
stars (cTTS) are thought to still be surrounded by accretion disks as evidenced by
IR and UV excess, while no signs for the presence of a disk are found in the so-called
"weak line'' T Tauri stars (for details we refer to Feigelson & Montmerle 1999).
X-ray emission from PMS stars is expected to be high because of their fast
rotation if the emission is interpreted as scaled-up solar-type activity. However, for
cTTS an additional source of X-ray emission through accretion is available; this
additional X-ray production mechanism is expected to lead to significant differences
in X-ray emission levels and variability, but in particular to differences in the
spectral properties of the X-ray emission.
High-resolution X-ray observations with the
transmission and reflection gratings aboard Chandra and XMM-Newton have
now been obtained for about two dozens of stars, but only for very few cTTS. The best
data are usually obtained for the O VII triplet located at 21.6 Å ("r-line''),
21.8 Å ("i-line''), and 22.1 Å ("f-line''). The f/i-line ratio is
density-sensitive (Gabriel & Jordan 1969), but in all cases no ratios below unity are encountered
for coronal sources (Ness et al. 2004). In contrast, the available high-resolution
spectra of cTTS show unusually low He-like f/i ratios in TW Hya
(Kastner et al. 2002; Stelzer & Schmitt 2004) and BP Tau (Schmitt et al. 2005). The first obvious
conclusion was that the plasma in cTTS is at extremely high densities
suggesting its origin in an accretion shock rather than a "normal'' magnetically active
corona (Kastner et al. 2002). However, f/i ratios could only be measured for O VII
and Ne IX, and the f/i ratios of those ions also depend on UV radiation
fields if they are strong enough and located close to the origin of the X-ray emission.
Since the presumed accretion shock region is also expected to produce
intense UV emission, the observed low f/i-ratios would then not contradict the
accretion hypothesis, but need not necessarily imply high densities.
The Chandra HETGS spectrum of TW Hya has already been analyzed by
Kastner et al. (2002) with a variable abundance differential emission measure
analysis and the identification and discussion of the anomalously low
f/i-ratios in O VII and Ne IX. We address an alternative approach to
density determination using Fe XVII lines at 17.05 Å and 17.10 Å.
Mauche et al. (2001) were the first to use this ratio as density tracer
in their study of the Chandra HETGS spectrum of the intermediate
polar EX Hya, demonstrating that this ratio is considerably less sensitive to
photoexcitation than He-like ions. Further, we investigate the effects of resonant
line scattering which also depends sensitively on plasma density.
The atomic physics of Fe XVII, especially the
 (15 Å range) and
 (17 Å range) transitions, is quite
complicated and extensive efforts have been spent with the conclusion that
a number
of indirect processes have to be considered apart from the standard collisional
excitation (CE) theory. The inclusion of resonance excitation and inner-shell
excitation from Fe XVI as well as radiative and dielectronic recombination
from Fe XVIII improved the situation enormously, but residual discrepancies
remain (for more
details see Gu 2003). In view of these difficulties we focus our analyses on the
comparison of TW Hya with a sample of stellar coronae, but refrain from any
quantitative determination of densities. Comparison with theoretical calculations
is based on atomic data using APEC (Smith et al. 2001)
(17 Å range) transitions, is quite
complicated and extensive efforts have been spent with the conclusion that
a number
of indirect processes have to be considered apart from the standard collisional
excitation (CE) theory. The inclusion of resonance excitation and inner-shell
excitation from Fe XVI as well as radiative and dielectronic recombination
from Fe XVIII improved the situation enormously, but residual discrepancies
remain (for more
details see Gu 2003). In view of these difficulties we focus our analyses on the
comparison of TW Hya with a sample of stellar coronae, but refrain from any
quantitative determination of densities. Comparison with theoretical calculations
is based on atomic data using APEC (Smith et al. 2001)![[*]](/icons/foot_motif.gif) and the most recent calculations by Gu (2003).
and the most recent calculations by Gu (2003).
![\begin{figure}
\par\includegraphics[width=18cm,clip]{Hh311_f1}
\end{figure}](/articles/aa/full/2005/47/aahh311/Timg9.gif) |
Figure 1:
HETGS spectrum and a parameterized best-fit model of TW Hya
(summed plus- and minus orders); line letter designations
refer to the line parameters given in Table 1.
|
| Open with DEXTER |
Chandra observations of TW Hya (K7 Ve, d=57 pc) were carried out
with the High Energy Transmission Grating Spectrometer (HETGS; ObsID 5, 48 ks,
June 2000); details are given by Kastner et al. (2002).
We extracted count spectra using the Chandra Interactive Analysis of Observations (CIAO)
software, but used our own tool CORA (Ness & Wichmann 2002) to determine line counts by
fitting line templates and converted them to line fluxes using effective areas extracted
with CIAO (using the tool fullgarf). After examining the spectra of the plus and
minus sides we use the sum (representing the effective area-weighted average) for our
analysis, which can be done if no anomalies occur on either side (which is not the
case to our knowledge). Any correction of line fluxes for absorption is based
on a value of
 cm-2, derived from a
broad-band spectrum of TW Hya by Robrade et al. (2005).
For comparison we extrated the HETGS spectra of various stellar
coronae in exactly the same way to assess
spectral differences between TW Hya and purely coronal sources.
cm-2, derived from a
broad-band spectrum of TW Hya by Robrade et al. (2005).
For comparison we extrated the HETGS spectra of various stellar
coronae in exactly the same way to assess
spectral differences between TW Hya and purely coronal sources.
For our analyses we measured fluxes for two sets of lines, five lines of Fe XVII
and the Ly and Ly
 lines of
H-like oxygen and neon. Figure 1 shows the HETGS spectrum between 15-17.2 Å illustrating the reliability of our line detections and flux measurements.
The best fit above a source continuum of 20 cts/Å is also shown
(FWHM 0.016 Å for all lines), and the derived counts and fluxes are listed in
Table 1 together with the effective area values used for conversion of
line counts to fluxes and the transmission efficiencies for
cm-2 calculated from Balucinska-Church & McCammon (1992); we assume standard cosmic
abundances from Anders & Grevesse (1989). The Fe XVII line fluxes are corrected
for absorption, but we did not correct
the Ly
and Ly
lines which will be investigated in detail below.
In Table 1 we also list an Fe XVIII line at 16.07 Å (2p43s 2P5/2 to ground state) which we use to correct the O VIII
Ly
line at 16.00 Å to account for contamination by Fe XVIII at
16.004 Å (2p43s 2P3/2 to ground). The ratio of these two
Fe XVIII lines varies slowly with temperature from 0.73 to 1.06 for
lines of
H-like oxygen and neon. Figure 1 shows the HETGS spectrum between 15-17.2 Å illustrating the reliability of our line detections and flux measurements.
The best fit above a source continuum of 20 cts/Å is also shown
(FWHM 0.016 Å for all lines), and the derived counts and fluxes are listed in
Table 1 together with the effective area values used for conversion of
line counts to fluxes and the transmission efficiencies for
cm-2 calculated from Balucinska-Church & McCammon (1992); we assume standard cosmic
abundances from Anders & Grevesse (1989). The Fe XVII line fluxes are corrected
for absorption, but we did not correct
the Ly
and Ly
lines which will be investigated in detail below.
In Table 1 we also list an Fe XVIII line at 16.07 Å (2p43s 2P5/2 to ground state) which we use to correct the O VIII
Ly
line at 16.00 Å to account for contamination by Fe XVIII at
16.004 Å (2p43s 2P3/2 to ground). The ratio of these two
Fe XVIII lines varies slowly with temperature from 0.73 to 1.06 for
 (as predicted by APEC). Given the low temperature of
TW Hya, the measured flux in O VIII Ly
was reduced by
75% of the flux in the 16.07-Å line. We corrected
the stellar O VIII Ly
line fluxes by interpolating the
slow temperature dependence using temperature estimates from the ratio of lines of
O VIII at 18.97 Å and O VII at 21.6 Å. The line fluxes in
Table 1 are used to calculate the line flux ratios given in
Table 2. For the Fe XVII line ratios the
(as predicted by APEC). Given the low temperature of
TW Hya, the measured flux in O VIII Ly
was reduced by
75% of the flux in the 16.07-Å line. We corrected
the stellar O VIII Ly
line fluxes by interpolating the
slow temperature dependence using temperature estimates from the ratio of lines of
O VIII at 18.97 Å and O VII at 21.6 Å. The line fluxes in
Table 1 are used to calculate the line flux ratios given in
Table 2. For the Fe XVII line ratios the  -corrected
fluxes were used while the Ly/Ly
ratios are (not yet) corrected;
the O VIII ratio is corrected for contamination with Fe XVII, but
blending in the Ne X Ly line is ignored.
-corrected
fluxes were used while the Ly/Ly
ratios are (not yet) corrected;
the O VIII ratio is corrected for contamination with Fe XVII, but
blending in the Ne X Ly line is ignored.
Table 1:
Line flux measurements for TW Hya.
Table 2:
Line flux ratios in TW Hya (notation as in Fig. 1).
We compare the line ratios of TW Hya with a large sample of analogous measurements of
stellar coronae in a variety of classes. We first focus on the ratio
 as a function of density in Fig. 2; TW Hya is
indicated by the light shaded area denoting the
as a function of density in Fig. 2; TW Hya is
indicated by the light shaded area denoting the  uncertainty range from
measurement errors. Stellar coronal densities are calculated from Ne IX f/i ratios given for 18 stars by Ness et al. (2004),
cleared of all the Fe XIX blending. A clear discrepancy between all stellar
measurements and TW Hya can be recognized. Theoretical predictions from APEC and
Gu (priv. comm.; not yet including indirect processes), all in the temperature range
uncertainty range from
measurement errors. Stellar coronal densities are calculated from Ne IX f/i ratios given for 18 stars by Ness et al. (2004),
cleared of all the Fe XIX blending. A clear discrepancy between all stellar
measurements and TW Hya can be recognized. Theoretical predictions from APEC and
Gu (priv. comm.; not yet including indirect processes), all in the temperature range
 ,
are shown for two
temperatures bracketing those temperatures where the bulk of the Fe XVII line
formation is expected to occur. While with APEC a quantitative determination of a
high density
,
are shown for two
temperatures bracketing those temperatures where the bulk of the Fe XVII line
formation is expected to occur. While with APEC a quantitative determination of a
high density 
 cm-3 is possible, the measurement of
TW Hya does not deviate from the low-density limit as predicted by Gu.
The stellar measurements appear more consistent with the APEC-prediction, however,
since all coronal sources are thought to be far hotter than
cm-3 is possible, the measurement of
TW Hya does not deviate from the low-density limit as predicted by Gu.
The stellar measurements appear more consistent with the APEC-prediction, however,
since all coronal sources are thought to be far hotter than
 ,
also APEC underpredicts the measured 17.10/17.05-ratios. In contrast, the calculations
by Gu (2003), including indirect processes (but providing only the low-density limit
at different temperatures), agree very well with the stellar measurements and an
expansion of these calculations including all indirect processes as a function of density
is likely to provide better estimates
for TW Hya. Obviously, the observed Fe XVII 17.10/17.05-ratio in
TW Hya is smaller than that typically measured in coronal sources and it is
larger than in EX Hya (cf. Mauche et al. 2001),
suggesting a plasma density in TW Hya larger than typically encountered in coronal
sources, but smaller than
,
also APEC underpredicts the measured 17.10/17.05-ratios. In contrast, the calculations
by Gu (2003), including indirect processes (but providing only the low-density limit
at different temperatures), agree very well with the stellar measurements and an
expansion of these calculations including all indirect processes as a function of density
is likely to provide better estimates
for TW Hya. Obviously, the observed Fe XVII 17.10/17.05-ratio in
TW Hya is smaller than that typically measured in coronal sources and it is
larger than in EX Hya (cf. Mauche et al. 2001),
suggesting a plasma density in TW Hya larger than typically encountered in coronal
sources, but smaller than
 cm-3 as inferred for EX Hya.
We also compare more ratios in Table 2 with our
stellar sample. In particular we found TW Hya to be different in the ratios
cm-3 as inferred for EX Hya.
We also compare more ratios in Table 2 with our
stellar sample. In particular we found TW Hya to be different in the ratios
 (3G/3F) and
 (3D/3C), while in the other ratios no differences between
TW Hya and the stellar sample are found. This suggests that the 17.05-Å and the
15.26-Å lines are anomalously enhanced in TW Hya while those at
15.01 Å, 16.78 Å, and 17.10 Å show no peculiarities.
(3D/3C), while in the other ratios no differences between
TW Hya and the stellar sample are found. This suggests that the 17.05-Å and the
15.26-Å lines are anomalously enhanced in TW Hya while those at
15.01 Å, 16.78 Å, and 17.10 Å show no peculiarities.
![\begin{figure}
\par\includegraphics[width=8.8cm,clip]{Hh311_f2}
\end{figure}](/articles/aa/full/2005/47/aahh311/Timg57.gif) |
Figure 2:
Density dependence of the Fe XVII line ratio
predicted by APEC and M.F. Gu compared with
18 coronal measurements and TW Hya; plasma densities are derived from
Ne IX f/i ratios. |
| Open with DEXTER |
A comparative analysis of the line ratios
and (3D/3C)
 (3D/3F) has been carried out by Ness et al. (2003) to
investigate opacity effects. For both ratios TW Hya shows significantly larger
ratios possibly indicating resonant line scattering effects. However, laboratory
experiments suggest blending of the 15.26-Å line with an Fe XVI satellite
line (e.g., Brown et al. 2001), possibly explaining a trend of increasing
-ratios with decreasing temperature (Ness et al. 2003).
Since TW Hya does have
relatively low X-ray temperature (Kastner et al. 2002; Stelzer & Schmitt 2004), the same reason can account
for the anomalously high flux in the 15.26-Å line. In view of this ambiguity
we also studied the H-like Ly/Ly
line ratios of O VIII
and Ne X. In Fig. 3 we show a sample of stellar ratios of O VIII
with the blending correction applied as described above, compared with the measurement
of TW Hya and atomic data predictions;
the same line ratio has been used by Testa et al. (2004) finding II Peg and IM Peg to
be anomalous. The TW Hya measurement is marked
with the hashed box bracketing the formal
uncertainties in the line ratio
and in temperature. Theoretical predictions
from APEC and Chianti agree quite well with each other
and uncertainties in
do not lead to different conclusions.
However, we note in this context that the above blending correction is
not straightforward, since it is predicted rather differently
by Chianti and APEC (which we used for the correction).
In view of the stellar measurements and the fact that the error bars do not include
uncertainties from the blending correction,
this deviation from theory appears rather marginal. We carried out the same procedure
for the Ne X lines and found no deviation from the stellar measurements
(Table 2).
(3D/3F) has been carried out by Ness et al. (2003) to
investigate opacity effects. For both ratios TW Hya shows significantly larger
ratios possibly indicating resonant line scattering effects. However, laboratory
experiments suggest blending of the 15.26-Å line with an Fe XVI satellite
line (e.g., Brown et al. 2001), possibly explaining a trend of increasing
-ratios with decreasing temperature (Ness et al. 2003).
Since TW Hya does have
relatively low X-ray temperature (Kastner et al. 2002; Stelzer & Schmitt 2004), the same reason can account
for the anomalously high flux in the 15.26-Å line. In view of this ambiguity
we also studied the H-like Ly/Ly
line ratios of O VIII
and Ne X. In Fig. 3 we show a sample of stellar ratios of O VIII
with the blending correction applied as described above, compared with the measurement
of TW Hya and atomic data predictions;
the same line ratio has been used by Testa et al. (2004) finding II Peg and IM Peg to
be anomalous. The TW Hya measurement is marked
with the hashed box bracketing the formal
uncertainties in the line ratio
and in temperature. Theoretical predictions
from APEC and Chianti agree quite well with each other
and uncertainties in
do not lead to different conclusions.
However, we note in this context that the above blending correction is
not straightforward, since it is predicted rather differently
by Chianti and APEC (which we used for the correction).
In view of the stellar measurements and the fact that the error bars do not include
uncertainties from the blending correction,
this deviation from theory appears rather marginal. We carried out the same procedure
for the Ne X lines and found no deviation from the stellar measurements
(Table 2).
![\begin{figure}
\par\includegraphics[width=8.8cm,clip]{Hh311_f3}
\end{figure}](/articles/aa/full/2005/47/aahh311/Timg59.gif) |
Figure 3:
Theoretical predictions of Ly/Ly
ratio as
a function of temperature for O VIII and measurements of TW Hya
compared with stellar measurements (temperatures from
O VIII/O VII line ratios); shaded areas are predictions for
values of
 cm-2. cm-2. |
| Open with DEXTER |
We identified and measured a new line flux ratio sensitive to density, which
strongly supports earlier conclusions of high plasma densities in TW Hya.
The ratio of
is a sensitive tracer of
high densities with little contamination from UV radiation or temperature.
Besides the extremely low f/i ratios in O VII and Ne IX we also
found this ratio to be anomalously low compared to all stellar coronae.
Unfortunately, quantitative constraints on density are still ambiguous because
theoretical calculations do not yet cover the full range of interactions between the
ground state and excited states. At any rate, the density of TW Hya appears to be
higher than that of typical stellar coronae, but lower than that of the intermediate
polar EX Hya. Unambiguous X-ray density measurements as
obtained here are also important for other cTTS.
The 15.01-Å and 15.26-Å Fe XVII lines provide a sensitive test for the
effects of resonant line scattering. A comparison of this ratio for TW Hya with a sample
of cool stars (Ness et al. 2003) shows a large value for TW Hya albeit with substantial
error; similarly large values are found for EV Lac and Prox Cen. However, as
discussed by Ness et al. (2003) the relative strength of the 15.26-Å line can also be
explained by blending with low-temperature lines, leading us to conclude that the line
ratio of the 15.01-Å and 15.26-Å lines provides no unambiguous evidence for
resonance scattering in TW Hya. Next, we examined the ratios of H-like
Ly/Ly lines, which are also sensitive to resonant scattering (cf.
Fig. 3). While the Ly/Ly line ratio for TW Hya is clearly
above the theoretical expectation, it does not differ significantly from those
encountered in stellar coronae. Also, there is a nagging uncertainty about the blending
correction with Fe XVIII, so that any resonant scattering effects appear
marginal. Since the situation is similar for Ne X we conclude that there is
no clear evidence for any X-ray optical depth effects in TW Hya and that the optical
depth  should be below unity.
![\begin{figure}
\par\includegraphics[width=8.8cm,clip]{Hh311_f4}
\end{figure}](/articles/aa/full/2005/47/aahh311/Timg61.gif) |
Figure 4:
Area vs. density  from the requirement
optical depth
from the requirement
optical depth  ;
area values for surface filling factors are indicated. ;
area values for surface filling factors are indicated. |
| Open with DEXTER |
The apparent absence of resonant scattering and the value of the observed emission
measure in a line can be combined as follows: we use the formula
for the optical depth
at line center derived by Bhatia & Saba (2001)
 where f denotes the oscillator strength and
  wavelength, M
atomic mass, TD temperature,
wavelength, M
atomic mass, TD temperature,
 ion density, and L path
length. Next, the product
ion density, and L path
length. Next, the product
 can be expressed in terms of
the volume emissionmeasure
can be expressed in terms of
the volume emissionmeasure
 ,
where
denotes the electron
density and A the area of the assumed cylindrical emission region.
and
are related through
,
where
denotes the electron
density and A the area of the assumed cylindrical emission region.
and
are related through
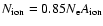 ,
where
,
where
 denotes the abundance of the considered ion relative to hydrogen,
assumed to be
denotes the abundance of the considered ion relative to hydrogen,
assumed to be
 .
We thus obtain VEM
.
We thus obtain VEM
 .
In Fig. 4 we plot (assuming
.
In Fig. 4 we plot (assuming  and 0.5) A as a function of ;
note that this curve moves up for -values below unity.
Since the area shown is bounded above by (half) the stellar surface, we also plot a
shaded area corresponding to surface filling factors of accretion hot spots between 0.5
and 0.05. If these filling factors are indeed of the order of a few percent as usually
assumed for cTTS, it is clear that densities in excess of 1012 cm-2 are
required to account for both the observed emission measure in TW Hya as well as the
absence of any clear optical depth effects.
and 0.5) A as a function of ;
note that this curve moves up for -values below unity.
Since the area shown is bounded above by (half) the stellar surface, we also plot a
shaded area corresponding to surface filling factors of accretion hot spots between 0.5
and 0.05. If these filling factors are indeed of the order of a few percent as usually
assumed for cTTS, it is clear that densities in excess of 1012 cm-2 are
required to account for both the observed emission measure in TW Hya as well as the
absence of any clear optical depth effects.
Acknowledgements
We thank Prof. C. Jordan for sharing her profound experience with Fe XVII
ensuring that our discussion is consistent with all important background information
of atomic physics and Dr. Brickhouse and Dr. Huenemoerder for discussion
of instrumental issues.
J.-U.N. acknowledges support from PPARC under grant number PPA/G/S/2003/00091.
- Anders, E., &
Grevesse, N. 1989, Geochim. Cosmochim. Acta, 53, 197 [NASA ADS] [CrossRef] (In the text)
- Balucinska-Church, M.,
& McCammon, D. 1992, ApJ, 400, 699 [NASA ADS] [CrossRef] (In the text)
- Bhatia, A. K.,
& Saba, J. L. R. 2001, ApJ, 563, 434 [NASA ADS] [CrossRef] (In the text)
- Brown, G. V.,
Beiersdorfer, P., Chen, H., Chen, M. H., & Reed, K. J. 2001,
ApJ, 557, L75 [NASA ADS] [CrossRef] (In the text)
- Feigelson, E. D.,
& Montmerle, T. 1999, ARA&A, 37, 363 [NASA ADS] (In the text)
- Gabriel, A. H., &
Jordan, C. 1969, MNRAS, 145, 241 [NASA ADS] (In the text)
- Gu, M. F. 2003, ApJ, 582,
1241 [NASA ADS] [CrossRef] (In the text)
- Kastner, J. H.,
Huenemoerder, D. P., Schulz, N. S., Canizares, C. R., &
Weintraub, D. A. 2002, ApJ, 567, 434 [NASA ADS] [CrossRef]
- Mauche, C. W.,
Liedahl, D. A., & Fournier, K. B. 2001, ApJ, 560, 992 [NASA ADS] [CrossRef] (In the text)
- Ness, J.-U., &
Wichmann, R. 2002, AN, 323, 129 [NASA ADS] (In the text)
- Ness, J.-U.,
Schmitt, J. H. M. M., Audard, M., Güdel, M., & Mewe, R.
2003, A&A, 407, 347 [EDP Sciences] [NASA ADS] [CrossRef] (In the text)
- Ness, J.-U.,
Güdel, M., Schmitt, J. H. M. M., Audard, M., & Telleschi,
A. 2004, A&A, 427, 667 [EDP Sciences] [NASA ADS] [CrossRef] (In the text)
- Schmitt, J. H. M. M.,
Robrade, J., Ness, J.-U., Favata, F., & Stelzer, B. 2005,
A&A, 432, L35 [EDP Sciences] [NASA ADS] [CrossRef] (In the text)
- Smith, R. K.,
Brickhouse, N. S., Liedahl, D. A., & Raymond, J. C. 2001, ApJ,
556, L91 [NASA ADS] [CrossRef] (In the text)
- Stelzer, B., &
Schmitt, J. H. M. M. 2004, A&A, 418, 687 [EDP Sciences] [NASA ADS] [CrossRef]
- Testa, P., Drake,
J. J., Peres, G., & DeLuca, E. E. 2004, ApJ, 609, L79 [NASA ADS] [CrossRef] (In the text)
Copyright ESO 2005
![\begin{figure}
\par\includegraphics[width=18cm,clip]{Hh311_f1}
\end{figure}](/articles/aa/full/2005/47/aahh311/img9.gif)
![\begin{figure}
\par\includegraphics[width=8.8cm,clip]{Hh311_f2}
\end{figure}](/articles/aa/full/2005/47/aahh311/img57.gif)
![\begin{figure}
\par\includegraphics[width=8.8cm,clip]{Hh311_f3}
\end{figure}](/articles/aa/full/2005/47/aahh311/img59.gif)
![\begin{figure}
\par\includegraphics[width=8.8cm,clip]{Hh311_f4}
\end{figure}](/articles/aa/full/2005/47/aahh311/img61.gif)