![\begin{figure}
\par\includegraphics[width=8.4cm,clip]{3082fig1.eps}
\end{figure}](/articles/aa/full/2005/46/aa3082-05/img13.gif) |
Figure 1:
The variation of the relative rms contrast of the continuum intensity during the time series. The wavelength range used was centered at 4993.12 Å and the slit length used for the calculation was 65
 . . |
| Open with DEXTER | |
In the text
![\begin{figure}
\par\includegraphics[width=8.4cm,clip]{3082fig2.eps}
\end{figure}](/articles/aa/full/2005/46/aa3082-05/img18.gif) |
Figure 2: Temporal-spatial map of the continuum intensity. The horizontal stripes of lower intensity contrast are due to seeing (see Fig. 1). |
| Open with DEXTER | |
In the text
![\begin{figure}
\par\includegraphics[width=8.4cm,clip]{3082fg3a.eps}
\includegraphics[width=8.4cm,clip]{3082fg3b.eps}
\end{figure}](/articles/aa/full/2005/46/aa3082-05/img19.gif) |
Figure 3: Temporal-spatial maps of the residual intensities of Fe II ( upper panel) and Fe I ( lower panel). |
| Open with DEXTER | |
In the text
![\begin{figure}
\par\includegraphics[width=8.4cm,clip]{3082fg4a.eps}
\includegraphics[width=8.4cm,clip]{3082fg4b.eps}
\end{figure}](/articles/aa/full/2005/46/aa3082-05/img20.gif) |
Figure 4: Temporal-spatial maps of the velocities of Fe II ( upper panel) and Fe I ( lower panel). |
| Open with DEXTER | |
In the text
![\begin{figure}
\par\includegraphics[width=8.4cm,clip]{3082fig5.eps}
\end{figure}](/articles/aa/full/2005/46/aa3082-05/img21.gif) |
Figure 5: Comparison of the rms fluctuations of the continuum intensity (same as Fig. 1) with the temporal variations of correlations to determine the influence of seeing. |
| Open with DEXTER | |
In the text
![\begin{figure}
\par\includegraphics[width=8.4cm,clip]{3082fig6.eps}
\end{figure}](/articles/aa/full/2005/46/aa3082-05/img31.gif) |
Figure 6:
Temporal variation of two correlation coefficients versus the rms of the continuum fluctuations (Asterisks:
 ,
triangles: ,
triangles:
 ). ). |
| Open with DEXTER | |
In the text
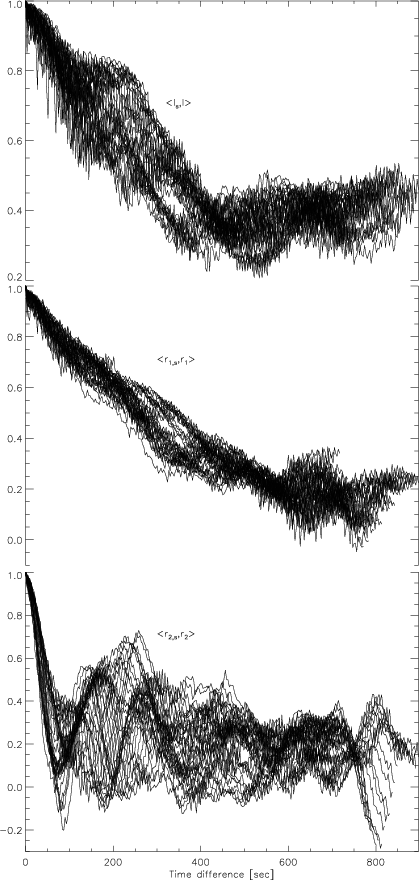 |
Figure 7: The autocorrelations of the intensities I (continuum), r1 (Fe II) and r2 (Fe I) with increasing time difference. Each second of the first 70 spectra was taken as a starting spectrum. |
| Open with DEXTER | |
In the text
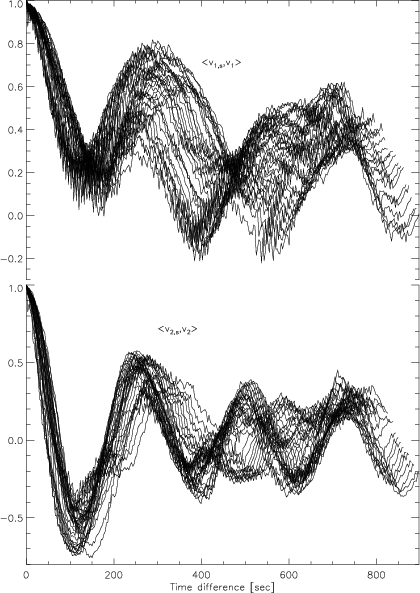 |
Figure 8: The autocorrelations of the velocities v1 (Fe II) and v2 (Fe I) with increasing time difference. Each second of the first 70 spectra was taken as a starting spectrum. |
| Open with DEXTER | |
In the text
![\begin{figure}
\par\includegraphics[width=8.4cm,clip]{3082fig9.eps}
\end{figure}](/articles/aa/full/2005/46/aa3082-05/img37.gif) |
Figure 9: The temporal variation of the crosscorrelation between continuum and residual intensities for the Fe II line (solid) and the Fe I line (dotted) and between both residual intensities (dashed). Horizontal bars indicate times of worse seeing. |
| Open with DEXTER | |
In the text
![\begin{figure}
\par\includegraphics[width=8.4cm,clip]{3082fg10.eps}
\end{figure}](/articles/aa/full/2005/46/aa3082-05/img38.gif) |
Figure 10: The temporal variation of the crosscorrelation of the velocity of the Fe I line with continuum intensity (solid), residual intensity of Fe II (dashed), and residual intensity of Fe I (dotted). Horizontal bars indicate times of worse seeing. |
| Open with DEXTER | |
In the text
![\begin{figure}
\par\includegraphics[width=8.4cm,clip]{3082fg11.eps}
\end{figure}](/articles/aa/full/2005/46/aa3082-05/img39.gif) |
Figure 11: The temporal variation of the crosscorrelation between both velocities. Horizontal bars indicate times of worse seeing. |
| Open with DEXTER | |
In the text