![[*]](/icons/foot_motif.gif)
A&A 444, 101-107 (2005)
DOI: 10.1051/0004-6361:20053012
B. W. Holwerda 1,2 - R. A. González 3 - Ronald J. Allen 1 - P. C. van der Kruit 2
1 - Space Telescope Science Institute, Baltimore, MD 21218, USA
2 -
Kapteyn Astronomical Institute, University of Groningen, PO Box 800, 9700 AV Groningen, The Netherlands
3 -
Centro de Radiastronomía y Astrofísica, Universidad Nacional Autónoma de México, 58190 Morelia, Michoacán, Mexico
Received 7 March 2005 / Accepted 4 July 2005
Abstract
The opacity of spiral galaxy disks, from counts of distant galaxies, is compared
to HI column densities. The opacity measurements are calibrated using the
"Synthetic Field Method'' from González et al. (1998, ApJ, 506, 152), Holwerda et al. (2005a, AJ, 129, 1381).
When compared for individual disks, the HI column density and dust opacity
do not seem to be correlated as HI and opacity follow different radial profiles.
To improve statistics, an average radial opacity profile is compared to an average
HI profile. Compared to dust-to-HI estimates from the literature, more extinction is
found in this profile. This difference may be accounted for by an underestimate of
the dust in earlier measurements due to their dependence on dust temperature.
Since the SFM is insensitive to the dust temperature, the ratio between the SFM
opacity and HI could very well be indicative of the true ratio.
Earlier claims for a radially extended cold dust disk were based on sub-mm observations.
A comparison between sub-mm observations and counts of distant galaxies is therefore
desirable. We present the best current example of such a comparison, M 51, for which
the measurements seem to agree. However, this remains an area where improved
counts of distant galaxies, sub-mm observations and our understanding of dust
emissivity are needed.
Key words: radiative transfer - methods: statistical - ISM: dust, extinction - galaxies: ISM - galaxies: spiral - submillimeter
The relationship between gas and dust in spiral disks has been the focus of many observational studies often combined with efforts to characterize the chemical composition. Dust plays an important role in the energy and chemistry budgets of a disk, as is evident in our own Galaxy. The question comes simply down to whether the dust is distributed as the stars, which produce it, or like the gas, such as atomic hydrogen, which is dynamically coupled to it. Furthermore, some fraction of the gas which is associated with the dust will be in the form of cold dark molecular clouds, which may be of very high opacity. Cold dust can in principle be detected by either sub-millimeter emission or through the extinction of a background source.
A first attempt to characterize cold dust clouds and their relation to HI in a nearby galaxy, was by Hodge (1980); his Figs. 8 and 9 show the radial distribution of the number of dark clouds and HI column density along the minor and major axes of M 31. No correlation between the two tracers was found.
In recent years, the Infrared Space Observatory (ISO), and the Sub-Millimeter Common User Bolometer Array (SCUBA) on the James Clerk Maxwell Telescope have detected and mapped the cold dust component of spiral disks. This cold component has been found at much larger radii in galaxy disks than the warm dust. Alton et al. (1998b) and Trewhella et al. (2000) found evidence from ISO for cold dust at larger radii. Alton et al. (2000b,1998a) studied the distribution of emission in NGC 891 and also found evidence for a cold dust disk. Alton et al. (2000a) found evidence for dust outside the optical disk in NGC 660. In addition, Bianchi et al. (2000) and Alton et al. (2004) found a correlation between CO and 850 micron emission in NGC 6946 and interpreted this as evidence for a correlation between molecular hydrogen and cold dust. The relation between gas and dust has been explored using the SCUBA array and synthesis mapping of the atomic hydrogen (HI). Recent SCUBA results (Stevens et al. 2005; Thomas et al. 2004) are presented in relation to HI column density. Stevens et al. (2005) gives the ratio between gas and dust masses and Thomas et al. (2004) compare the radial extent of dust and HI and find similar scalelenghts for both.
Spectral energy distribution modeling (SED) of edge-on galaxy disks (Misiriotis et al. 2001; Popescu & Tuffs 2002; Popescu et al. 2000) indicate that the dust's emission is
powered by HII regions in the case of warm dust (
 )
and diffuse stellar radiation in the case of cold dust (
)
and diffuse stellar radiation in the case of cold dust (
 ).
The infrared flux is dominated by dust illuminated by nearby stars and an cold dust is
only visible in the sub-mm part of the spectrum.
Therefore, a cold dust component is relatively more prominent
at higher radii where the dust clouds are not illuminated as much by the stellar population.
).
The infrared flux is dominated by dust illuminated by nearby stars and an cold dust is
only visible in the sub-mm part of the spectrum.
Therefore, a cold dust component is relatively more prominent
at higher radii where the dust clouds are not illuminated as much by the stellar population.
Parallel to this observational effort to characterize the emission, there
is an effort to characterize the extinction in disks using known background sources.
Two types of known background sources are in use: occulted galaxies and the number
of distant galaxies. The occulting galaxy technique has been exhausted on the rare
nearby pairs (Andredakis & van der Kruit 1992; Keel & White 2001a; Domingue et al. 2000; White et al. 2000; White & Keel 1992; Domingue et al. 1999; Keel & White 2001b). Domingue et al. (1999)
compared the extinction and dust emission in their pairs and found reasonable agreement
between dust masses and no need for an extremely cold (
 )
component.
)
component.
The present paper is one of a series using the number of distant galaxies seen through the foreground disk in Hubble Space Telescope (HST) images as an extinction probe. The identified number of distant galaxies suffers from crowding and confusion effects. To calibrate this observed number, González et al. (1998) developed the "Synthetic Field Method'' (SFM). A series of synthetic fields is constructed, with the original science field to which a dimmed deep field is added. From the relation between detected added background galaxies and the dimming of the deep field, the average dimming of the science field can be inferred. Holwerda et al. (2005a) automated this method and Holwerda et al. (2005b) reported on the radial opacity profiles of a sample of nearby galaxies.
In this paper, the radial opacity profiles from Holwerda et al. (2005b) are compared to HI surface density profiles from the literature for the same galaxies. The inferred ratios and radial profiles are compared to those obtained from sub-mm observations and others in the literature.
This paper is organized as follows: Sect. 2 gives a brief description of the "Synthetic Field Method''. The HI surface density radial profiles, radial opacity profiles and their ratios are presented in Sect. 3. Radial opacity-to-HI profiles averaged for the whole sample are compared to values from the literature in Sect. 4. Section 5 compares the sub-mm profiles from the literature to our opacity profiles. The conclusions are summarized in Sect. 6 with a view to future work in Sect. 7.
The number of distant galaxies seen through a spiral disk does not only depend on the level
of extinction in the disk but also on the crowding and confusion by the objects in the
foreground disk. To calibrate the effects of crowding and confusion, González et al. (1998)
and Holwerda et al. (2005a) developed the "Synthetic Field Method'' (SFM). This method
consists of several steps. First the number of distant galaxies seen in the science field
is identified. The selection is based on object characteristics and color and visually
checked. Secondly, a series of synthetic fields is constructed. These are the original
science field with a Hubble Deep Field added, dimmed to mimic dust extinction.
Thirdly, the added distant galaxies are identified in these synthetic fields.
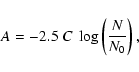
A relationship between the dimming of the synthetic field (A) and the number of added
galaxies retrieved (N) can be found and we fit the following equation to this:
Cosmic variance in the number of distant galaxies in a given field adds an extra uncertainty to the number of distant galaxies found in the science field. As a result, opacity measurements in a single WFPC2 field or section thereof have high uncertainties associated with them. To combat this, we have automated this method (Holwerda et al. 2005a) and applied it to a sizeable sample of archival WFPC2 fields (Holwerda et al. 2005b). In this series of papers, we have explored the relations of disk opacity with radius (Holwerda et al. 2005b), the surface brightness (Holwerda et al. 2005c) and HI in this paper. Holwerda et al. (2005d) explore the limitations of this method as predicted by González et al. (2003), concluding that the optimal foreground disk distance is somewhere between 5 and 30 Mpc.
Table 1: HI surface density profiles from the literature. Some of these profiles may suffer from short-spacing problems which would underestimate the flux from HI on larger scales.
The number of distant background galaxies as a function of HI column density is best directly measured using an overlay of the HI column density map on an HST field. See for example the analysis by Cuillandre et al. (2001) of a ground-based field in M 31. However, since the HI column density maps are not easily available and not uniform, the relation between radial profiles of HI and opacity is used.
Holwerda et al. (2005b) present radial profiles for individual galaxies and composites
of fields (their Table 3). HI surface density profiles were taken from the literature
for the subset of our sample for which these were available (Table 1).
HI surface density profiles of the galaxies were extracted from the literature using
the DEXTER program (Demleitner et al. 2001) and rescaled to express radius in R25
(de Vaucouleurs et al. 1991) and surface density in
 .
.
![\begin{figure}
\par\includegraphics[width=8.4cm,clip]{3012fig1a.ps}
\end{figure}](/articles/aa/full/2005/46/aa3012-05/img13.gif) |
Figure 1a:
The HI and opacity profiles of individual galaxies in our sample. AI is expressed in magnitudes, the atomic hydrogen surface density (
 )
in solar masses per square parsec (
). The HI surface density profiles often do not have uncertainties reported with them. See Table 1 for the original reference for the HI surface density profiles. The most recent profiles are used in all cases. NGC 4414 has two WFPC2 fields associated with it. )
in solar masses per square parsec (
). The HI surface density profiles often do not have uncertainties reported with them. See Table 1 for the original reference for the HI surface density profiles. The most recent profiles are used in all cases. NGC 4414 has two WFPC2 fields associated with it. |
In Figs. 1 and 1 the individual radial surface density profiles of HI and the opacity profiles are shown. The opacity was determined for the sections of the WFPC2 fields corresponding to radial intervals of 0.25 R25. Both the opacity profiles and the HI surface density profiles of spiral disks display a variety of shapes. However, in general, the HI profile peaks somewhere in the disk and flattens out or dips near the galaxy's center. The opacity profiles show a gradual rise towards the disk's center. It should be noted that the HI profiles are the azimuthally average for the entire disk, while the opacity profile is derived from the smaller section of the disk corresponding to the HST image i.e. these profiles are for the same spiral galaxy but not determined from the same section of the disk.
To see if there is correlation between HI surface density and disk opacity, the values of the profiles in Figs. 1 and 1 are plotted in Fig. 2. Averaged over radial intervals of 0.25 R25, there seems to be no correlation between HI column density and dust opacity in a spiral disk. The lack of a relation may be explained by the fact that the opacity profiles generally rise in the center of galaxies (Holwerda et al. 2005b), while radial HI surface density profiles often show a drop in the galaxy's center (see also Figs. 1 and 1). Alternatively, part of the hydrogen gas may be associated in molecular clouds, undetected in HI observations.
![\begin{figure}
\par\includegraphics[width=8.5cm,clip]{3012fig2.ps}
\end{figure}](/articles/aa/full/2005/46/aa3012-05/img15.gif) |
Figure 2:
The average opacity (AI) and surface density (
 )
for radial annuli of 0.25 R25 in individual galaxies in our sample (see Figs. 1 and 1). )
for radial annuli of 0.25 R25 in individual galaxies in our sample (see Figs. 1 and 1). |
| Open with DEXTER | |
To reduce the uncertainties in the opacity measurement, the galaxy counts from several fields must be combined. This can be done e.g. per Hubble type or for the entire sample (see Holwerda et al. 2005b, for this type of analysis).
In Fig. 3, the average HI-to-opacity plot based on our entire sample (Table 1) is compared to HI-to-opacity measurements from the literature. To obtain this HI-to-dust profile, the opacities were re-derived and the HI profiles averaged. First, all the counts of distant galaxies, from all the synthetic and science fields, were combined. Then the opacity was derived again from the combined counts in radial intervals, using Eq. (1). The HI surface density profiles from Figs. 1 and 1 were combined by adding mass and surface contributions of each profile in a radial section and taking the ratio of the sums.
An average opacity taken over many galaxies does not suffer from poor statistics as the individual profiles do, but small scale variations are smoothed out. The radial profile of dust-to-HI remains relatively constant for most of the optical disk and turns upward beyond that. At this point, the HI profiles diminish but the opacity profiles remain more or less constant. The radial profile becomes more uncertain beyond R25 as the WFPC2 fields used for the SFM analysis were centered on the optical disk (see for more on the selection of our original sample Holwerda et al. 2005b). For illustration, only two galaxies have enough counts for a reasonable SFM measurement beyond the R25. The trend of the dust-to-HI ratio beyond the R25 is therefore correspondingly uncertain.
The comparison data from the literature are based on a series of techniques to
determine the dust content.
Issa et al. (1990) compile dust-to-HI measurements from the literature for a few nearby
galaxies and normalize these to the Galactic value of Bohlin et al. (1978) and a distance
of 0.7 R25 from their galaxies's center. These values from Issa et al. (1990) are
derived from the line ratio between H and H
and H .
Mayya & Rengarajan (1997) infer average dust-to-HI profiles from IRAS emission at 60 micron
which traces only the warm dust. They give a range of conversion values for the optical
depth at 60 micron and in V.
Boissier et al. (2004) present radial dust-to-HI profiles for 6 galaxies deduced from the
FIR/UV ratio.
Cuillandre et al. (2001) derive a relation between HI column density and stellar reddening
for M 31. The average HI-to-dust ratio from the sub-mm observations of disks by
Stevens et al. (2005) is also indicated. Their total sub-mm flux density was
converted using the ratio found by Alton et al. (1998b) and an estimate of the disk area using
the D25.
.
Mayya & Rengarajan (1997) infer average dust-to-HI profiles from IRAS emission at 60 micron
which traces only the warm dust. They give a range of conversion values for the optical
depth at 60 micron and in V.
Boissier et al. (2004) present radial dust-to-HI profiles for 6 galaxies deduced from the
FIR/UV ratio.
Cuillandre et al. (2001) derive a relation between HI column density and stellar reddening
for M 31. The average HI-to-dust ratio from the sub-mm observations of disks by
Stevens et al. (2005) is also indicated. Their total sub-mm flux density was
converted using the ratio found by Alton et al. (1998b) and an estimate of the disk area using
the D25.
![\begin{figure}
\par\includegraphics[width=8.5cm,clip]{3012fig3.ps}
\end{figure}](/articles/aa/full/2005/46/aa3012-05/img16.gif) |
Figure 3:
The radial dust-to-HI profiles from Issa et al. (1990), Mayya & Rengarajan (1997),
Boissier et al. (2004) and this paper (thick line, uncertainties are dashed).
The symbols are the values from Issa et al. (1990) (H/H
ratio).
Note how these are higher for the same galaxy as the values from
Boissier et al. (2004).
The three bottom lines are the Mayya & Rengarajan (1997) (IRAS 60  m emission)
average ratio, for the different conversion factors between the 60 m
optical depth and the V band optical depth ( m emission)
average ratio, for the different conversion factors between the 60 m
optical depth and the V band optical depth (
 ).
The curves in the middle are the dust-to-HI profile from Boissier et al. (2004) (UV/FIR ratio),
for their 6 galaxies, converted to I band extinctions using Boselli et al. (2003).
The arrow right is the average ratio from Stevens et al. (2005) (850 m emission),
the combined warm and cold dust over HI. ).
The curves in the middle are the dust-to-HI profile from Boissier et al. (2004) (UV/FIR ratio),
for their 6 galaxies, converted to I band extinctions using Boselli et al. (2003).
The arrow right is the average ratio from Stevens et al. (2005) (850 m emission),
the combined warm and cold dust over HI. |
| Open with DEXTER | |
The comparison to other results in Fig. 3 raises the question why the opacity measurement from the number of distant galaxies results in a dust-to-HI ratio that is an order of magnitude higher than the nearest recent estimate (Boissier et al. 2004). There are several effects which could have affected the average dust-to-HI profile from counts of galaxies. (1) The opacity measure from the counts of galaxies is averaged over a series of Hubble types and HI profiles. (2) The older HI surface density profiles may underestimate the HI column density, especially the larger scale structure due to lack of short-spacing information. (3) The opacities are predominantly determined for fields with a spiral arm while the HI profiles are averages over the whole of disk. This may have lowered the HI column density profile with respect to the measured opacity. (4) The average opacity measurement from counts of galaxies indicates the covering factor of dark clouds. One could argue that this covering factor is an overestimate as the distant galaxy does not need to be completely covered in order to be dropped from the counts. All these effects could have lowered the dust-to-HI profile presented here.
The other profiles also suffer from various different systematics.
The dust-to-HI ratio estimates from the literature rely on the light of the disk itself to
estimate the dust content. This inherently biases the measurement to lower extinction
values, as not the entire height of the dust disk is responsible for the observed extinction
and the measured light is biased towards low-extinction lines of sight. The different
manner in which the dust content was estimated may also play a role.
The values from Issa et al. (1990) are for very specific parts of the disk, e.g. the HII regions,
and these were scaled to a single radius. Still, the ratio is similar to those found by
other authors for the whole of the disk. The infrared measures of Mayya & Rengarajan (1997)
(
 )
show substantially more HI for a given amount of dust.
Most likely this is the effect of their observational technique which is more sensitive
to the warmer component of the dust in the spiral disk, which dominates the infrared
emission. The fact that infrared emission only detects 10 to 20% of the dust in a
disk was also found by Devereux & Young (1990) from 60 and 100
)
show substantially more HI for a given amount of dust.
Most likely this is the effect of their observational technique which is more sensitive
to the warmer component of the dust in the spiral disk, which dominates the infrared
emission. The fact that infrared emission only detects 10 to 20% of the dust in a
disk was also found by Devereux & Young (1990) from 60 and 100  emission
observed with IRAS.
By taking the ratio of UV and far-IR flux, Boissier et al. (2004) can characterize better
the total dust content of a disk. The average value from Stevens et al. (2005) is again closer
to this paper's profile.
emission
observed with IRAS.
By taking the ratio of UV and far-IR flux, Boissier et al. (2004) can characterize better
the total dust content of a disk. The average value from Stevens et al. (2005) is again closer
to this paper's profile.
The progression from the values of Mayya & Rengarajan (1997) to those of Boissier et al. (2004) and Stevens et al. (2005) indicates that the more sensitive the dust indicators become for the colder dust component in a disk, the more dust is detected in relation to the HI. It has also been found by several authors (Alton et al. 1998b; Popescu & Tuffs 2002) that the bulk of the dust reveals itself when more sensitive dust indicators are used. Taken in this context, the SFM estimate (the thick line in Fig. 3) of dust content of disks, which is independent of dust temperature, may reflect the actual total dust-to-HI ratio.
The SCUBA detector on the JCMT detects sub-mm emission from cold dust in spiral
disks. In order to verify whether or not this cold dust is responsible for the opacity
measured with the SFM, a direct comparison should be made. Four galaxies in
our sample were mapped in the 850
band by different authors
(Stevens et al. 2005; Meijerink et al. 2005; Alton et al. 2002,2001). However, the individual opacity
measurements and the conversion from 850 micron flux to an optical depth do not
allow for a good comparison. The exact emissivity of dust grains at these wavelengths
may still be underestimated (Dasyra et al. 2005; Alton et al. 2004,2000b). To illustrate a
comparison between a SCUBA map and our counts, we present the best current
example: the exponential disk found by Meijerink et al. (2005) for M 51 and our distant
galaxy counts from two WFPC2 fields.
Meijerink et al. (2005) present a detailed map of the 850 micron emission, as well as an exponential optical depth profile for the dust disk. Figure 4 shows the 850 micron emission profile from Meijerink et al. (2005) translated to an opacity value in V and I and the opacity measurements of the two WFPC2 fields and their average. Our WFPC2 fields predominantly miss the sections of the disk for which Meijerink et al. (2005) report additional flux from the spiral arms. However, a proper comparison can be done when the sub-mm observations and the counts of distant galaxies are from a similar sized field. For now we can only conclude that the points and the profile seem to agree.
A good comparison between opacity and sub-mm flux can be obtained with more and better sub-mm maps and sufficient counts of distant galaxies. The new SCUBA-2 instrument on the JCMT promises to facilitate this mapping of nearby galaxies. However the expected emissivity of dust grains must then also be known for an accurate comparison. An advantage of the counts of distant galaxies is that they can be extended to larger radii and lower opacity values and can independently verify the profile found from sub-mm observations.
Both observational techniques can be used to explore the radial extent of dust in spiral disks. Our previous composite profile (Holwerda et al. 2005b) already pointed to and extended dust disk as well as several sub-mm observations (Popescu & Tuffs 2003; Nelson et al. 1998; Trewhella et al. 2000; Alton et al. 1998c). Currently the extent is taken to be somewhere between the optical and the HI scale. A more accurate determination of that can be achieved with either more sensitive sub-mm observations or future galaxy counts or both combined.
![\begin{figure}
\par\includegraphics[width=8.5cm,clip]{3012fig4.ps}
\end{figure}](/articles/aa/full/2005/46/aa3012-05/img19.gif) |
Figure 4: The profile of M 51 from Meijerink et al. (2005) (dashed lines) and the opacities from Holwerda et al. (2005b) (points). Solid points are the individual WFPC2 fields, the open triangles are the derived from combined WFPC2 fields. The errorbars shown are for the combined opacity and the radial bin size is 0.25 R25. The top axis shows the radius in R25). Conversion from the SCUBA profile to an opacity in V used two times the Galactic emissivity at 850 micron and the Galactic reddening law was used to convert the opacity profile in V to one in I. |
| Open with DEXTER | |
In summary, we draw the following conclusions from the comparison between opacity from the number of distant galaxies with HI profiles:
The relation between sub-mm emission and opacity is an important area for future work. A more accurate comparison between the SFM opacity profile and the SCUBA emission profile of M 51 should become possible in the near future with the HST/ACS observations by the Hubble Heritage Team. A similar comparison could be made for M 101, provided such a large solid angle could be successfully scanned by the new SCUBA-2 or its successors.
By comparing the SFM opacity to HI column density averaged over a radial interval, small variations are smoothed out. A more direct approach is to compare SFM opacity directly in contours of HI column density. This requires uniform HST imaging of a nearby galaxy and a deep and uniform HI map as well. Such data exists for M 101 and M 51 and the relation between HI and dust could then be characterized more accurately and out to a larger radius.
Acknowledgements
The authors would like to thank the referee, Simone Bianchi for his comments, Jason Stevens for making the SCUBA map of NGC 4414 available and George Bendo for useful discussions on SCUBA observations. This research has made use of the NASA/IPAC Extragalactic Database, which is operated by the Jet Propulsion Laboratory, California Institute of Technology, under contract with the National Aeronautics and Space Administration (NASA). This work is primarily based on observations with the NASA/ESA Hubble Space Telescope, obtained at the STScI, which is operated by the Association of Universities for Research in Astronomy (AURA), Inc., under NASA contract NAS5-26555. Support for this work was provided by NASA through grant number HST-AR-08360 from STScI to Prof. Dr. R. J. Allen. STScI is operated by AURA, Inc., under NASA contract NAS5-26555. We are also grateful for the financial support of the STScI Directors Discretionary Fund (grants 82206 and 82304 to R. J. Allen) and of the Kapteyn Institute of Groningen University.
![\begin{figure}\par\includegraphics[width=8.4cm,clip]{3012fig1b.ps}
\end{figure}](/articles/aa/full/2005/46/aa3012-05/img14.gif)