A&A 443, 1055-1059 (2005)
DOI: 10.1051/0004-6361:20053341
The HeI abundance in Solar filaments
F. Chiuderi Drago
Department of Astronomy and Space Science, University of
Florence, Italy
Received 29 April 2005 / Accepted 29 July 2005
Abstract
Three filaments observed with the CDS instrument on the SOHO
satellite are analysed to determine the HeI/HI ratio.
The HI and Hel bound-free absorptions are the major processes
responsible for the
lower intensity of transition region (TR) lines observed above filaments.
One of the filaments was also observed by SUMER at
 Å, thus
supplying the unabsorbed background intensity. The HI and Hel column densities
are derived from several TR lines using a least squares method applied to
two different models. The resulting HeI/HI ratio is independent of the model,
while the column densities are different by about a factor of two.
This difference enables us to discriminate between the two models by
comparing the resulting value of the optical depth at the Lyman continuum
limit,
Å, thus
supplying the unabsorbed background intensity. The HI and Hel column densities
are derived from several TR lines using a least squares method applied to
two different models. The resulting HeI/HI ratio is independent of the model,
while the column densities are different by about a factor of two.
This difference enables us to discriminate between the two models by
comparing the resulting value of the optical depth at the Lyman continuum
limit,
 ,
with previous observations and models.
,
with previous observations and models.
Key words: Sun: filaments - Sun: UV radiation
Since the launch of the Solar and Heliospheric Observatory (SoHO),
several observations of disk filaments have been preformed. The main
purpose for observations of filaments and prominences in UV and EUV lines
was, at the beginning, the analysis of the thin prominence-corona
transition region (PCTR). Our knowledge of the quiet sun transition
region (TR) comes in fact from the analysis of UV and EUV lines formed
in the temperature range
 K and of the microwaves
radiation.
K and of the microwaves
radiation.
It became clear, by analysing a filament observed
by the Solar Ultraviolet Measurements of Emitted Radiation (SUMER) and
the Coronal Diagnostic Spectrometer (CDS), that the PCTR emission
above the filament is negligible and that the lower TR line intensity
observed at the filament site (only at
 Å)
was due to the Lyman
continuum (
Å)
was due to the Lyman
continuum (
 )
absorption of the radiation coming from the
underlying quiet sun TR within the cool prominence body (Chiuderi
Drago et al. 2001, Paper I). If the quiet sun TR emission
under the filament (the background) is lower than the average, the PCTR
emission could be not negligible.
)
absorption of the radiation coming from the
underlying quiet sun TR within the cool prominence body (Chiuderi
Drago et al. 2001, Paper I). If the quiet sun TR emission
under the filament (the background) is lower than the average, the PCTR
emission could be not negligible.
Heinzel et al. (2001) have shown that
the
optical depth of a given neutral hydrogen column density is
indeed much larger than the corresponding H optical depth, thus
making the filaments more extended in UV lines than in H.
optical depth, thus
making the filaments more extended in UV lines than in H.
The possibility that HeI (and HeII) absorption may also
affect the opacity of
lines with
 Å (
Å (
 Å) has been
recently considered by
Anzer & Heinzel (2005), who computed the continuum opacity for three
iron lines at
Å) has been
recently considered by
Anzer & Heinzel (2005), who computed the continuum opacity for three
iron lines at
 Å and 284 Å, assuming two
different values of the He first ionization degree,
Å and 284 Å, assuming two
different values of the He first ionization degree,
 .
however the results were almost insensitive to
this quantity.
.
however the results were almost insensitive to
this quantity.
Del Zanna et al. (2004, Paper II) have checked, on three analysed
filaments, how the HeI/HI abundance can influence the observed line
intensities. However, since no rigorous statistical procedure was
applied, these results cannot be considered a good quantitative
estimate of the above ratio.
In the present paper we will reconsider
three out of the four filaments previously analyzed to
quantitatively determine the HeI/HI ratio in these features.
In the next section the HI and HeI column densities will be derived
using a least squares method applied to the two prominence models
mentioned in Paper II: model A which assumes an isothermal cool gas in
the prominence with a TR all around it and model B in which the
prominence is made up of a number N of cool threads embedded in the
hot coronal plasma with a thin tube-like TR around each of them
(Chiuderi Drago et al. 1992, and references therein). A third
parameter will be determined from the least squares procedure, namely
the background emission in model A, for different values of the PCTR
emission and the the total PCTR emission in model B, where the
background emission is neglected.
In Sect. 3 we will compute the optical depth at the Lyman continuum
limit,
,
as derived from the two models and we will compare it
with previous observations (Schmieder et al. 2003) and with the
spectroscopic model of filaments proposed by Heinzel et al. (2003).
The filaments considered in the present paper are those listed in Table 1, namely the one analysed in Paper I (July 28, 1996 ) and two out of
the three analysed in Paper II.
Table 1:
CDS and SUMER files analysed in this study.
The filament observed on september 17, 1996, called F1 in Paper II,
appears not suitable for the present investigation since there are
only two data points that could supply information on the HeI
absorption with their wavelengths less than one angstrom apart, (MgVII
at 367.7 Å and MgIX at 368.0 Å), thus making impossible any reliable
fit at
Å.
The data analysis of the two filaments considered in Paper II was done
using different software than in Paper I, therefore, for the sake of
homogeneity we have repeated the analysis of the filament FP1 using the
same routines. For this reason the data shown in Paper I may appear different
from the present ones, in particular the number of lines analyzed here
is larger than for Paper I.
Let us first assume the isothermal cool prominence model with a PCTR
around it. This model assumes a loop-shaped prominence located well
above the chromosphere, therefore the background emission of the quiet
sun TR below the filament,
 ,
affects the observations and
must be taken into account.
,
affects the observations and
must be taken into account.
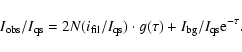
The ratio between the average intensitiy
of a given line observed above the filament,
 ,
and that of the same
line averaged on a portion of the quiet sun
,
and that of the same
line averaged on a portion of the quiet sun
 ,
selected on the same
raster, is given by:
,
selected on the same
raster, is given by:
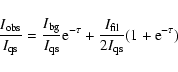 |
(1) |
where
 is the emission of the filament-corona TR at the top and
at the bottom of the filament which are assumed equal and
is the emission of the filament-corona TR at the top and
at the bottom of the filament which are assumed equal and  is the optical depth due to HI and HeI bound-free absorption.
In the above equation we have neglected the so-called "volume
blocking'' effect (Heinzel & Schmieder 2001), namely the lack of
emission from the volume occupied by the cool prominence gas. We think
that this factor, which is the dominant one in explaining the lower
intensity observed in coronal lines above filaments (see Paper I),
does not play an important role in Eq. (1), with respect to TR lines.
In the framework of model A, only the loop legs are located in
the TR while most of the prominence body lies in the
corona. Therefore, seen from above, the volume blocking of TR lines
affects a very small part of the filament area on which the line
intensities are averaged.
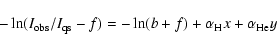
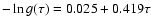
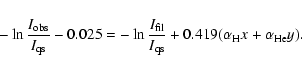
Taking the logarithm of the above equation, we get:
 |
(2) |
where
 and
and
 are the H and He bound
free absorption coefficients (see, for instance Gurzadian 1997), x and
y are the neutral H and He column densities,
are the H and He bound
free absorption coefficients (see, for instance Gurzadian 1997), x and
y are the neutral H and He column densities,
 and
and
 .
.
In the two previous papers it was assumed that
 ,
,
 and
and
 .
With these
assumptions, plotting
.
With these
assumptions, plotting
 vs.
vs.  ,
x and b were
derived from the slope and the intercept of the best fitting
line, respectively.
,
x and b were
derived from the slope and the intercept of the best fitting
line, respectively.
In the system of Eqs. (2) f cannot be determined
from the best fit procedure, but it must be given as a free
parameter. Then for each value of f, which has been varied from 0 to
0.2 in steps of 0.05 (
 ), a system of
 equations
in the three unknowns x, y and
equations
in the three unknowns x, y and
 can be solved using a
least squares method, provided that
can be solved using a
least squares method, provided that
 .
.
The filament FP1 was observed also by SUMER at
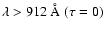 ,
supplying the value of b + 2f. Since
,
supplying the value of b + 2f. Since
 also for
 ,
the limit
of the fitting function for
must give the
same intensity ratios
observed by SUMER:
,
the limit
of the fitting function for
must give the
same intensity ratios
observed by SUMER:
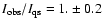 .
We have therefore
added to the data points a point at
.
We have therefore
added to the data points a point at
 having the same
intensity ratio
observed by SUMER. The results for the three analysed filaments are
shown in Table 2, where we have listed only the parameters obtained
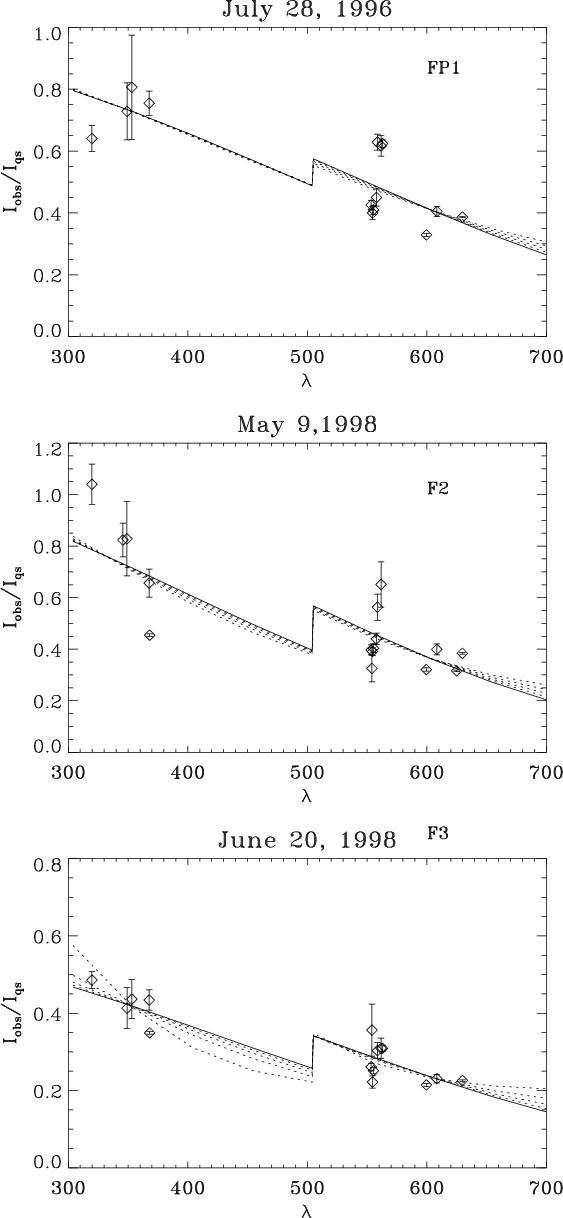
for f =0, 0.1 and 0.2. All curves are instead plotted in Fig. 1.
having the same
intensity ratio
observed by SUMER. The results for the three analysed filaments are
shown in Table 2, where we have listed only the parameters obtained
for f =0, 0.1 and 0.2. All curves are instead plotted in Fig. 1.
Table 2:
Fit parameters obtained for Model A: f and b are the PCTR
and the background intensity, relative to the quiet sun average intensity;
x and y are the HI and HeI column densities in units of 1017 cm-2.
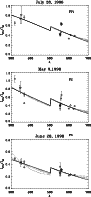 |
Figure 1:
Fit of the observed average ratios
 obtained with
model A: full line is computed assuming
obtained with
model A: full line is computed assuming
 ,
dotted
lines varying f from 0.05 to 0.2 in steps of 0.05. ,
dotted
lines varying f from 0.05 to 0.2 in steps of 0.05. |
| Open with DEXTER |
An inspection of Table 2 shows that the best fits (the lowest  values) are always obtained assuming f = 0. On the other hand, Fig. 1
shows that the fits obtained with different values of f are very
similar. The only parameter which shows a strong dependence on f is,
of course, the background emission b.
values) are always obtained assuming f = 0. On the other hand, Fig. 1
shows that the fits obtained with different values of f are very
similar. The only parameter which shows a strong dependence on f is,
of course, the background emission b.
Model B assumes a filament made up of N thin cool threads embedded in
the hot coronal plasma, each of which is surrounded by a tube-like
TR. With the assumption that the TR emission, if, and the optical
depth,  ,
are the same for each thread, the observed intensity ratio
(
)
is given by (see appendix of Paper II):
,
are the same for each thread, the observed intensity ratio
(
)
is given by (see appendix of Paper II):
 |
(3) |
 is the total PCTR
emission that would be observed, added to
,
for
is the total PCTR
emission that would be observed, added to
,
for  (
Å),
(
Å),
 is the total filament opacity
and
is the total filament opacity
and
 .
If we
assume that the cool threads are rooted in the chromosphere and that
there is no quiet sun TR under the prominence,
.
If we
assume that the cool threads are rooted in the chromosphere and that
there is no quiet sun TR under the prominence,
 ,
we may take
the logarithm of the above equation. Substituting
,
we may take
the logarithm of the above equation. Substituting
 with the
straight line of equation
with the
straight line of equation
 which,
in the range
which,
in the range
 ,
fits the curve with an accuracy better than 3 %
(see Fig. 2), we get:
,
fits the curve with an accuracy better than 3 %
(see Fig. 2), we get:
 |
(4) |
This system of
equations in the three unknowns
x, y and
 is very symilar to the
one previously solved with the
total PCTR emission replacing the background emission. The solutions
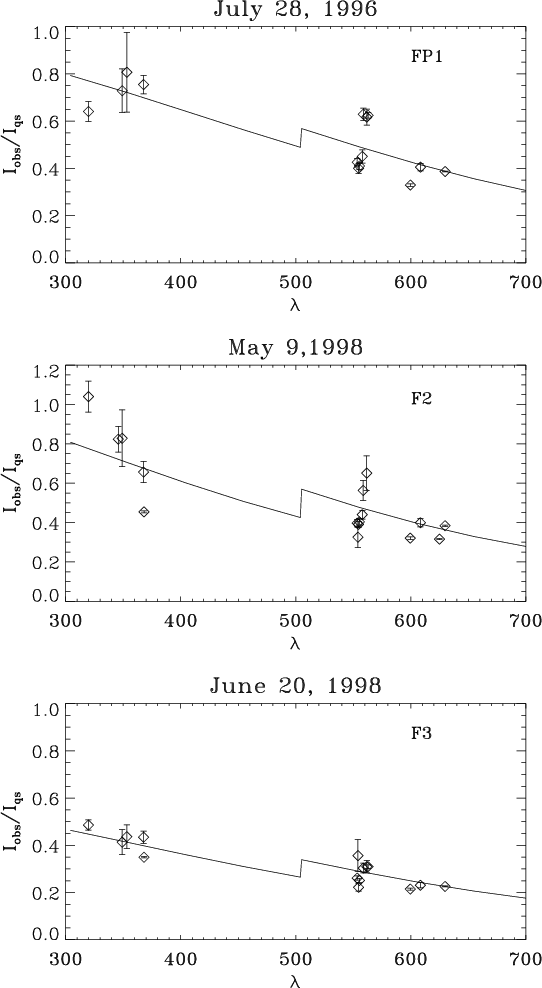
are listed in Table 3 and the data fits are shown in Fig. 3, where
the fitting lines are obtained using the exact expression of
is very symilar to the
one previously solved with the
total PCTR emission replacing the background emission. The solutions
are listed in Table 3 and the data fits are shown in Fig. 3, where
the fitting lines are obtained using the exact expression of
 .
.
 |
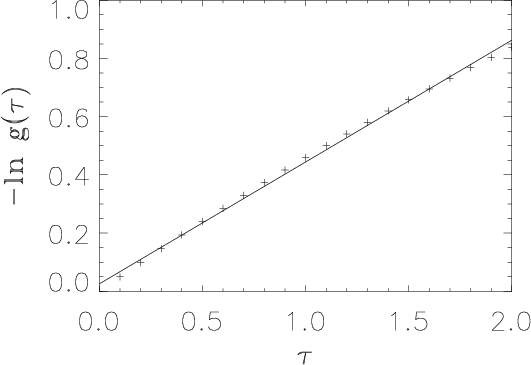
Figure 2:
Linear fit of
appearing in Eq. (3) (crosses)
with a straight line of equation
. |
| Open with DEXTER |
Table 3:
Fit parameters obtained for model B: x and y are
the HI and HeI column densities in units of 1017 cm-2.
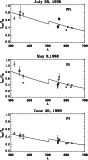 |
Figure 3:
Fit of the observed average ratios
obtained
with model B. |
| Open with DEXTER |
A comparison between the parameters derived with the two models shows
that:
- a)
- The values of the PCTR emission,
 ,
are very
similar to the values of
,
obtained with f=0 in
model A.
We want to recall that, in contrast to Model A, this value of f can be
observed only at
Å.
At shorter wavelengths the observed filament
emission is
,
are very
similar to the values of
,
obtained with f=0 in
model A.
We want to recall that, in contrast to Model A, this value of f can be
observed only at
Å.
At shorter wavelengths the observed filament
emission is
 .
The similarity of b (Model A) and
f (Model B)
is not surprising since these quantities represent, in both cases, the
constant term of the fit, namely the limit of
for
.
For
.
The similarity of b (Model A) and
f (Model B)
is not surprising since these quantities represent, in both cases, the
constant term of the fit, namely the limit of
for
.
For
 we have, with both
models:
we have, with both
models:
Therefore, if we put one of the two terms equal to zero, the constant
term of the fit supplies the other.
- b)
- The column densities derived
with model B are larger than those of model A by more than a factor of
two. This is due to the fact that in model A the background
absorption takes place all along the filament thickness, while in model B
each PCTR emission is absorbed only by the higher portion of the
filament.
- c)
- The two models supply about the same HeI/HI ratios, in
spite of the large differences in the column densities. This result
make us quite confident in the reliability of the derived HeI/HI
ratios.
The weakest aspect of model B is
the absence of a quiet sun TR under the filament, an assumption
adopted
for mathematical reasons, to allow derivation of a linear
relationship between the observations and the optical depth. In order
to check how this assumption could affects our results, we have solved
the system of
equations like Eq. (3) in the two unknowns f
and bfor different values of the HeI abundance and of the H-column density,
x, finding the following results. Both f and b depend very little on
the HeI/HI ratio, while they strongly depend on x. If we take for
instance the filament FP1, for which, according to SUMER observations,
f + b = 1, we see that, at the lowest value of
 ,
model B supplies f = 0.05 and b = 0.95, in very good agreement with model A.
For
,
model B supplies f = 0.05 and b = 0.95, in very good agreement with model A.
For
 the two parameters becomes equal, f=b=0.5, and,
for higher values of x,
the two parameters becomes equal, f=b=0.5, and,
for higher values of x,
 and
and
 .
Therefore, as already
mentioned in point a) above, the assumption that b = 0 in Model B does not
affect the main result of this paper, namely the HeI abundance, though
it does affect the derived HI-column density. A further check on this
quantity will be presented in the next section.
.
Therefore, as already
mentioned in point a) above, the assumption that b = 0 in Model B does not
affect the main result of this paper, namely the HeI abundance, though
it does affect the derived HI-column density. A further check on this
quantity will be presented in the next section.
From the results found in the previous section it appears that the
only real
differences between the fit parameters derived from the two models
are in the
column densities, which are much larger in model B than in model A.
A choice
between the two models can therefore be based only on this quantity.
From the HI column densities, derived with the two models, we have
computed the expected optical depth at the Lyman continuum limit,
 ,
which can be compared with previous observations of different filaments.
The values of
obtained with the two models are listed in
Table 4.
,
which can be compared with previous observations of different filaments.
The values of
obtained with the two models are listed in
Table 4.
Table 4:
obtained from the column densities listed in Table 2
(with f =0) and in Table 3.
We see that the average value of
 ,
found by Schmieder
et al. (2003),
falls in the ranges of
derived from model B.
Moreover only these latter
values of
appear to satisfy the requirements of the
spectroscopic model of Heinzel et al. (2003). According to these authors,
realistic values of the
height of the prominence lower and upper boundaries (h3 and h4) are
consistent with
,
found by Schmieder
et al. (2003),
falls in the ranges of
derived from model B.
Moreover only these latter
values of
appear to satisfy the requirements of the
spectroscopic model of Heinzel et al. (2003). According to these authors,
realistic values of the
height of the prominence lower and upper boundaries (h3 and h4) are
consistent with
 .
.
In this paper we have analysed TR lines observed in three different
filaments
by the CDS instrument onboard the SoHO satellite.
The main purpose of this
research was to check if the HeI/HI ratio in prominences varies
from one
feature to the other as suggested in Paper II. The determination done
in the present paper shows that in all filaments the HeI/HI ratio
varies from 0.05 to 0.08, independently of the assumed model.
In the assumption of thermodynamic equilibrium,
the HeI/HI ratio cannot be
lower than the He abundance, [He], since this would imply that the first
ionization potential of HeI is lower than that of HI. Let us assume
that the
He abundance in prominences is the same as in the low corona: if we take,
according to Gabriel et al. (1995),
![$[{\rm He}]=0.08$](/articles/aa/full/2005/45/aa3341-05/img70.gif) ,
this means that in solar
prominences both H and He are neutral (
i = j1 = j2 = 0 in Anzer &
Heinzel 2005, notations),
while assuming the Laming & Feldman (2001) low corona
abundance
,
this means that in solar
prominences both H and He are neutral (
i = j1 = j2 = 0 in Anzer &
Heinzel 2005, notations),
while assuming the Laming & Feldman (2001) low corona
abundance
![$[{\rm He}]=0.05$](/articles/aa/full/2005/45/aa3341-05/img71.gif) ,
we derive that in F2 and F3 i > j1 while in FP1
i = j1 = 0.
,
we derive that in F2 and F3 i > j1 while in FP1
i = j1 = 0.
This would therefore imply that all prominences have about
the same temperature, T < 104, if
is assumed,
while
could suggest that F2 and F3 have a temperature higher
(
 K )
than FP1 (T < 104). However, according to Anzer & Heinzel (2005),
the
ionization rates of both H and He in prominences are strongly affected by
other factors besides the temperature, therefore we cannot make any safe
speculation on the prominence temperature.
K )
than FP1 (T < 104). However, according to Anzer & Heinzel (2005),
the
ionization rates of both H and He in prominences are strongly affected by
other factors besides the temperature, therefore we cannot make any safe
speculation on the prominence temperature.
Another interesting result presented in this paper is the
determination of optical depth of the filaments at the
limit,
using the HI
column densities as derived from the two models, A and B. The comparison
of these results with previous determination (Schmieder et al. 2003)
and mostly with the requirements of the spectroscopic model of
Heinzel et al. (2003) indicates that only model B can supply values in
agreement with the above findings.
The measurement of the volume blocking of coronal
lines in FP1, given in Paper I, was also unambiguously in
favor of model B.
As already mentioned, the volume blocking, which we argued not to be very
important for TR lines, becomes the most important factor for the
reduced intensity
observed above filaments in coronal lines. For these
lines the Lyman
absorption is not very important since it affects only the
radiation coming
from the coronal slab under the filament. The missing volume of
hot coronal
plasma is instead very large. Thus it is much larger in model A,
where it is
equal to the total prominence volume, than in model B,
where it reduces to
the volume of the cool threads plus that of the tube-like PCTR.
It appears therefore straightforward to discriminate between the
two models
A and B from coronal lines. Moreover we suggest that the
"weakest point'' of
model B mentioned above, namely the absence of the quiet sun TR under the
filament, does not affect the coronal lines. We propose to extend the
calculation of the volume blocking using coronal lines to the other
three filaments in a forthcoming paper.
Acknowledgements
SOHO is a project of international cooperation between ESA and NASA.
The author is indebted to G. Del Zanna for providing her with his routines
for CDS data reduction and to C. Chiuderi and S. Parenti for helpful
discussion and suggestion. She wishes moreover to thank the unknown referee
for the useful comments and remarks to the paper.
- Anzer, U., &
Heinzel, P. 2005, ApJ, 622, 721 [NASA ADS] (In the text)
- Chiuderi Drago,
F., Engvold, O., & Jensen, E. 1992, Sol. Phys. 139, 47
(In the text)
- Chiuderi Drago,
F., Alissandrakis, C. E., Bastian, et al. 2001, Sol. Phys. 199, 115
(Paper I)
(In the text)
- Del Zanna, G.,
Chiuderi Drago, F., & Parenti, S. 2004, A&A, 420, 307 [EDP Sciences] [NASA ADS] [CrossRef]
(Paper II)
(In the text)
- Gabriel, A. H.,
Culhane, J. L., Patchett, B. E., et al. 1995, Adv. Sp. Res., 15,
63 [NASA ADS] (In the text)
- Gurzadian, G.
H. 1997, Physics and Dynamics of Planetary Nebulae
(Springer-Verlag), 48
(In the text)
- Heinzel, P.,
Schmieder, B., & Tziotziou, K. 2001, ApJ, 561, L223 [NASA ADS] [CrossRef] (In the text)
- Heinzel, P.,
Anzer, U., & Schmieder, B. 2003, Sol. Phys., 216, 159 [NASA ADS] [CrossRef] (In the text)
- Laming, J., M.,
& Feldman, U. 2001, ApJ, 546, 552 [NASA ADS] [CrossRef] (In the text)
- Schmieder, B.,
Tziotziou, K., & Heinzel, P. 2003, A&A, 401, 361 [EDP Sciences] [NASA ADS] (In the text)
Copyright ESO 2005