A&A 443, 347-355 (2005)
DOI: 10.1051/0004-6361:20053862
T. G. Müller1 - T. Sekiguchi2 - M. Kaasalainen3 - M. Abe4 - S. Hasegawa4
1 - Max-Planck-Institut für extraterrestrische Physik,
Giessenbachstraße, 85748 Garching, Germany
2 -
National Astronomical Observatory of Japan, 2-21-1 Osawa, Mitaka, Tokyo 181-8588, Japan
3 -
Department of mathematics and statistics,
Gustaf Hallstromin katu 2b, PO Box 68,
00014 University of Helsinki, Finland
4 -
Institute of Space and Astronautical Science,
Japan Aerospace Exploration Agency,
3-1-1 Yoshinodai, Sagamihara, Kanagawa 229-8510, Japan
Received 20 July 2005 / Accepted 29 August 2005
Abstract
We obtained N- and Q-band observations of the Apollo-type asteroid
25143 Itokawa during its close Earth approach in July 2004 with
TIMMI2 at the ESO 3.6 m telescope. Our photometric measurement, in
combination with already published data, allowed
us to derive a radiometric effective diameter of
![]() km
and an albedo of 0.19
+0.11-0.03 through a thermophysical model.
This effective diameter corresponds to a slightly asymmetrical
and flattened ellipsoid of the approximate size of
520(
km
and an albedo of 0.19
+0.11-0.03 through a thermophysical model.
This effective diameter corresponds to a slightly asymmetrical
and flattened ellipsoid of the approximate size of
520(![]() 50)
50) ![]() 270(
270(![]() 30)
30) ![]() 230(
230(![]() 20) m, based
on the Kaasalainen et al. (2005,
Proceedings of the 1st Hayabusa Symposium,
ASP Conf. Ser., submitted) shape model.
Our studies show that the thermal observations lead to size
estimates which are about 15% smaller than the radar
results (Ostro et al. 2005, Met. Plan. Sci., submitted), slightly outside
the stated radar uncertainties of
20) m, based
on the Kaasalainen et al. (2005,
Proceedings of the 1st Hayabusa Symposium,
ASP Conf. Ser., submitted) shape model.
Our studies show that the thermal observations lead to size
estimates which are about 15% smaller than the radar
results (Ostro et al. 2005, Met. Plan. Sci., submitted), slightly outside
the stated radar uncertainties of ![]() 10%.
We determined a rather high thermal inertia of 750 J m-2 s-0.5 K-1. This is an indication
for a bare rock dominated surface, a thick dust regolith can be
excluded as well as a metallic surface.
From our data we constructed a 10.0
10%.
We determined a rather high thermal inertia of 750 J m-2 s-0.5 K-1. This is an indication
for a bare rock dominated surface, a thick dust regolith can be
excluded as well as a metallic surface.
From our data we constructed a 10.0 ![]() m thermal
lightcurve which is nicely matched in amplitude and phase
by the shape and spin vector solution in combination with
our TPM description.
The assumed S-type bulk density in combination with radiometric
size lead to a total mass estimate of
m thermal
lightcurve which is nicely matched in amplitude and phase
by the shape and spin vector solution in combination with
our TPM description.
The assumed S-type bulk density in combination with radiometric
size lead to a total mass estimate of
![]() kg.
kg.
Key words: minor planets, asteroids - radiation mechanisms: thermal - infrared: solar system
The Near-Earth asteroid (NEA) 25143 Itokawa (1998 SF36) is the target for the Japanese Hayabusa (MUSES-C) sample return mission. The spacecraft will arrive at the asteroid in summer 2005 and hover close to the surface for about 3 months before it will collect surface samples which will be brought back to Earth in June 2007.
Several ground-based observing campaigns
took place during the last years to derive various properties
of Itokawa. E.g., Binzel et al. (2001) concluded from
visible and near-infrared spectroscopic measurements that
the spectral characteristics (S(IV)-type) match the LL ordinary
chondrite class meteorites. Ostro et al. (2004, 2005)
report on delay-Doppler images obtained at Arecibo and Goldstone,
resulting in size, shape, radaralbedo and surface roughness
estimates. Kaasalainen et al. (2003, 2005)
determined through lightcurve inversion techniques a high quality
shape and pole solution together with a period of
![]() h.
Sekiguchi et al. (2003) observed Itokawa
at thermal infrared wavelengths and used the powerful radiometric
technique (e.g. Harris & Lagerros 2002) to determine
a size of
h.
Sekiguchi et al. (2003) observed Itokawa
at thermal infrared wavelengths and used the powerful radiometric
technique (e.g. Harris & Lagerros 2002) to determine
a size of
![]() km and an albedo of 0.23(+0.07, -0.05).
Müller et al. (2004) reported on thermal property
studies of Itokawa based on multi-epoch thermal infrared
photometric data. But their data set did not allow to find
a unique solution for the size, thermal inertia and roughness.
Based on the radar size, they derived a thermal inertia between 5 and 10 times that of the Moon.
km and an albedo of 0.23(+0.07, -0.05).
Müller et al. (2004) reported on thermal property
studies of Itokawa based on multi-epoch thermal infrared
photometric data. But their data set did not allow to find
a unique solution for the size, thermal inertia and roughness.
Based on the radar size, they derived a thermal inertia between 5 and 10 times that of the Moon.
Here, we used all available thermal infrared data together with own observations, taken during a close approach in July 2004 (Sect. 2). The modelling and the derivation of thermophysical properties of Itokawa was then performed through the well-established, tested and frequently used thermophysical model (TPM) by Lagerros (1996, 1997, 1998; see Sects. 3-5). The results are discussed in the context of the already known properties of Itokawa (Sect. 6) and conclusions are drawn in Sect. 7.
Table 1: Summary of TIMMI2 observations of asteroid 25143 Itokawa. The phase angles are positive before opposition and negative after. We added data from Sekiguchi et al. (2003) and Delbo (2004).
We combined the observations from Sekiguchi et al. (2003) (data set #1 in Table 1), with the data set from Delbo (2004) (data set #2), and our own observations (data set #3). All measurements were taken with the TIMMI2 instrument (Käufl et al. 2003) at the ESO La Silla 3.6 m telescope. Table 1 summarises the observing geometries for all 20 measurements.
A standard chopping and nodding technique was utilized for all
observations to reduce the atmospheric and telescope background
emission. Chop and nod throws were 10
![]() ,
respectively. For the imaging observations, a pixel scale of 0.2
,
respectively. For the imaging observations, a pixel scale of 0.2
![]() was chosen, and on source integration
times were 22 min (obs #1), 10-13 min (obs #2 to #11),
7.5 min (obs #12 to #19), and 25 min (obs #20).
was chosen, and on source integration
times were 22 min (obs #1), 10-13 min (obs #2 to #11),
7.5 min (obs #12 to #19), and 25 min (obs #20).
Both already published data sets, from Sekiguchi et al. (2003) and from Delbo (2004), were re-calibrated using the official central filter wavelengths in combination with the flux densities of the corresponding stellar models (see Table 2).
A more detailed data reduction and calibration was performed on
our own data set. Unfortunately, the telescope tracking on
25143 Itokawa was not perfect in the 2004 observing run. This
had the consequence that the pipeline-reduced images showed elongated
sources (see left side of Fig. 1).
Therefore, we took the raw images and processed them in
a pipeline-like manner together with a fixed
![]() rate of
typically 0.5 to 1.0 pixels/min. A centroid determination in
combination with a standard shift-and-add technique was not possible
due to the faint sources which are not always visible on individual
raw frames. The results of this process are illustrated on the right
side of Fig. 1.
rate of
typically 0.5 to 1.0 pixels/min. A centroid determination in
combination with a standard shift-and-add technique was not possible
due to the faint sources which are not always visible on individual
raw frames. The results of this process are illustrated on the right
side of Fig. 1.
Table 2: Monochromatic flux densities in [Jy] of the stellar calibrators at the TIMMI2 central filter wavelengths. Note: The key wavelengths were taken from http://www.ls.eso.org/lasilla/sciops/3p6/timmi/Filters. The model fluxes were taken from http://www.iso.vilspa.esa.es/users/expl_lib/ISO/wwwcal/isoprep/cohen/templates/ and interpolated to the central filter wavelengths.
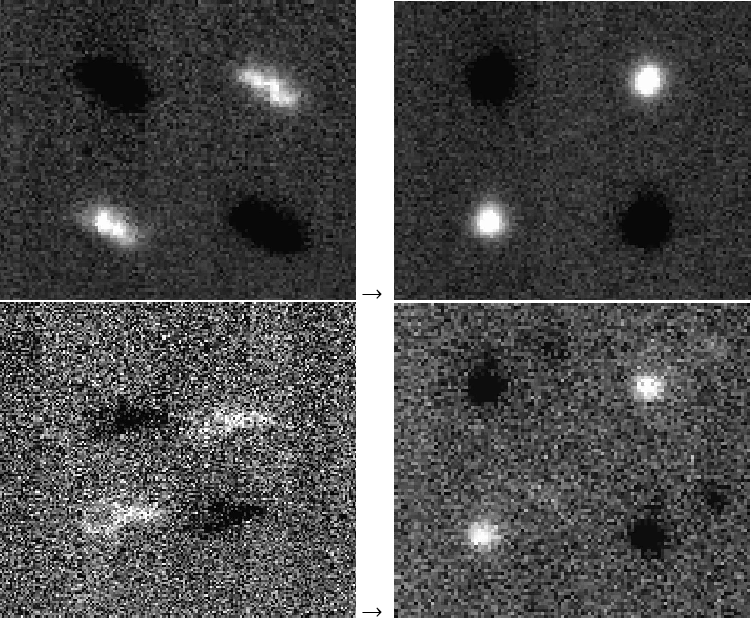 |
Figure 1: Pipeline-processing in comparison with re-reduced asteroid images. Top: Itokawa measurement #12 (Table 1), N1-filter, 7.5 min integration time, left: pipeline-product, right: the 60 raw images were shifted by 1.0 pixels per minute in x-direction and by -1.0 pixels per minute in y-direction and then co-added. Bottom: Itokawa measurement #20 (Table 1), Q1-filter, 25.8 min integration time, left: pipeline-product, right: the 234 raw images were shifted by 0.8 pixels per minute in x-direction and by 0.2 pixels per minute in y-direction and then co-added. |
| Open with DEXTER | |
We applied standard aperture photometry on the tracking corrected images with same apertures on the stars and asteroids. The aperture radii were chosen with respect to the growth curves (for details see e.g. Delbo 2004). All four on-array signatures of the sources were used for the flux calibration. Colour differences between stars and 25143 Itokawa were negligible (about 1-3%) for the used filters in combination with the atmospheric transmission at La Silla (http://www.ls.eso.org/lasilla/sciops/3p6/timmi/html/AtmosphericTransm.html).
The observational results are summarised in Table 3.
Table 3:
Summary of TIMMI2 observational results for asteroid 25143 Itokawa.
Note: The Sekiguchi et al. (2003) and Delbo (2004)
fluxes and errors have been recalculated for the true central
filter wavelengths, using the corresponding stellar fluxes.
Measurements from April 9, 2001 (marked with ![]() )
were taken
under less favorable conditions in comparison with data from
April 8 (M. Delbo, priv. comm.). Our new observations are listed
under #12 until #20.
)
were taken
under less favorable conditions in comparison with data from
April 8 (M. Delbo, priv. comm.). Our new observations are listed
under #12 until #20.
The error values of observations #12 to #20 include the uncertainties of the calibration star models (3% in N-band and 4% in Q-band), the aperture photometry error (N1: 3%, N2: 2%, N12.9: 2%, Q1: 10-20%) and an error for the flat-field residuals (about 3-6% in N and about 10-15% for Q-band, depending on the relative placement of the calibrator and the asteroid on the TIMMI2 array). The error calculations of observations #1 to #11 are described in the corresponding references.
We applied the TPM by Lagerros
(1996, 1997, 1998)
to all 20 measurements from Table 3 to investigate
the physical and thermal properties of Itokawa.
On the large scale, the TPM considers the asteroid size, the global
shape and spin vector and the actual observing and illumination
geometry at the time of an observation. On the small micrometer
scale, the TPM takes into account the
reflected, absorbed and emitted energy, and also the heat
conduction into the surface regolith. The albedo and emissivity
control the energy balance and thereby the surface temperature.
The thermal inertia in combination with the rotation period and
the orientation of the spin vector influence the diurnal temperature
variations. As a result, the thermal inertia is strongly connected
to the interpretation of mid-IR observations, namely when comparing
before and after opposition observations at large phase angles with
very different temperatures of the terminator.
Moreover, the thermal inertia determines the
amplitude of the thermal lightcurve for a given aspect angle.
The TPM beaming model,
described by ![]() ,
the rms of the surface slopes and f,
the fraction of the surface covered by craters, accounts for the
non-isotropic heat radiation, noticeable at phase angles close
to opposition. But it also influences
the shape of the spectral energy distribution in the mid-IR. Detailed
considerations of the
,
the rms of the surface slopes and f,
the fraction of the surface covered by craters, accounts for the
non-isotropic heat radiation, noticeable at phase angles close
to opposition. But it also influences
the shape of the spectral energy distribution in the mid-IR. Detailed
considerations of the ![]() ,
,
![]() and f influences
for various observing geometries and wavelengths are discussed
in e.g., Müller (2002) or Dotto et al. (2000).
and f influences
for various observing geometries and wavelengths are discussed
in e.g., Müller (2002) or Dotto et al. (2000).
An
![]() -value of 19.9 (Kaasalainen et al. 2003;
M. Abe, priv. comm.; Sekiguchi et al. 2003) and a
G-value of 0.21 (Abe et al. 2002a,b) was used
to describe the visual brightness of Itokawa.
We assumed a constant emissivity of 0.9 at all wavelength.
-value of 19.9 (Kaasalainen et al. 2003;
M. Abe, priv. comm.; Sekiguchi et al. 2003) and a
G-value of 0.21 (Abe et al. 2002a,b) was used
to describe the visual brightness of Itokawa.
We assumed a constant emissivity of 0.9 at all wavelength.
 |
Figure 2: Equatorial edge-on ( top) and pole-on ( bottom) images of the shape model. |
| Open with DEXTER | |
The shape-model used here (Kaasalainen et al. 2005)
is an update and refinement of the model presented in Kaasalainen
et al. (2003). The model accommodates
new photometric observations from December 2003 to September 2004,
as well as some 2001 data additional to the 2000-2001 apparition
dataset presented in Kaasalainen et al. (2003).
The long time-line of the updated dataset allowed accurate
period determination for Itokawa, and a refined pole and shape
estimate.
All parts of Itokawa's surface were well visible during the two
apparitions; however, the long period precluded fully covered rotational
phases for single lightcurves.
Calibrated photometry allowed the determination of Itokawa's
solar phase curve for a wide range of solar phase angles. The refined
rotation parameters are
![]() ,
,
![]() for the ecliptic latitude and longitude of
the pole, and
for the ecliptic latitude and longitude of
the pole, and
![]() h for the sidereal period.
Figure 2 shows equatorial edge-on and pole-on images
of the shape model. The model agrees well with the radar-based
one (Ostro et al. 2005).
h for the sidereal period.
Figure 2 shows equatorial edge-on and pole-on images
of the shape model. The model agrees well with the radar-based
one (Ostro et al. 2005).
Our data set is very homogenous with respect to the used instrument
settings, observing technique, data reduction and calibration scheme.
The data cover a wide range of
different observing geometries, including before and after
opposition, at different wavelengths and rotational phases.
Therefore, it was possible to adjust the thermal inertia and
beaming parameters to see how these variations influence the calculation
of the radiometric diameter and albedo solutions.
The investigations of the resulting diameters and albedos give clues about
the optimal model parameters. Only specific model parameters will allow
that e.g. the data taken at very different phase angles before and after
opposition will result in the same radiometric diameter and albedo solutions.
Another quality criteria is that the resulting diameter and albedo values
show no trends with wavelengths or rotational phase.
The goal was to find the best diameter/albedo solution with the smallest
standard deviations which fits all 20 measurements.
A similar procedure was already used by Müller & Lagerros (1998,
2002)
for several main-belt asteroids. For large, regolith covered asteroids,
the least-square process gave typical thermal inertias of 10-15 J m-2 s-0.5 K-1 and beaming parameters of ![]() and f=0.6 (Müller et al. 1999).
and f=0.6 (Müller et al. 1999).
As a first step, we tried to find out how the thermal inertia
influences the determination of the radiometric
diameter/albedo solutions. For observations taken at very large phase
angles the thermal inertia is the most important parameter for
a consistent diameter and albedo determination. This is due to the
non-zero temperature of the large terminator which contributes
significantly to the disk-integrated flux.
The thermal inertia ![]() was varied in a physically meaningful range between 0 and 2500 J m-2 s-0.5 K-1. Where
was varied in a physically meaningful range between 0 and 2500 J m-2 s-0.5 K-1. Where ![]() describes
a surface in instantaneous equilibrium without any thermal conduction
into the sub-surface, while
describes
a surface in instantaneous equilibrium without any thermal conduction
into the sub-surface, while
![]() J m-2 s-0.5 K-1 corresponds to a highly
conductive solid granite surface without any dust regolith. The Moon, with
it thick highly insulating dust layer, has a thermal inertia of 39 J m-2 s-0.5 K-1 (Keihm 1984).
J m-2 s-0.5 K-1 corresponds to a highly
conductive solid granite surface without any dust regolith. The Moon, with
it thick highly insulating dust layer, has a thermal inertia of 39 J m-2 s-0.5 K-1 (Keihm 1984).
This wide range of thermal inertias has no big impact on the
resulting weighted mean diameter and albedo values: A ![]() would give weighted mean values of
would give weighted mean values of
![]() km and
km and
![]() ,
while a
,
while a
![]() would give
would give
![]() km and
km and
![]() .
But the standard deviation of the 20 diameter (or albedo) values
changes enormously (more than a factor of 2)
for different thermal inertias.
Figures 3 and 4
illustrate this effect on basis
of the
.
But the standard deviation of the 20 diameter (or albedo) values
changes enormously (more than a factor of 2)
for different thermal inertias.
Figures 3 and 4
illustrate this effect on basis
of the
![]() and
and
![]() values. A thermal inertia of
values. A thermal inertia of
![]() J m-2 s-0.5 K-1 would therefore give
the best match with our complete observational data set
(dashed lines).
We repeated the whole optimisation process with the highest
quality data only (excluding the data from April, 9th, 2001,
M. Delbo, priv. comm.). The resulting best thermal inertia
would then be at around 750 J m-2 s-0.5 K-1 (solid line). A last robustness check with only 9 observations (dotted line) confirmed this solution.
J m-2 s-0.5 K-1 would therefore give
the best match with our complete observational data set
(dashed lines).
We repeated the whole optimisation process with the highest
quality data only (excluding the data from April, 9th, 2001,
M. Delbo, priv. comm.). The resulting best thermal inertia
would then be at around 750 J m-2 s-0.5 K-1 (solid line). A last robustness check with only 9 observations (dotted line) confirmed this solution.
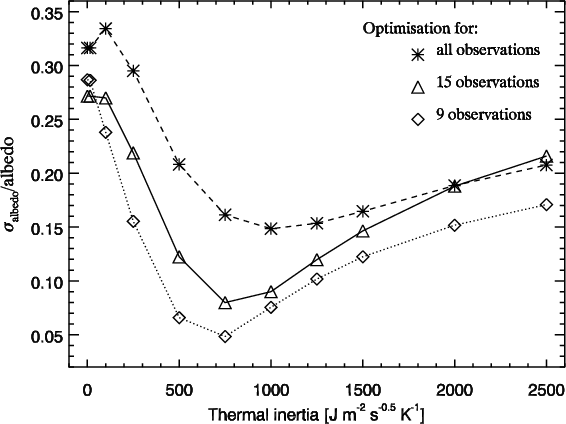 |
Figure 3: Thermal inertia optimisation process for the individual TPM albedos and their standard deviation, using all 20 individual observations (dashed line), a subset with 15 observations (solid line) and a subset of 9 observations (dotted line). |
| Open with DEXTER | |
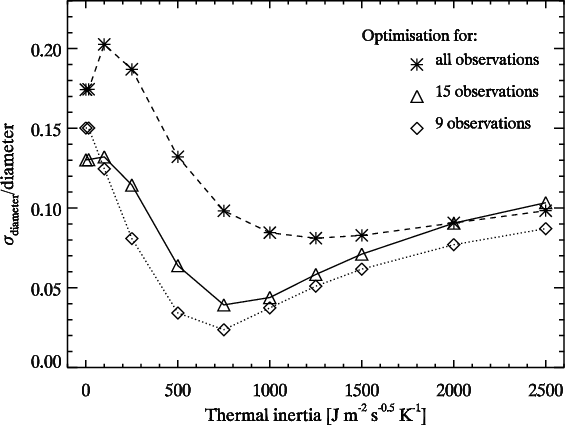 |
Figure 4: Thermal inertia optimisation process for the individual TPM diameters and their standard deviation, using all 20 individual observations (dashed line), a subset with 15 observations (solid line) and a subset of 9 observations (dotted line). |
| Open with DEXTER | |
In a second iteration, we tested the beaming model, parameterised
by ![]() ,
the rms of the
surface slopes, and f, the fraction of surface covered by craters.
Both parameters were kept variable between 0.1 and 0.9 (see also Dotto et al. 2000).
However, the effects with
,
the rms of the
surface slopes, and f, the fraction of surface covered by craters.
Both parameters were kept variable between 0.1 and 0.9 (see also Dotto et al. 2000).
However, the effects with ![]() and f are not as dramatic, mainly
because most of our observations were taken at large phase
angles where the beaming does not play an important role.
We could not find a clear minimum in the
and f are not as dramatic, mainly
because most of our observations were taken at large phase
angles where the beaming does not play an important role.
We could not find a clear minimum in the
![]() values in the
values in the ![]() plane. Some good solutions disappeared
again when we checked for robustness by using various subsets
of the observational data. As a conclusion from all optimisation
runs we can only say that the very smallest values (0.1-0.3)
are very unlikely for the beaming parameters
plane. Some good solutions disappeared
again when we checked for robustness by using various subsets
of the observational data. As a conclusion from all optimisation
runs we can only say that the very smallest values (0.1-0.3)
are very unlikely for the beaming parameters ![]() and f for Itokawa, all other values still seem to be in
agreement with our data set. We accepted therefore the default
beaming values,
and f for Itokawa, all other values still seem to be in
agreement with our data set. We accepted therefore the default
beaming values, ![]() and f=0.6, which were derived
for main-belt asteroids (Müller et al. 1999).
and f=0.6, which were derived
for main-belt asteroids (Müller et al. 1999).
As result of this optimisation process we accepted the following values:
| = | 750 | J m-2 s-0.5 K-1, thermal inertia | |
| = | 0.7 | rms of the surface slopes | |
| f | = | 0.6 | fraction of surface covered by craters. |
|
|
= | 0.32 |
|
|
= | 0.19 |
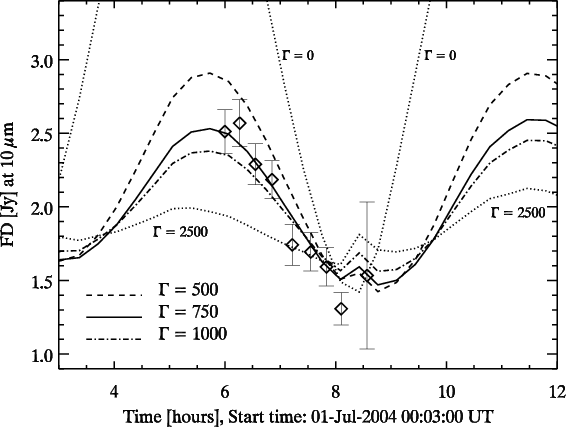 |
Figure 5:
Predicted thermal lightcurve at 10.0 |
| Open with DEXTER | |
Figure 5 confirms that the thermal
inertia has to be somewhere in the range between 500 and 1000 J m-2 s-0.5 K-1. It also demonstrates that
the implementation of the shape model in combination with
the spin vector and zero points in time and phase yields
consistent results. Our observational data cover the
rotational phases between 354.9![]() (14-Mar.-2001 05:50:00 UT)
and 71.1
(14-Mar.-2001 05:50:00 UT)
and 71.1![]() (01-Jul.-2004 08:37:00 UT).
(01-Jul.-2004 08:37:00 UT).
All optimisation steps work well under the assumption that the shape and spin vector solutions are of good quality and that the albedo is the same all over the asteroid surface, e.g. for large main-belt asteroids which have almost spherical shapes with a very homogeneous albedo distribution due to a thick dust regolith. The shape model of Itokawa matches the visual lightcurves taken at very large range of phase angles and different observing and illumination geometries (Kaasalainen et al. 2005). Kaasalainen et al. (2003) detected no significant albedo variegations. Thus, both prerequisites are fulfilled and it was for the first time possible to extract thermal properties for such an elongated object. So far, this was only possible for large main-belt asteroids (e.g. Spencer et al. 1989; Müller & Lagerros 1998) and a few NEAs (e.g. Harris & Davies 1999) with almost spherical shapes where the radiometric diameter/albedo solutions were not affected too much by shape effects or albedo deviations at certain epochs.
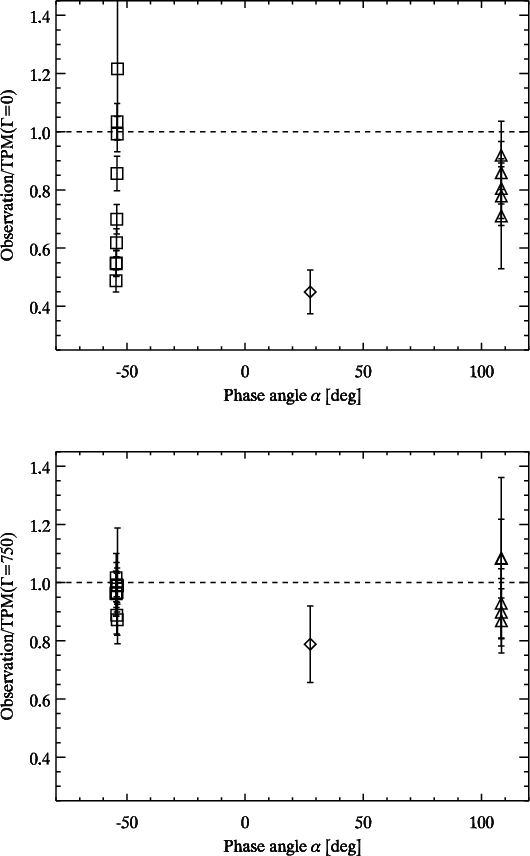 |
Figure 6: The observation/TPM ratios for a thermal inertia of 0 ( top) and 750 ( bottom). The high thermal inertia values eliminate the trend with phase angle and reduce the scatter significantly. |
| Open with DEXTER | |
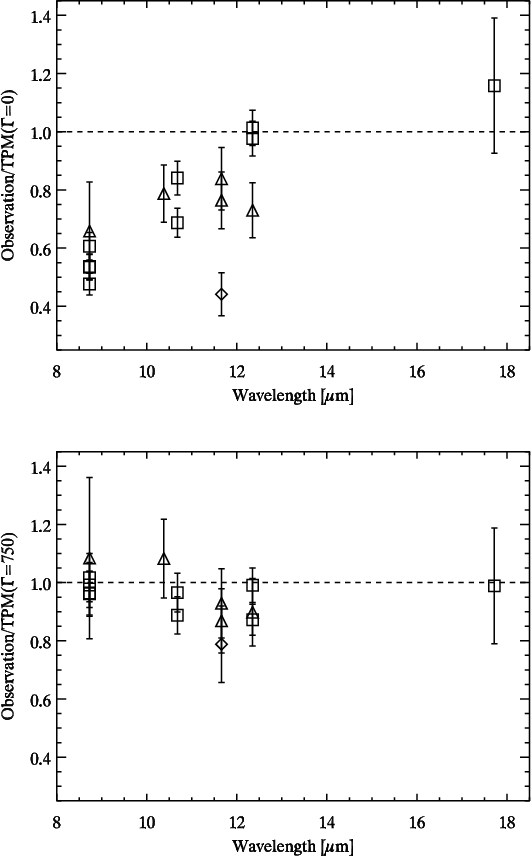 |
Figure 7: The observation/TPM ratios for a thermal inertia of 0 ( top) and 750 ( bottom). The high thermal inertia values eliminate the trend with wavelength and reduce the scatter significantly. |
| Open with DEXTER | |
Another key element for a successful derivation of thermal parameters is the wavelength and phase angle coverage of the observational data set. In order to separate beaming and thermal inertia effects, it is necessary to have equal quality data at different phase angles. An often used indicator for reasonable model assumptions is the ratio plot "observation/model prediction'' (e.g. Müller & Blommaert 2004).
Figure 6 shows this "obs/mod''-ratio plot
for the phase angles. Asymmetries in
the phase angle plot (see Fig. 6, top) confirm
the retrograde sense of rotation (see e.g. Müller 2002 for
further discussions) and show that the
terminator has very different temperatures before (
![]() )
and after opposition (
)
and after opposition (
![]() ),
resulting in a poor modelling (large scatter) in the after opposition
ratios.
The TPM requires therefore a higher thermal inertia to match the
observed fluxes (Fig. 6, bottom) and to eliminate
the phase angle asymmetry.
),
resulting in a poor modelling (large scatter) in the after opposition
ratios.
The TPM requires therefore a higher thermal inertia to match the
observed fluxes (Fig. 6, bottom) and to eliminate
the phase angle asymmetry.
Figure 7 shows how the "obs/mod''-ratio
varies with wavelengths. In case of a low thermal inertia (top),
one can clearly see a trend of the ratio with wavelength.
For the
![]() -case, the scatter of the data points
is much smaller and the trend with wavelength disappeared.
Note, that the data points, which are considered
to be less reliable (Delbo, priv. comm.), are not shown for clarity
reasons.
-case, the scatter of the data points
is much smaller and the trend with wavelength disappeared.
Note, that the data points, which are considered
to be less reliable (Delbo, priv. comm.), are not shown for clarity
reasons.
Our derived albedo of
![]() fits nicely within
the established S-type albedo range of
fits nicely within
the established S-type albedo range of
![]() (Ishiguro et al. 2003). But this albedo value is strongly connected to
the
(Ishiguro et al. 2003). But this albedo value is strongly connected to
the
![]() -value of 19.9 mag. A change of 0.1 mag in
-value of 19.9 mag. A change of 0.1 mag in
![]() to 19.8 mag
would increase the radiometric albedo by about 0.02, while the effective
diameter would remain practically unchanged. Even very large modifications
of the
to 19.8 mag
would increase the radiometric albedo by about 0.02, while the effective
diameter would remain practically unchanged. Even very large modifications
of the
![]() -value by e.g., 0.5 mag to
-value by e.g., 0.5 mag to
![]() mag
(
mag
(
![]() mag from Nishihara et al. 2005 and
(V-R) = 0.4 mag from Lowry et al. 2005) would
lead to a marginally increased
mag from Nishihara et al. 2005 and
(V-R) = 0.4 mag from Lowry et al. 2005) would
lead to a marginally increased
![]() km.
But in this case, the directly connected
albedo would increase to
km.
But in this case, the directly connected
albedo would increase to
![]() .
Based on these considerations,
we give a final solution of
.
Based on these considerations,
we give a final solution of
![]() to account
for the different published
to account
for the different published
![]() values.
This shows that the size determination is closely coupled to the quality
of the thermal photometry, while the albedo depends much more on the
properties from the reflected light analysis, i.e., the values
in the H-G magnitude system. It should also be noted here that
the H-G concept is a badly defined convention for irregular bodies.
The
values.
This shows that the size determination is closely coupled to the quality
of the thermal photometry, while the albedo depends much more on the
properties from the reflected light analysis, i.e., the values
in the H-G magnitude system. It should also be noted here that
the H-G concept is a badly defined convention for irregular bodies.
The
![]() mag is the best possible solution in the context
of the Kaasalainen et al. (2005) shape model.
Nishihara et al. (2005)
also determined a larger G-value of 0.25 (instead of the 0.21 used here).
But this difference would no be noticeable in the radiometric results.
We also checked the robustness of our
mag is the best possible solution in the context
of the Kaasalainen et al. (2005) shape model.
Nishihara et al. (2005)
also determined a larger G-value of 0.25 (instead of the 0.21 used here).
But this difference would no be noticeable in the radiometric results.
We also checked the robustness of our ![]() -solution against uncertainties
in the H-G values. But taking the Nishihara et al. (2005)
H-G values (H = 19.4 mag, G = 0.25) leads to the same, very pronounced
minimum at around 750 J m-2 s-0.5 K-1 in the
-solution against uncertainties
in the H-G values. But taking the Nishihara et al. (2005)
H-G values (H = 19.4 mag, G = 0.25) leads to the same, very pronounced
minimum at around 750 J m-2 s-0.5 K-1 in the
![]() picture
(see Fig. 3).
picture
(see Fig. 3).
The derived radiometric value
![]() is the diameter
of an equal volume sphere, based on the Kaasalainen-shape and spin-vector
model. A rotating ellipsoid approximation can be described by
the absolute sizes 2a, 2b and 2c, corresponding roughly to
the x-, y- and z-dimensions of Fig. 2 (longest
extension, hight in bottom and hight in top image):
is the diameter
of an equal volume sphere, based on the Kaasalainen-shape and spin-vector
model. A rotating ellipsoid approximation can be described by
the absolute sizes 2a, 2b and 2c, corresponding roughly to
the x-, y- and z-dimensions of Fig. 2 (longest
extension, hight in bottom and hight in top image):
The radar observations (Ostro et al. 2005) resulted
in a size estimate of
![]() m (
m (![]() 10%),
based on the same lightcurve-based spin vector by Kaasalainen
et al. (2005). The axis ratios of the lightcurve and
radar shape models agree and have approximate values of a/b=1.9 and b/c=1.1
10%),
based on the same lightcurve-based spin vector by Kaasalainen
et al. (2005). The axis ratios of the lightcurve and
radar shape models agree and have approximate values of a/b=1.9 and b/c=1.1![]() . But the effective diameter
. But the effective diameter
![]() of the radar solution is about 15% higher. We tried to use the
radar effective
diameter of about 0.38 km to fit the observed highest quality
data from July 1, 2004. Only with very unrealistic assumptions
of
of the radar solution is about 15% higher. We tried to use the
radar effective
diameter of about 0.38 km to fit the observed highest quality
data from July 1, 2004. Only with very unrealistic assumptions
of
![]() and a thermal inertia
and a thermal inertia
![]() J m-2 s-0.5 K-1 the TPM predictions would provide an acceptable match with
the observed fluxes. Taking the stated radar uncertainty
of
J m-2 s-0.5 K-1 the TPM predictions would provide an acceptable match with
the observed fluxes. Taking the stated radar uncertainty
of ![]() 10% into account, we conclude that the radar sizes are
overestimated by a few percent.
10% into account, we conclude that the radar sizes are
overestimated by a few percent.
Sekiguchi et al. (2003) derived through the
NEATM (Harris 1998) radiometric diameter
and albedo values which agree within the specified error bars with
our solution. The NEATM results for the NEA 2002 NY40 (data at
one phase angle only) also
compare well with the TPM predictions (Müller
et al. 2004). But for data sets covering very
different phase angles, as it is the case here, the NEATM requires
different beaming parameters (Delbo et al. 2003),
while the TPM can explain all observed data points with one
set of physical and thermal parameters. The TPM beaming model,
parameterised by ![]() and f, can handle the very different
illumination geometries without artificial correction factors.
Additionally, the NEATM cannot explain the before/after opposition
(or morning/evening) effect, unless the beaming parameters are adjusted
differently before and after opposition. A detailed comparison
with the NEATM was therefore not performed.
and f, can handle the very different
illumination geometries without artificial correction factors.
Additionally, the NEATM cannot explain the before/after opposition
(or morning/evening) effect, unless the beaming parameters are adjusted
differently before and after opposition. A detailed comparison
with the NEATM was therefore not performed.
We also tried to determine surface roughness
properties, described in the TPM by ![]() and f.
It turned out, that the TPM predictions for our given large
phase angles are almost independent of these beaming parameters.
This is in agreement with the fact that the effect only plays
a role at small phase angles where mutual heating within the
crater structures produce an enhanced amount of infrared
flux (as compared to a smooth surface). Our phase angle
coverage therefore does not allow to draw any conclusions
on the surface roughness, crater structures or rms values of the surface slopes. Additional data at small phase
angles close to opposition are required for such investigations.
and f.
It turned out, that the TPM predictions for our given large
phase angles are almost independent of these beaming parameters.
This is in agreement with the fact that the effect only plays
a role at small phase angles where mutual heating within the
crater structures produce an enhanced amount of infrared
flux (as compared to a smooth surface). Our phase angle
coverage therefore does not allow to draw any conclusions
on the surface roughness, crater structures or rms values of the surface slopes. Additional data at small phase
angles close to opposition are required for such investigations.
We also compared the difference between using a spherical shape model
(together with the true spin vector solution under the given observing
geometries in combination with the TPM) and using the
Kaasalainen shape model. Assuming a spherical shape gives in fact very
similar mean (or weighted mean) diameter and albedo values, but the
scatter between the 20 derived albedo values is about 50% larger.
The derived diameter and albedo values are then dependent on the
rotational phase and to a certain extent also on the aspect angle.
Additionally, the effective diameter and albedo one obtains by simply
averaging our observations is not significantly different than that derived
from the rotationally resolved observations, since they span a range more
or less uniformly from maximum to minimum of the lightcurve, as shown
in Fig. 5.
The observations in July 2004 allowed to determine a 10.0 ![]() m
lightcurve which is perfectly matched by the Kaasalainen et al. (2005) shape and spin vector model together
with the TPM and a thermal inertia of 750 J m-2 s-0.5 K-1. In general, measurements
taken at relatively large phase angles after opposition
(here
m
lightcurve which is perfectly matched by the Kaasalainen et al. (2005) shape and spin vector model together
with the TPM and a thermal inertia of 750 J m-2 s-0.5 K-1. In general, measurements
taken at relatively large phase angles after opposition
(here
![]() ), where the terminator is still warm
(for an object with retrograde rotation),
can be considered as key observations to determine thermal
properties of NEAs. The only important
point is a sufficient coverage of the rotational phases.
The measurements before opposition are much more
influenced by the actual illumination and observing geometry and only
in second order by the contribution from the cold terminator.
), where the terminator is still warm
(for an object with retrograde rotation),
can be considered as key observations to determine thermal
properties of NEAs. The only important
point is a sufficient coverage of the rotational phases.
The measurements before opposition are much more
influenced by the actual illumination and observing geometry and only
in second order by the contribution from the cold terminator.
The thermal inertia is defined as
![]() ,
with
,
with
![]() being the thermal conductivity,
being the thermal conductivity,
![]() the density
and
the density
and
![]() the heat capacity of the surface material.
A dust layer on the Itokawa surface, like the one on the Moon,
with typical Moon-like
the heat capacity of the surface material.
A dust layer on the Itokawa surface, like the one on the Moon,
with typical Moon-like
![]() and
and
![]() values (Keihm 1984)
would require a density several hundred times higher than the 1250 kg m-3 for the Moon to account for the derived thermal inertia.
On the other hand, combining the derived high thermal inertia with
the S-type bulk density of Ida (Belton et al. 1995)
of 2600 kg m-3 and the specific heat of Granite
values (Keihm 1984)
would require a density several hundred times higher than the 1250 kg m-3 for the Moon to account for the derived thermal inertia.
On the other hand, combining the derived high thermal inertia with
the S-type bulk density of Ida (Belton et al. 1995)
of 2600 kg m-3 and the specific heat of Granite
![]() J kg-1 K-1 the
J kg-1 K-1 the
![]() value would be in the order of 0.3 W m-1 K-1.
This seems to be a reasonable conductivity for a porous stony material.
The porosity itself can be determined from the assumed bulk density
of 2600 kg m-3 in combination with an anhydrous
ordinary chondrite surface composition (Ishiguro et al. 2003):
value would be in the order of 0.3 W m-1 K-1.
This seems to be a reasonable conductivity for a porous stony material.
The porosity itself can be determined from the assumed bulk density
of 2600 kg m-3 in combination with an anhydrous
ordinary chondrite surface composition (Ishiguro et al. 2003):
![]() (Belton et al. 1995).
In conclusion, the mid-IR data are in very good agreement with the
assumption of a bare rock surface. A thick dust regolith can be
excluded as well as a metallic surface which would have a
(Belton et al. 1995).
In conclusion, the mid-IR data are in very good agreement with the
assumption of a bare rock surface. A thick dust regolith can be
excluded as well as a metallic surface which would have a ![]() -value
above 10 000 J m-2 s-0.5 K-1 and consequently produce
a very small thermal lightcurve amplitude (see Fig. 5).
-value
above 10 000 J m-2 s-0.5 K-1 and consequently produce
a very small thermal lightcurve amplitude (see Fig. 5).
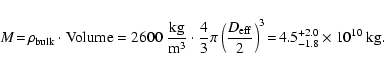
The total mass of Itokawa is directly connected to the
assumed bulk density and the determined volume of the Kaasalainen-shape
model via the
![]() value (full uncertainty range of both quantities
has been applied):
value (full uncertainty range of both quantities
has been applied):
The example of Itokawa shows the potential of the TPM applications for NEAs. State-of-the-art shape models from radar and lightcurve inversion techniques can be used for sophisticated thermo-physical investigations. In fact, the Itokawa case was the first implementation of Kaasalainen-shape models in the context of the TPM by Lagerros (1996; 1997; 1998). The TPM allows the combination of observational data taken at different observing and illumination geometries and wavelengths. No artificial fitting parameters are necessary to explain the spectral energy distributions nor the thermal behaviour with phase angle. And the thermal lightcurve is a "normal'' output product for objects with known sizes and shapes.
The Hayabusa mission will characterise Itokawa's properties with high reliability. Our derived properties can therefore be compared and the TPM be verified. This project will establish the "ground truth'' for future NEA TPM applications. The experience with the thermal data are very important for the planning of future observing campaigns of NEAs. Depending on the availability of a target, the wavelengths, the phase angles and the rotational phases can be selected in such a way that the thermophysical characterisation benefits most. E.g. if the surface roughness properties are of interest, one would have to include observations close to opposition. If thermal inertia is important, certain phase angles and/or a significant coverage of the thermal lightcurve are key ingredients for a successful study.
Acknowledgements
We would like to thank F. Hormuth for his support in the data analysis of the TIMMI2 observations and J. Lagerros for his modifications in the TPM code to allow a proper use of the Kaasalainen shape models. M. Delbo supported our re-evaluation of the TIMMI2 data of his thesis work.