![\begin{figure}
\par\includegraphics[width=15cm]{2249fig1.eps}\end{figure}](/articles/aa/full/2005/43/aa2249-04/img105.gif) |
Figure 1:
Density contours for dust particles for the disk seen face on
at the end of the low resolution simulations, each quadrant representing a
different size of particles. The vertical bar gives |
| Open with DEXTER | |
In the text
![\begin{figure}
\includegraphics[width=12cm]{2249fig2.eps}\end{figure}](/articles/aa/full/2005/43/aa2249-04/img106.gif) |
Figure 2:
Density contours for dust particles of different sizes for the disk
seen edge on at the end of the low resolution simulations. The outermost
contour is the
|
| Open with DEXTER | |
In the text
![\begin{figure}
\par\resizebox{\hsize}{!}{\includegraphics[angle=-90]{2249fig3.eps}}\end{figure}](/articles/aa/full/2005/43/aa2249-04/img107.gif) |
Figure 3:
|
| Open with DEXTER | |
In the text
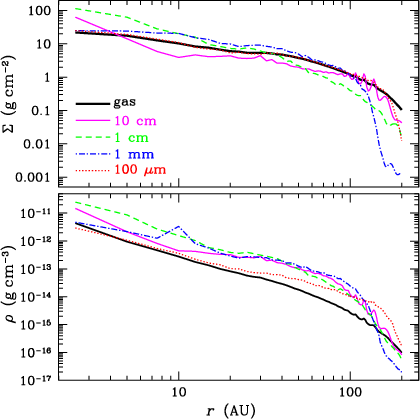 |
Figure 4:
Surface density |
| Open with DEXTER | |
In the text
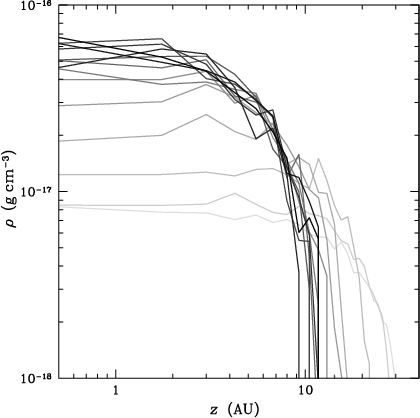 |
Figure 5:
Volume density versus z at r=150 AU for the 100 |
| Open with DEXTER | |
In the text
![\begin{figure}
\includegraphics[width=10.5cm,clip]{2249fig6.eps}\end{figure}](/articles/aa/full/2005/43/aa2249-04/img111.gif) |
Figure 6:
Contours of the vertical velocity for 1 mm ( top panels) and 100 |
| Open with DEXTER | |
In the text