A&A 443, 103-114 (2005)
DOI: 10.1051/0004-6361:20042162
S. Carpano 1 - J. Wilms 2 - M. Schirmer 3,4 - E. Kendziorra 1
1 - Institut für Astronomie und Astrophysik, Abteilung
Astronomie, Universität Tübingen, Sand 1, 72076 Tübingen, Germany
2 -
Department of Physics, University of Warwick, Coventry, CV4 7AL, UK
3 -
Institut für Astrophysik und Extraterrestrische Forschung,
Universität Bonn, Auf dem Hügel 71, 53121 Bonn, Germany
4 -
Isaac Newton Group of Telescopes, 38700 Santa Cruz de La Palma, Spain
Received 12 October 2004 / Accepted 14 July 2005
Abstract
We present X-ray properties of NGC 300 point sources,
extracted from 66 ks of XMM-Newton data taken in 2000 December and 2001 January. A total of 163 sources were
detected in the energy range of 0.3-6 keV. We report on the
global properties of the sources detected inside the
D25 optical disk, such as the hardness ratio and X-ray
fluxes, and on the properties of their optical counterparts found
in B, V, and R images from the 2.2 m MPG/ESO telescope.
Furthermore, we cross-correlate the X-ray sources with SIMBAD,
the USNO-A2.0 catalog, and radio catalogues.
Key words: galaxies: individual: NGC 300 - X-rays: galaxies
Studies of the X-ray population of spiral galaxies other than our
Galaxy are of importance especially for the understanding of the
formation of X-ray binaries and other X-ray emitting sources. NGC 300
is a member of the Sculptor galaxy group. Due to its small distance
(![]() 2.02 Mpc; Freedman et al. 2001), the SA(s)d dwarf galaxy NGC 300
is an ideal target for the study of the entire X-ray population of a
typical normal quiescent spiral galaxy. The major axes of the D25 optical disk are 13.3 kpc and 9.4 kpc
(
2.02 Mpc; Freedman et al. 2001), the SA(s)d dwarf galaxy NGC 300
is an ideal target for the study of the entire X-ray population of a
typical normal quiescent spiral galaxy. The major axes of the D25 optical disk are 13.3 kpc and 9.4 kpc
(
![]() ;
de Vaucouleurs et al. 1991).
These studies are even more simplified by the
galaxy's almost face-on orientation and its low Galactic column density
(
;
de Vaucouleurs et al. 1991).
These studies are even more simplified by the
galaxy's almost face-on orientation and its low Galactic column density
(
![]() ;
Dickey & Lockman 1990).
;
Dickey & Lockman 1990).
The first X-ray population study of NGC 300 was performed
between 1991 and 1997 with a total of five ROSAT pointings
(Read & Pietsch 2001). The total exposure time of these data was 46 ks
in the ROSAT Position Sensitive Proportional Counter and
40 ks in the ROSAT High Resolution Imager, all with a
nominal pointing position of
![]() and
and
![]() .
In these
observations, a total of 29 sources was discovered within the D25disk, the brightest being a black hole candidate with
.
In these
observations, a total of 29 sources was discovered within the D25disk, the brightest being a black hole candidate with
![]() in the 0.1-2.4 keV
band. Read & Pietsch (2001) also identified a highly variable
supersoft source and other bright sources coincident with known
supernova remnants (SNRs) and H II regions. The luminosity
of the residual X-ray emission, probably due to unresolved sources and
genuine diffuse gas, has been estimated to
in the 0.1-2.4 keV
band. Read & Pietsch (2001) also identified a highly variable
supersoft source and other bright sources coincident with known
supernova remnants (SNRs) and H II regions. The luminosity
of the residual X-ray emission, probably due to unresolved sources and
genuine diffuse gas, has been estimated to
![]() (Read & Pietsch 2001).
(Read & Pietsch 2001).
More recently, NGC 300 was observed with XMM-Newton on 2000 December 26 during XMM-Newton's revolution 192 and 6 days later during revolution 195. Some previous results of these observations have been presented by Kendziorra et al. (2001) and Carpano et al. (2004). Data on the luminous supersoft X-ray source XMMU J005510.7-373855 in the center of NGC 300 were presented by Kong & Di Stefano (2003). In addition to these X-ray data, observations with the 2.2 m MPG/ESO telescope on La Silla were performed. Here, we use archival images in the broad band B, V, and R filters.
In this paper we report a catalog of the NGC 300 X-ray point sources obtained with XMM-Newton data, as well as their optical counterparts. The aim of this work is to present a deeper broad-band catalogue of X-ray selected sources in NGC 300 to facilitate further population studies and searches for counterparts in other wavebands. Detailed studies of selected X-ray sources will be presented elsewhere (Carpano et al., in preparation). The remainder of this work is organized as follows. Section 2 describes the observations and data reduction of the X-ray and optical data. In Sect. 3 we describe some global properties of the X-ray point sources detected inside the D25 optical disk as well as of NGC 300's central diffuse region. The analysis of the optical counterparts of the X-ray sources is presented in Sect. 4. Tables of the X-ray and optical properties are given in Sect. 5. We discuss our results in Sect. 6.
XMM-Newton observed NGC 300 during its orbit 192 (2000 December 26; 37 ks on source time) and orbit 195 (2001 January 1; 47 ks on source time). For both observations, all three EPIC cameras were operated in their full frame mode with the medium filter. See Turner et al. (2001) and Strüder et al. (2001) for a description of the EPIC cameras. The aimpoint of the EPIC-pn camera was centered on NGC 300, using the same position as that of the earlier ROSAT data. The good-time-intervals extracted from the MOS light curve for revolution 192 were also used to filter the events list of the pn-camera, leaving 30 ks of low background data for each of the three cameras. The particle background during revolution 195 was low, resulting in net observing times of 43 ks for the two MOS cameras and 40 ks for the pn-camera.
We reduced the data using the standard XMM-Newton Science
Analysis System (SAS), version 6.1.0, using the
epchain task for the EPIC-pn and emchain for the MOS
cameras. Spectra, images, and lightcurves were extracted using
evselect; we only consider events measured in regions
away from the CCD borders or bad pixels (
![]() ), and only
single and double events for the pn camera (
), and only
single and double events for the pn camera (
![]() )
and single to quadruple events for the MOS cameras
(
)
and single to quadruple events for the MOS cameras
(
![]() ). The Response Matrix and Ancilliary
Response files are created with the rmfgen and
arfgen tasks using the newest available calibration files.
). The Response Matrix and Ancilliary
Response files are created with the rmfgen and
arfgen tasks using the newest available calibration files.
NGC 300 was originally observed between 1999 July and 2000 January
with the 2.2 m MPG/ESO telescope on La Silla, Chile, for the
ARAUCARIA project (Pietrzynski et al. 2002a), an attempt to fine-tune the cosmic
distance ladder by comparing different distance indicators such as
Cepheids, blue supergiants, the tip of the red giant branch, and
planetary nebulae for various nearby galaxies. The data we used for
this work was retrieved from the ESO archive. The reduction was
performed in the framework of the Garching-Bonn Deep Survey by
Schirmer et al. (2003), who also comment extensively on the data reduction.
NGC 300 was observed throughout 34 nights, which resulted in 11 h
(110 images), 10.4 h (105 images), and 4.2 h (42 images), in
the B, V, and R filters, respectively. The observations were centered
on
![]() ,
,
![]() with a field of view of
with a field of view of
![]() .
The average seeing in the B, V, and R data was
.
The average seeing in the B, V, and R data was
![]() ,
,
![]() and
and
![]() ,
respectively. The absolute
astrometric accuracy of the optical images is
,
respectively. The absolute
astrometric accuracy of the optical images is ![]() 0.25 arcsec. The
relative astrometry accuracy is about ten times better.
0.25 arcsec. The
relative astrometry accuracy is about ten times better.
![\begin{figure}
\par\includegraphics[width=17cm,clip]{2162fig1.ps}
\end{figure}](/articles/aa/full/2005/43/aa2162-04/img23.gif) |
Figure 1: Optical image of NGC 300 in the visible band overlaid by a contour map of the merged 0.3-6.0 keV raw X-ray image from all three EPIC cameras and from both orbits. The D25 optical disk and the sources detected inside the disk are also shown. |
| Open with DEXTER | |
Event and attitude file of each instrument were first merged for both
orbits 192 and 195, using the SAS merge task. This
approach is valid since both observations have the same
pointing direction and the difference in position angles between the two
observations was very small and consequently the effect of the
varying point spread function of XMM-Newton on the
resulting image is small. Point source detection was then performed
using a maximum likelihood approach as implemented by the SAS-tool
edetect_chain. We ran this tool simultaneously on the data
from all three cameras, setting a maximum likelihood threshold of 10
in the 0.3-6.0 keV band. After removing sources associated with
the cluster of galaxies CL 0053-37, a total of 163 sources were found, of
which 86 sources are within the D25 optical disk. As it will be
shown in Sect. 3.3, our detection limiting flux in the
0.3-6.0 keV energy band is
![]() for sources
inside the optical disk.
for sources
inside the optical disk.
We adaptively determine source and background regions with the SAS region task, using an elliptical locus to approximate the spatially varying point spread function.
Figure 1 shows the V band optical image of NGC 300 and the contour map of the merged X-ray raw image from both orbits and all three EPIC cameras in the 0.3-6.0 keV energy band. The D25optical disk and the sources detected inside the disk, which are numbered in order of decreasing X-ray count rate as determined by the edetect_chain, are also shown.
A summary of the properties of these detected sources as well as their possible optical counterparts is given in Table 1, described in detail in Sect. 5.
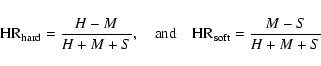
Any classification of the detected sources as well as the determination of the source flux require an understanding of the spectral shape of the sources. Due to the low count rates of most detected sources, formal spectral modelling is only possible for a few of the brightest sources (these fits will be shown in a subsequent paper). We therefore rely on X-ray color-color and hardness ratio diagrams in the determination of the flux and the spectral shape.
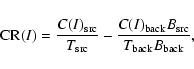
In order to determine these quantities, we first derive the
background-subtracted count rate from
 |
(1) |
The BACKSCAL keyword present in the XMM-SAS produced spectra
is defined by the geometric area of the source extraction region minus
the bad pixels or CCD gaps laying within that source region.
Due to software bugs, this keyword is not always correctly
estimated. Source regions intersecting bad CCD columns often have
BACKSCAL overestimated. For that reason, the total number of
counts in a given energy band (soft, medium, or hard) in
background-subtracted spectra can sometimes be negative. When this
happens the data coming from that instrument for that revolution are
excluded from the hardness ratio calculation. To obtain the total
count rate in each band, we add the valid count rates data from all
three EPIC instruments. The X-ray colors are then defined by:
Table 1: Summary of the X-ray properties of sources found in NGC 300 (see text for details).
![\begin{figure}
\par\includegraphics[width=8.35cm,clip]{2162fig2.ps}
\end{figure}](/articles/aa/full/2005/43/aa2162-04/img518.gif) |
Figure 2: Color-color diagram of sources detected inside the D25 optical disk. |
| Open with DEXTER | |
Figure 2 shows the resulting color-color diagram for the
X-ray sources inside the D25 optical disk, excluding sources
having less than 20 net counts. In Fig. 3 we
compare these data with empirical color-color diagrams assuming a
simple bremsstrahlung model and a two component source spectrum
consisting of a soft bremsstrahlung and a hard power law component
(colors derived from simple power law models were not sufficient to
describe the data). In these models the equivalent hydrogen column
![]() ,
expressed in units of
,
expressed in units of
![]() ,
is
running from 0.03 to 1.0. In the simple bremsstrahlung model the
temperature kT varies from 0.01 to 5.0 keV. In the bremsstrahlung
plus power-law model the photon index
,
is
running from 0.03 to 1.0. In the simple bremsstrahlung model the
temperature kT varies from 0.01 to 5.0 keV. In the bremsstrahlung
plus power-law model the photon index ![]() varies from 0.5 to 4.5
and the bremsstrahlung temperature is fixed at 0.2 keV. Both models
are sufficient to describe the data, however, the
varies from 0.5 to 4.5
and the bremsstrahlung temperature is fixed at 0.2 keV. Both models
are sufficient to describe the data, however, the ![]() values
inferred are generally larger than the pure Galactic
values
inferred are generally larger than the pure Galactic ![]() in
the direction to NGC 300 (which is
in
the direction to NGC 300 (which is
![]() ;
Dickey & Lockman 1990),
indicating intrinsic
absorption within NGC 300 and also pointing towards a possible
contamination of our source sample by background AGN. From the
2-10 keV AGN
;
Dickey & Lockman 1990),
indicating intrinsic
absorption within NGC 300 and also pointing towards a possible
contamination of our source sample by background AGN. From the
2-10 keV AGN ![]() -
-![]() -diagram of Ueda et al. (2003),
-diagram of Ueda et al. (2003),
![]() 30 AGN with
30 AGN with
![]() are
expected within the D25-disk, however, the identification of AGN
in our sample requires X-ray spectral analysis which is only possible
for the brightest sources and dangerous in itself due to the
similarity of AGN and XRB spectra.
are
expected within the D25-disk, however, the identification of AGN
in our sample requires X-ray spectral analysis which is only possible
for the brightest sources and dangerous in itself due to the
similarity of AGN and XRB spectra.
![\begin{figure}
\par\includegraphics[width=8.4cm,clip]{2162fig3.ps}
\end{figure}](/articles/aa/full/2005/43/aa2162-04/img525.gif) |
Figure 3:
Color-color diagram of the sources detected inside
the D25 optical disk and color-color contours for
bremsstrahlung and 0.2 keV bremsstrahlung plus power law
component. The equivalent hydrogen column, |
| Open with DEXTER | |
Our color-color diagram analysis shows that for all sources except one it is possible to find a best matching bremsstrahlung or bremsstrahlung plus power law model. The spectrum of the one non-matching source (#120), which is in a very complex region, is peculiar and has been excluded from the subsequent analysis. The low number of counts precludes any further statement about the nature of this source.
From this best matching spectral model it is then possible to determine the flux of a source by appropriately scaling the flux determined from the spectral model to the source count rate. The uncertainty of the flux is derived from the minimum and maximum value of fluxes as determined from the error box of the color-color space defined by the source colors. Note that such an approach gives generally more believable flux estimates than the more commonly used approach of assuming one fixed spectral shape for all detected sources, while not limiting one to determining spectral fluxes only for sources with sufficient counts to enable formal spectral model fitting (see also Humphrey & Buote 2004).
![\begin{figure}
\par\includegraphics[width=8.8cm,clip]{2162fig4.ps}
\end{figure}](/articles/aa/full/2005/43/aa2162-04/img526.gif) |
Figure 4: Fluxes of the sources detected inside the D25 optical disk as a function of the harder ( top) and softer ( bottom) hardness ratio defined by Eq. (2). |
| Open with DEXTER | |
Figure 4 shows the source fluxes versus both hardness ratios
defined by Eq. (2). For comparison, a source with a
luminosity of
![]() ,
close to
the Eddington limit for a
,
close to
the Eddington limit for a
![]() object, has an integral flux
of
object, has an integral flux
of
![]() at
the distance of NGC 300.
at
the distance of NGC 300.
Our brightest source, source 1, is found with a luminosity of
![]() which is very close to
the Eddington limit for a
which is very close to
the Eddington limit for a
![]() object. The source, coincident
with the previously known ROSAT source P42
(Read & Pietsch 2001), has been found to have a slightly lower
luminosity than in the ROSAT observations, but spectral
fitting of the brightest X-ray sources, which will be given in a
forthcoming paper, is needed to certify if these sources have an
intrinsic variability. From their high intrinsic luminosities, these
sources are akin to
object. The source, coincident
with the previously known ROSAT source P42
(Read & Pietsch 2001), has been found to have a slightly lower
luminosity than in the ROSAT observations, but spectral
fitting of the brightest X-ray sources, which will be given in a
forthcoming paper, is needed to certify if these sources have an
intrinsic variability. From their high intrinsic luminosities, these
sources are akin to ![]()
![]() black holes in their soft
state such as LMC X-1 or LMC X-3 (Nowak et al. 2001; Wilms et al. 2001). There
are no clear super-Eddington X-ray sources detected in NGC 300.
Finally, we also note that both hardness ratios do not depend
significantly on flux.
black holes in their soft
state such as LMC X-1 or LMC X-3 (Nowak et al. 2001; Wilms et al. 2001). There
are no clear super-Eddington X-ray sources detected in NGC 300.
Finally, we also note that both hardness ratios do not depend
significantly on flux.
Figure 5 shows the ![]() -
-![]() diagram for all
detected sources that are inside the optical disk of NGC 300
and having more than 20 net counts, expressed as a function
of their X-ray luminosity and flux. Note that we do not make an
attempt to correct for possible background AGN, which could appear as
sources which are strongly absorbed by the gas within NGC 300.
diagram for all
detected sources that are inside the optical disk of NGC 300
and having more than 20 net counts, expressed as a function
of their X-ray luminosity and flux. Note that we do not make an
attempt to correct for possible background AGN, which could appear as
sources which are strongly absorbed by the gas within NGC 300.
The break of the power law at a luminosity of
![]() (corresponding to
(corresponding to
![]() )
defines
our completeness limit. Describing the luminosity function above this
limit by a pure powerlaw,
)
defines
our completeness limit. Describing the luminosity function above this
limit by a pure powerlaw,
![]() ,
we use
a Maximum-Likelihood method in the form suggested by Crawford et al. (1970).
We find a slope of
,
we use
a Maximum-Likelihood method in the form suggested by Crawford et al. (1970).
We find a slope of
![]() (since our source sample is lacking
objects with
(since our source sample is lacking
objects with
![]() ,
such
a simple power law Ansatz for the luminosity function is
sufficient; see, e.g., Humphrey & Buote 2004). This slope of the
NGC 300 luminosity function is similar to the slope of the disk
population in several other nearby spirals such as M 31
(
,
such
a simple power law Ansatz for the luminosity function is
sufficient; see, e.g., Humphrey & Buote 2004). This slope of the
NGC 300 luminosity function is similar to the slope of the disk
population in several other nearby spirals such as M 31
(
![]() ;
Williams et al. 2004) or NGC 1332
(Humphrey & Buote 2004), and also in agreement with the mean slope
for nearby spiral galaxies
(
;
Williams et al. 2004) or NGC 1332
(Humphrey & Buote 2004), and also in agreement with the mean slope
for nearby spiral galaxies
(
![]() ;
Colbert et al. 2004).
;
Colbert et al. 2004).
![\begin{figure}
\par\includegraphics[width=8.55cm,clip]{2162fig5.ps}
\end{figure}](/articles/aa/full/2005/43/aa2162-04/img540.gif) |
Figure 5:
|
| Open with DEXTER | |
Due to the apparent bimodality of the sources in Fig. 2,
we define two subclasses of sources: hard sources, defined by
![]() ,
and soft sources, with
,
and soft sources, with
![]() .
Fitting a pure power law to
both curves, we find a slope of
.
Fitting a pure power law to
both curves, we find a slope of
![]() and
and
![]() for the soft and the hard sources respectively. Excluding sources
above a limiting luminosity of
for the soft and the hard sources respectively. Excluding sources
above a limiting luminosity of
![]() (excluding two sources in the
soft and one in the hard sample), the Maximum-Likelihood method gives a
slope of
(excluding two sources in the
soft and one in the hard sample), the Maximum-Likelihood method gives a
slope of
![]() and
and
![]() for the soft and the hard sources
respectively. The soft power law slope found here is a bit higher than
that of the Milky Way HMXB (Grimm et al. 2002, finding a slope of
for the soft and the hard sources
respectively. The soft power law slope found here is a bit higher than
that of the Milky Way HMXB (Grimm et al. 2002, finding a slope of
![]() ). The shape of the hard sources
is instead more complex. Grimm et al. (2002) described the Milky Way LMXB
luminosity function by a modified power law which takes into account
the gradual steepening of the
). The shape of the hard sources
is instead more complex. Grimm et al. (2002) described the Milky Way LMXB
luminosity function by a modified power law which takes into account
the gradual steepening of the ![]() -
-![]() relation towards
higher fluxes. There are indications that the hard sources in NGC 300
follow a similar luminosity function, as is indicated by the
different slope for sources with luminosities between
relation towards
higher fluxes. There are indications that the hard sources in NGC 300
follow a similar luminosity function, as is indicated by the
different slope for sources with luminosities between
![]() and
and ![]()
![]() ,
and for sources between
,
and for sources between
![]()
![]() and
and
![]() .
Due to the low number of
sources in our sample, however, constraining the luminosity function
in this range is not possible. We also note that the two
luminosity functions cross at
.
Due to the low number of
sources in our sample, however, constraining the luminosity function
in this range is not possible. We also note that the two
luminosity functions cross at ![]()
![]() and that it is the soft sources
which are dominating at the highest luminosity levels, as seems to be
typical for spiral galaxies (Colbert et al. 2004).
and that it is the soft sources
which are dominating at the highest luminosity levels, as seems to be
typical for spiral galaxies (Colbert et al. 2004).
Data from all instruments and both revolutions were used to extract
the spectrum. Because the spectrum of the diffuse emission
region is very soft, we consider only the 0.3-1.3 keV energy
band. The Al and Si fluorescence lines present in the MOS
background (in the 1.3-1.9 keV band), which cannot be removed properly, are beyond the region
of interest. The spectrum can be described
(
![]() )
by thermal emission from a
collisionally ionized plasma, as described by XSPEC's APEC model
(see http://hea-www.harvard.edu/APEC/ for a description of
this model) with a temperature of
)
by thermal emission from a
collisionally ionized plasma, as described by XSPEC's APEC model
(see http://hea-www.harvard.edu/APEC/ for a description of
this model) with a temperature of
![]() keV
plus a thermal component with a temperature of
keV
plus a thermal component with a temperature of
![]() keV. The 0.3-1.3 keV flux is
keV. The 0.3-1.3 keV flux is
![]() (Fig. 6; error bars are at the 90% level). Similar
results are found for the diffuse region in nearly face-on spiral
galaxy M 101 (Kuntz et al. 2003), where the spectrum in the 0.5-2 keV
band, is characterized by the sum of two thermal spectra with
kT=0.20 keV and kT=0.75 keV.
(Fig. 6; error bars are at the 90% level). Similar
results are found for the diffuse region in nearly face-on spiral
galaxy M 101 (Kuntz et al. 2003), where the spectrum in the 0.5-2 keV
band, is characterized by the sum of two thermal spectra with
kT=0.20 keV and kT=0.75 keV.
![\begin{figure}
\par\includegraphics[width=8.8cm,height=7.8cm,angle=-90,clip]{2162fig6.ps}
\end{figure}](/articles/aa/full/2005/43/aa2162-04/img559.gif) |
Figure 6:
Top: EPIC pn and MOS spectra of the
central diffuse emission region and the best fit spectral model,
consisting of the sum of an APEC model, and a
bremsstrahlung component, bottom: residuals expressed in
|
| Open with DEXTER | |
![\begin{figure}
\par\includegraphics[width=8cm,clip]{2162fig7.ps}
\end{figure}](/articles/aa/full/2005/43/aa2162-04/img560.gif) |
Figure 7: Smoothed 0.3-1.3 keV X-ray image of the central region of NGC 300 after removal of detected sources. The circle and annulus show the region for the central diffuse emission area and the associated background, respectively. |
| Open with DEXTER | |
To determine the optical counterparts of the X-ray sources we first
improved the X-ray aspect solution by comparing the optical and X-ray
coordinates of 21 sources inside of the D25 disk which have clear
optical counterparts. This is done via the eposcorr task,
which uses a correlation algorithm to find offsets in RA, Dec, and
roll angle which improve the positional accuracy of the X-ray
positions with respect to the optical data. These optimum offsets are
then used to correct the input source positions. This algorithm
reveals a systematic shift (X-ray - optical) of
![]() in
right ascension, of
in
right ascension, of
![]() in declination, and of
in declination, and of
![]() for the roll angle.
for the roll angle.
These offset values are close to values found in the astrometric
calibration of XMM-Newton by
Guainazzi et al. (2004)![]() ,
who find -2.52'' (
,
who find -2.52'' (![]() )
and -3.09'' (
)
and -3.09'' (![]() )
in right
ascension for MOS1 and MOS2, and
)
in right
ascension for MOS1 and MOS2, and
![]() and
and
![]() in
declination, respectively. The final uncertainty in X-ray position
results from a combination of the edetect_chain output and
the error associated with this position offset.
in
declination, respectively. The final uncertainty in X-ray position
results from a combination of the edetect_chain output and
the error associated with this position offset.
After correcting the X-ray positions, we searched for all possible optical counterparts in the merged BVR optical image and then calculate their fluxes in each of these three optical bands. Photometry was performed with the IDL idlphot photometry library available at http://idlastro.gsfc.nasa.gov/contents.html, which is a set of IDL procedures adapted from an early Fortran version of the DAOPHOT aperture photometry package (Stetson 1987).
We generate an initial optical catalogue by searching for sources within the area surrounding the corrected X-ray positions (for which the radius is given by the uncertainty of the position) in the merged optical image using idlphot's find procedure and assuming a Gaussian point spread function (PSF). This search results in a list of several possible optical counterparts. These source positions are then improved by fitting a measured PSF (as determined from bright optical sources in the image) and the source flux in the B, V, and R bands is determined from the PSF fit after subtracting the local background level. Comparing the B and V magnitudes with reference stars given by Pietrzynski et al. (2002b) shows differences of less than 0.15 mag, in agreement with our typical flux uncertainty.
![\begin{figure}
\par\includegraphics[width=11cm,clip]{2162fig8.ps} \includegraphics[width=11cm,clip]{2162fig9.ps}
\end{figure}](/articles/aa/full/2005/43/aa2162-04/img567.gif) |
Figure 8:
|
| Open with DEXTER | |
For the 32 brightest X-ray sources within the D25 ellipse, Fig. 8 shows the resulting optical counterparts in the merged optical image. As further described in Sect. 5 below, we also compare these X-ray and optical positions with sources from SIMBAD, the USNO-A2.0 catalog, and with radio sources from Payne et al. (2004). We consider sources from these catalogs as possible counterparts if they have a distance less than 20'' from the corrected X-ray positions for X-ray sources, 10''for (suspected) supernova remnants and 5'' for the other sources. The closest sources of these counterparts are shown in Fig. 8 with a box.
Table 1 summarizes all information collected from the 86
X-ray sources detected inside the D25 disk. The first column
gives the source ID. The second and third columns give the equatorial
sky coordinates of the X-ray sources from the SAS
edetect_chain task corrected by the eposcorr task.
The combined positional error (in arcsec) from edetect_chain
and eposcorr is given in Col. 4. Column 5 lists the
detection likelihood and Cols. 6 and 7 give net counts and count
rates, respectively (in counts
![]() ), and their
corresponding uncertainties. Columns 8 and 9 list the softer and
harder hardness ratios defined by Eq. (2) and their
errors. Columns 10 and 11 give the 0.3-6.0 keV flux and luminosity,
expressed in
), and their
corresponding uncertainties. Columns 8 and 9 list the softer and
harder hardness ratios defined by Eq. (2) and their
errors. Columns 10 and 11 give the 0.3-6.0 keV flux and luminosity,
expressed in
![]() and
and
![]() respectively.
respectively.
Table 2 summarizes all possible optical counterparts
found from the corrected X-ray positions within the X-ray position
error circle. Column 1 gives the X-ray source ID and the number in
brackets designates a label number when several optical counterparts
are found within the X-ray position error area. Columns 2 and 3 give
the equatorial sky coordinates of optical counterparts found by
idlphot's find procedure. Columns 4-6 give
the magnitudes for the optical counterparts, in the B, V, and R band
respectively, with errors of ![]() 0.15 mag. Column 7 gives
the name and, when available, the reference (within brackets) for
possible radio and optical counterparts sources from SIMBAD (which
includes the ROSAT sources), the USNO-A2.0, and the following
catalogues: Payne et al. (2004, PFP2004), Schild et al. (2003, SCA2003),
Read & Pietsch (2001, RP2001), Pietrzynski et al. (2001, PGF2001),
Pannuti et al. (2000, PDL2000), Blair & Long (1997, BL97),
Soffner et al. (1996, SMJ96), Iovino et al. (1996, ICS96),
Deharveng et al. (1988, DCL88), Humphreys & Graham (1986, HG86),
Graham (1984, G84).
0.15 mag. Column 7 gives
the name and, when available, the reference (within brackets) for
possible radio and optical counterparts sources from SIMBAD (which
includes the ROSAT sources), the USNO-A2.0, and the following
catalogues: Payne et al. (2004, PFP2004), Schild et al. (2003, SCA2003),
Read & Pietsch (2001, RP2001), Pietrzynski et al. (2001, PGF2001),
Pannuti et al. (2000, PDL2000), Blair & Long (1997, BL97),
Soffner et al. (1996, SMJ96), Iovino et al. (1996, ICS96),
Deharveng et al. (1988, DCL88), Humphreys & Graham (1986, HG86),
Graham (1984, G84).
Table 2: Summary of the optical counterparts of X-ray sources found in NGC 300 (see text for details).
According to SIMBAD, 14 of our X-ray sources detected inside the optical disk had already been observed in the X-rays (labelled "X''), there are 9 SNR or suspected ones (labelled "SNR?''), 11 radio sources (labelled "radio''), from which three are associated with SNRs and 8 are possible AGNs. Other sources match with association of stars (labelled "Assoc*''), H II (ionized) regions (labelled "H II''), with regions close to Cepheid variable stars (labelled "Cepheid''), or with stars (labelled "Star''). Many sources also have an USNO-A2.0 optical counterpart (labelled with a number).
As already discussed in Sect. 3.2, our brightest source
(#1), which has a luminosity of
![]() ,
has been identified by
(source P42) Read & Pietsch (2001), as a possible accreting binary. This
source has been found to have a Wolf Rayet star as optical counterpart
(labelled "WR*''). The source has a luminosity close to
the Eddington limit for a
,
has been identified by
(source P42) Read & Pietsch (2001), as a possible accreting binary. This
source has been found to have a Wolf Rayet star as optical counterpart
(labelled "WR*''). The source has a luminosity close to
the Eddington limit for a
![]() compact object, which may
suggest the presence of a black hole or neutron star X-ray binary.
Source number 8 has already been identified by Read & Pietsch (2001) and
Kong & Di Stefano (2003) as a luminous supersoft X-ray source and has no optical
counterpart.
compact object, which may
suggest the presence of a black hole or neutron star X-ray binary.
Source number 8 has already been identified by Read & Pietsch (2001) and
Kong & Di Stefano (2003) as a luminous supersoft X-ray source and has no optical
counterpart.
Using the color-color diagram allowed us to determine the shape of the
X-ray spectrum for each source individually and to estimate the source
fluxes. The luminosity function of NGC 300 is similar to that of
other spirals (Colbert et al. 2004) and can be described by a power law
with slope
![]() .
It is dominated by soft sources at high
luminosities, although we do not find strong super-Eddington sources
in the galaxy. More information about the brightest X-ray sources
inside the optical disk, such as spectral fitting and
temporal analyses, will be given in a subsequent paper. The spectrum
of the central diffuse emission region can be described
(
.
It is dominated by soft sources at high
luminosities, although we do not find strong super-Eddington sources
in the galaxy. More information about the brightest X-ray sources
inside the optical disk, such as spectral fitting and
temporal analyses, will be given in a subsequent paper. The spectrum
of the central diffuse emission region can be described
(
![]() )
by thermal emission from a
collisionally ionized plasma with
kT=0.2-0.01+0.01 keV,
plus a second thermal component with a temperature of
kT=0.8-0.1+0.1 keV.
)
by thermal emission from a
collisionally ionized plasma with
kT=0.2-0.01+0.01 keV,
plus a second thermal component with a temperature of
kT=0.8-0.1+0.1 keV.
The SAS eposcorr task revealed a small positional offset. After having corrected for this offset, we searched for optical counterparts in the B, V, and R data and cross-correlate with sources from SIMBAD and USNO-A2.0 catalogs, and radio sources.
We identified possible optical and radio counterparts to all X-ray sources using a variety of catalogues. The brightest X-ray source is probably a black hole or neutron star X-ray binary, possibly accreting from a Wolf Rayet star which was identified as the most likely optical counterpart. We confirm the presence of a luminous supersoft X-ray source which has no optical counterpart.
Acknowledgements
We thank Jeffrey Payne for kindly providing his list of radio source coordinates and for his collaboration. We also thank Wolfgang Pietsch for useful discussions and the referee, Andy Read, for his thorough refereeing which greatly improved the quality of this publication.
This paper is based on observations with XMM-Newton, an ESA science mission with instruments and contributions directly financed by the ESA Member States and the USA (NASA), and on observations made with ESO Telescope at La Silla observatory and retrieved from the ESO archive. We acknowledge partial support from DLR grant 50OX0002. This work was furthermore supported by the BMBF through the DLR under the project 50OR0106, by the BMBF through DESY under the project 05AE2PDA/8, and by the Deutsche Forschungsgemeinschaft under the project SCHN 342/3-1. The support given by ASTROVIRTEL, a project funded by the European Commission under FP5 Contract No. HPRI-CT-1999-00081, is acknowledged. This research has made use of the SIMBAD database, operated at CDS, Strasbourg, France.