A&A 442, 917-924 (2005)
DOI: 10.1051/0004-6361:20053089
G. Carraro1,2 - D. Geisler3 - A. Moitinho4 - G. Baume5 - R. A. Vázquez5
1 - Departamento de Astronomía, Universidad de Chile,
Casilla 36-D, Santiago, Chile
2 -
Astronomy Department, Yale University,
PO Box 208101, New Haven, CT 06520-8101, USA
3 -
Universidad de Concepción, Departamento de Fisica,
Casilla 160-C, Concepción, Chile
4 -
CAAUL, Observatório Astronómico de Lisboa, Tapada da Ajuda,
1349-018 Lisboa, Portugal
5 -
Facultad de Ciencias Astronómicas y Geofísicas de la
UNLP, IALP-CONICET, Paseo del Bosque s/n, La Plata, Argentina
Received 18 March 2005 / Accepted 20 June 2005
Abstract
CCD BVI photometry of the faint open clusters Berkeley 73,
Berkeley 75 and Berkeley 25 are presented. The two latter
are previously unstudied clusters to our knowledge. While
Berkeley 73 is found to be of intermediate-age (about 1.5 Gyr old),
Berkeley 75 and Berkeley 25 are old clusters, with ages
greater than 3.0 Gyr. We provide also estimates of the clusters
size. All these clusters
lie far away from the Galactic Center,
at
![]() kpc, and quite high on the Galactic plane,
at
kpc, and quite high on the Galactic plane,
at
![]() kpc.
They are therefore important targets to probe the properties of the
structure of the Galaxy in this direction, where the Canis Major
over-density has been discovered to be located.
kpc.
They are therefore important targets to probe the properties of the
structure of the Galaxy in this direction, where the Canis Major
over-density has been discovered to be located.
Key words: open clusters and associations: individual: Berkeley 73, Berkeley 75, Berkeley 25 - open clusters and associations: general - Hertzprung-Russell (HR) and C-M diagrams
The paper belongs to a series aimed at providing homogeneous photometry of open clusters located in the third Galactic Quadrant. The main motivations of the survey are discussed in Moitinho (2001) and Giorgi et al. (2005). Briefly, we want to i) better trace the spiral structure and ii) probe the history of star formation in this part of the Galaxy. For these purposes open clusters of different ages are very useful. While the youngest clusters are very well known spiral arm tracers, the older ones are routinely used to probe the chemical evolution and star formation history of the disk (Carraro et al. 1998; de la Fuente Marcos & de la Fuente Marcos 2004). Moreover very distant open clusters in the Third Galactic Quadrant might help to probe the stellar population of the recently discovered Canis Major over-density, or to better understand the warp structure of the Galactic disk (Momany et al. 2004; Bellazzini et al. 2004). In this paper we discuss BVI photometry of three old open clusters, namely Berkeley 73, Berkeley 75 and Berkeley 25 (=Ruprecht 3) to derive their fundamental parameters, in particular age and distance, which are the basic input for the derivation of the star formation history in the Galactic disk. These clusters were unstudied until now except for Berkeley 73, whose first Color Magnitude Diagram (CMD) is discussed in Ortolani et al. (2005). The coordinates of these three clusters are listed in Table 1, and have been redetermined by one of us (G.C.) based on inspection of Digital Sky Survey (DSS and XDSS) images. These clusters are very loose and faint, and in many cases the reported coordinates are not very precise.
Table 1: Basic parameters of the clusters under investigation. Coordinates are for J2000.0 equinox.
The coordinates reported by Ortolani et al. (2005) for Berkeley 73 are wrong, and refer instead to the cluster vdB-Hagen 73.
In Sect. 2 we briefly illustrate observations and data reduction and in Sect. 3 we describe how we obtain the astrometry. In Sect. 4 we derive an estimate of the cluster diameters, and in Sect. 5 we describe the CMDs. In Sect. 6 we derive cluster fundamental parameters. In Sect. 7 we draw some conclusions and suggest further lines of research.
![\begin{figure}
\par\includegraphics[width=8.8cm]{fig1.eps}
\end{figure}](/articles/aa/full/2005/42/aa3089-05/img6.gif) |
Figure 1: A DSS red map of the covered region in the field of Berkeley 73. North is up, East to the left. |
| Open with DEXTER | |
![\begin{figure}
\par\includegraphics[width=8.8cm]{fig2.eps}
\end{figure}](/articles/aa/full/2005/42/aa3089-05/img7.gif) |
Figure 2: A DSS red map of the covered region in the field of Berkeley 75. North is up, East to the left. |
| Open with DEXTER | |
![\begin{figure}
\par\includegraphics[width=8.8cm]{fig3.eps}
\end{figure}](/articles/aa/full/2005/42/aa3089-05/img8.gif) |
Figure 3: A DSS red map of the covered region in the field of Berkeley 25. North is up, East to the left. |
| Open with DEXTER | |
CCD ![]() observations were carried out with the CCD camera on
the 1.0 m telescope at Cerro Tololo Interamerican Observatory (CTIO, Chile), on the nights of
December 13 and 15, 2004.
With a pixel size of
observations were carried out with the CCD camera on
the 1.0 m telescope at Cerro Tololo Interamerican Observatory (CTIO, Chile), on the nights of
December 13 and 15, 2004.
With a pixel size of
![]() and a CCD size of 512
and a CCD size of 512 ![]() 512
pixels,
this samples a
512
pixels,
this samples a
![]() field on the sky.
field on the sky.
The details of the observations are listed in Table 2 where the observed fields are reported together with the exposure times, the average seeing values and the range of air-masses during the observations. Figures 1 to 3 show DSS finding charts in the area of Berkeley 73, Berkeley 75 and Berkeley 25 and here one can easily recognize that these clusters are faint objects.
The data have been reduced with the
IRAF![]() packages CCDRED, DAOPHOT, ALLSTAR and PHOTCAL using the point spread function (PSF)
method (Stetson 1987).
The two nights were photometric and very stable, and therefore
we derived calibration equations for all the 130 standard stars
observed during the two nights in the Landolt
(1992) fields SA 95-41, PG 0231+051, Rubin 149, Rubin 152,
T phe and SA 98-670 (see Table 2 for details).
Together with the clusters, we observed three control fields 20 arcmin
away from the nominal cluster centers to deal with field star
contamination. Exposure of 600 s in V and I were secured for these
fields.
packages CCDRED, DAOPHOT, ALLSTAR and PHOTCAL using the point spread function (PSF)
method (Stetson 1987).
The two nights were photometric and very stable, and therefore
we derived calibration equations for all the 130 standard stars
observed during the two nights in the Landolt
(1992) fields SA 95-41, PG 0231+051, Rubin 149, Rubin 152,
T phe and SA 98-670 (see Table 2 for details).
Together with the clusters, we observed three control fields 20 arcmin
away from the nominal cluster centers to deal with field star
contamination. Exposure of 600 s in V and I were secured for these
fields.
Table 2: Journal of observations of Berkeley 73, Berkeley 75 and Berkeley 25 and standard star fields (December 13 and 15, 2004).
The calibration equations turned out of be of the form:
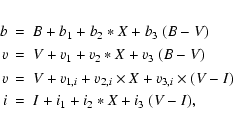
Table 3: Coefficients of the calibration equations.
where ![]() are standard magnitudes, bvi are the instrumental ones and X is
the airmass; all the coefficient values are reported in Table 3.
The standard
stars in these fields provide a very good color coverage.
The final rms of the calibration are 0.039, 0.034 and 0.033 for the B, V and I filters,
respectively.
We generally used the third equation to calibrate the V magnitude
in order to get the same magnitude depth both in the cluster
and in the field.
The limiting magnitudes are B = 21.9, V = 22.5and I =21.8.
We performed a completeness analysis following the method described in
Carraro et al. (2005). Our sample
has completeness level larger than 50
are standard magnitudes, bvi are the instrumental ones and X is
the airmass; all the coefficient values are reported in Table 3.
The standard
stars in these fields provide a very good color coverage.
The final rms of the calibration are 0.039, 0.034 and 0.033 for the B, V and I filters,
respectively.
We generally used the third equation to calibrate the V magnitude
in order to get the same magnitude depth both in the cluster
and in the field.
The limiting magnitudes are B = 21.9, V = 22.5and I =21.8.
We performed a completeness analysis following the method described in
Carraro et al. (2005). Our sample
has completeness level larger than 50![]() down to B = 20.0, V = 21.0and I = 20.5.
down to B = 20.0, V = 21.0and I = 20.5.
The final photometric catalogs for
Berkeley 73, Berkeley 75 and Berkeley 25 (coordinates,
B, V and I magnitudes and errors)
consist of 941, 1035 and 1039 stars, respectively, and are
available in electronic form at the
WEBDA![]() site
maintained by J.-C. Mermilliod.
site
maintained by J.-C. Mermilliod.
Since our photometry covers entirely each cluster's area
we performed star counts to obtain
the first quantitative estimate of the cluster size.
We derived the surface stellar density by performing star counts
in concentric rings around the cluster nominal centers (see Table 1)
and then dividing by their
respective area. Poisson errors have also been derived and normalized
to the corresponding area.
The field star contribution is derived from the control
field which we secured for each cluster.
We selected the magnitude interval
![]() both in the cluster
and in the field to minimize incompleteness effects.
both in the cluster
and in the field to minimize incompleteness effects.
Berkeley 73.
The final radial density profile for Berkeley 73 is shown in
the lower panel of Fig. 4.
The profile is smooth and reaches the level of the field at
about 1.5 arcmin, which we adopt as
Berkeley 73
radius throughout this paper. This estimate is sligthly larger than
the value of 2.0 arcmin reported by Dias et al. (2002) for the cluster
diameter.
![\begin{figure}
\par\includegraphics[width=8cm]{fig4.eps}
\end{figure}](/articles/aa/full/2005/42/aa3089-05/img33.gif) |
Figure 4: Star counts in the area of the three open clusters under study as a function of radius. The dashed lines represent the level of the control field counts estimated from the accompanying control field. |
| Open with DEXTER | |
![\begin{figure}
\par\includegraphics[width=14cm]{fig5.eps}
\end{figure}](/articles/aa/full/2005/42/aa3089-05/img34.gif) |
Figure 5: V vs. (B-V) ( left panels) and V vs. (V-I) ( middle panels) CMDs of Berkeley 73 ( lower panels), Berkeley 75 ( middle panels) and Berkeley 25 ( upper panels) and corresponding control fields ( right panels). We include all stars in each field. |
| Open with DEXTER | |
Berkeley 75.
The final radial density profile for Berkeley 75 is shown in
the middle panel of Fig. 4.
The cluster clearly emerges from the background up to
about 1.0 arcmin, a value that we adopt as
the Berkeley 75 radius.
Berkeley 25. The final radial density profile for Berkeley 25 is shown in the upper panel of Fig. 4. The cluster seems to be faint and dense, with a probable radius of less than 1 arcmin. This estimate is much smaller than the value of 5.0 arcmin reported by Dias et al. (2002) for the cluster diameter.
The estimates we provide for the radius, although reasonable, must be taken as preliminary. The size of the CCD is probably too small to derive conclusive estimates of the cluster sizes. This is particularly true in the case Berkeley 73, for which the cluster radius we derived must be considered as a lower limit to the real cluster radius. While for Berkeley 75 and 25 the cluster density profile converges toward the field level within the region covered by the CCD, in the case of Berkeley 73 the cluster dominates the star counts up to almost the border of the region we covered. Larger field coverage is necessary in this case to derive a firm estimate of the cluster radius.
![\begin{figure}
\par\includegraphics[width=14cm]{fig6.eps}
\end{figure}](/articles/aa/full/2005/42/aa3089-05/img35.gif) |
Figure 6: B-V vs. V-I diagram for the four clusters. The solid line is the normal reddening law, whereas dashed and dotted lines are the intrinsic colors for luminosity class III and V, respectively. See text for details. |
| Open with DEXTER | |
In Fig. 5 we present the CMDs we obtained for the three clusters under investigation. In this figure the open cluster Berkeley 73 is shown together with the corresponding control field in the lower panels, and Berkeley 75 and Berkeley 25 are presented in the middle and upper panels, respectively. The control fields help us to better interpret these CMDs, which are clearly dominated by foreground star contamination.
Berkeley 73.
It exhibits a Main Sequence (MS) extending from
V=17, where the Turn Off Point (TO) is located, down
to V=21. This MS is wide, a fact that we
ascribe to the increasing photometric error at increasing magnitude,
the field star contamination
and to the possible presence of a sizeable binary star population,
which mainly enlarges the MS toward red colors.
However, the reality of this cluster seems to be secured by the shape and
density of
the MS compared to the control field MS, whose
population sharply decreases at ![]() .
In addition, the cluster MS is significantly bluer and more tilted
than the field MS, which derives from the superposition
of stars of different reddening located at all distances.
Other interesting evidence is the possible presence of a clump
of stars at
V=15.5-16.0, which does not have a clear counterpart
in the field, and which makes the cluster an intermediate-age one.
If we use the age calibration from Carraro & Chiosi (2004),
for a
.
In addition, the cluster MS is significantly bluer and more tilted
than the field MS, which derives from the superposition
of stars of different reddening located at all distances.
Other interesting evidence is the possible presence of a clump
of stars at
V=15.5-16.0, which does not have a clear counterpart
in the field, and which makes the cluster an intermediate-age one.
If we use the age calibration from Carraro & Chiosi (2004),
for a ![]() (the magnitude difference between
the red clump and the TO) of 1.5 mag, we infer an age of around 1.2 billion
year. This estimate does not take into account the cluster metallicity,
and therefore is an estimation. In the following we
provide a more robust estimate of the age through a detailed
comparison with theoretical isochrones.
(the magnitude difference between
the red clump and the TO) of 1.5 mag, we infer an age of around 1.2 billion
year. This estimate does not take into account the cluster metallicity,
and therefore is an estimation. In the following we
provide a more robust estimate of the age through a detailed
comparison with theoretical isochrones.
Berkeley 75.
The TO is located at
![]() ,
and the clump
at
,
and the clump
at
![]() ,
thus implying a rough estimate for the age of around 3 billion
years. The overall morphology of the CMDs is less different from the
field than the previous cluster.
A significant binary population
seems to affect the TO shape, which appears at first glance
confused (see for comparison the CMDs in the middle
and upper panels).
,
thus implying a rough estimate for the age of around 3 billion
years. The overall morphology of the CMDs is less different from the
field than the previous cluster.
A significant binary population
seems to affect the TO shape, which appears at first glance
confused (see for comparison the CMDs in the middle
and upper panels).
Moreover, the field star contamination seems to be
important for this cluster, but it does not prevent us
from recognizing a probable clump
of stars located at V = 16, B-V = 1.2,
(V-I)= 1.4.
The field in the right panel also exhibits a clump, but it lies
along the MS at
(V-I) = 1.0.
If the Berkeley 75 clump mean magnitude is actually
around V=16,
this would imply a
distance modulus (m-M) of about 16 mag, according
to Salaris & Girardi (2002).
Berkeley 25.
The TO is located at ![]() 18.5, and the clump
at
18.5, and the clump
at ![]() 16.5, thus implying a rough estimate for the age
around 3.0 Gyr
year. The overall morphology of the CMDs is also in this case
very different from the
field CMD so this is a bona-fide cluster.
The same kind of argument we applied to the Berkeley 75 clump
holds for Berkeley 25, since also in this case the field exhibits
a star condensation at about the cluster
clump position.
16.5, thus implying a rough estimate for the age
around 3.0 Gyr
year. The overall morphology of the CMDs is also in this case
very different from the
field CMD so this is a bona-fide cluster.
The same kind of argument we applied to the Berkeley 75 clump
holds for Berkeley 25, since also in this case the field exhibits
a star condensation at about the cluster
clump position.
![\begin{figure}
\par\includegraphics[width=8cm,clip]{fig7.eps}
\end{figure}](/articles/aa/full/2005/42/aa3089-05/img41.gif) |
Figure 7: Isochrone solution for Berkeley 73. The solid lines are isochrones for the age of 1500 million year and metallicity Z=0.008. The apparent distance modulus is (m-M)=15.3, and the reddening E(B-V)=0.12 and E(V-I)=0.18. Only stars within the derived radius are shown. The dashed line in the left panel is a Z=0.019 isochrone for the age of 2 Gyr. See text for more details. |
| Open with DEXTER | |
Table 4: Fundamental parameters of the studied clusters. The coordinates system is such that the Y axis connects the Sun to the Galactic Center, while the X axis is perpendicular to that. Y is positive toward the Galactic anti-center, and X is positive in the first and second Galactic quadrants (Lynga 1982).
Our strategy is to survey different age and metallicity isochrones, attempting to provide the best fit of all the CMD features both in the V vs. (B-V) and in the V vs. (V-I) CMD.
![\begin{figure}
\par\includegraphics[width=8cm]{fig8.eps}
\end{figure}](/articles/aa/full/2005/42/aa3089-05/img48.gif) |
Figure 8: Isochrone solution for Berkeley 75. The isochrones (solid lines) are for the age of 3 Gyr and metallicity Z=0.004.The apparent distance modulus is (m-M)=15.2, and the reddening E(B-V)=0.08 and E(V-I)=0.13. Only stars within the derived radius are shown. The dashed line is a 3.5 Gyr, Z=0.008 isochrone. See text for more details. |
| Open with DEXTER | |
![\begin{figure}
\par\includegraphics[width=8cm]{fig9.eps}
\end{figure}](/articles/aa/full/2005/42/aa3089-05/img49.gif) |
Figure 9: Isochrone solution for Berkeley 25. The isochrones (solid lines) are for the age of 4 Gyr and metallicity Z=0.008. The apparent distance modulus is (m-M)=15.8 and the reddening E(B-V)=0.17 and E(V-I)=0.24. Only stars within the derived radius are shown. The dashed line is a 3.5 Gyr, Z=0.004 isochrone. See text for more details. |
| Open with DEXTER | |
![\begin{figure}
\par\includegraphics[width=6.5cm]{fig10.eps}
\end{figure}](/articles/aa/full/2005/42/aa3089-05/img50.gif) |
Figure 10: Age histogram of old open clusters. See text for details |
| Open with DEXTER | |
To further facilitate the fitting procedure we consider only the stars that lie within the cluster radius as derived in Sect. 3. Therefore, in the series of Figs. 7 to 9 we present the best fit we were able to achieve. Together with the best fit, we make estimates of uncertainties in the basic parameters derivation. These uncertainties reflect the range in the basic parameter that allows a reasonable fit to the clusters CMDs. In particular in the left panel of Figs. 7 to 9, we overlaid another isochrone to show the effect of assuming different combinations of age and metallicity. Error estimates are reported in Table 4.
To derive cluster distances from the reddening and apparent distance modulus,
a reddening law must be specified. In Fig. 6 we show that the normal extinction
law is valid for all the clusters, and therefore we use the relation
![]() to derive cluster distances.
The solid line
in Fig. 10 is the normal extinction
to derive cluster distances.
The solid line
in Fig. 10 is the normal extinction
![]() law, whereas the
dashed and dotted lines are
the luminosity class III and V ZAMS from Cousin (1978).
To limit the degrees of freedom of the whole
fit technique, we derived from FIRB maps
(Schlegel et al. 1998) the reddening in the direction of the clusters.
We obtained
E(B-V) = 0.18, 0.12 and 0.10 for Berkeley 73, Berkeley 75 and Berkeley 25,
respectively. Due to the cluster Galactic latitudes, these values
can be considered very reasonable.
law, whereas the
dashed and dotted lines are
the luminosity class III and V ZAMS from Cousin (1978).
To limit the degrees of freedom of the whole
fit technique, we derived from FIRB maps
(Schlegel et al. 1998) the reddening in the direction of the clusters.
We obtained
E(B-V) = 0.18, 0.12 and 0.10 for Berkeley 73, Berkeley 75 and Berkeley 25,
respectively. Due to the cluster Galactic latitudes, these values
can be considered very reasonable.
Berkeley 73.
The isochrone solution for this cluster is discussed in Fig. 7.
We consider here only the stars located within 1.5 arcmin from the cluster
center (see Sect. 2).
We obtained the best fit for an age of 1.5 Gyr and a metallicity
Z=0.008. The inferred
reddening and apparent distance modulus are
E(B-V)=0.12 (
E(V-I)=0.18)
and
(m-M)=15.3, respectively. As a consequence the cluster
is at a heliocentric distance of 9.7 kpc, and
is located at a Galactocentric distance of 16.4 kpc, assuming
8.5 kpc as the distance of the Sun to the Galactic Center.
The overall fit is very good, the detailed shape of the MS
and TO is reproduced, as is the color of the clump.
With respect to Ortolani et al. (2005) we find a significantly
younger age, due to our interpretation of the
group of stars at
![]() ,
,
![]() as a clump He-burning
stars. This choice is supported by the fact that we are selecting only stars
located well within the cluster radius, and this group of stars
lies very close to the cluster center, as expected for more massive stars
after mass segregation.
Looking carefully at the isochrone fitting in Ortolani et al. (2005, Fig. 9),
the isochrone poorly matches the low MS, below
as a clump He-burning
stars. This choice is supported by the fact that we are selecting only stars
located well within the cluster radius, and this group of stars
lies very close to the cluster center, as expected for more massive stars
after mass segregation.
Looking carefully at the isochrone fitting in Ortolani et al. (2005, Fig. 9),
the isochrone poorly matches the low MS, below
![]() ,
and is in general too red with respect to the mean locus of Berkeley 73 stars.
Also the color of the TO point is poorly matched. To achieve a better fit
a bluer (younger) isochrone is necessary.
,
and is in general too red with respect to the mean locus of Berkeley 73 stars.
Also the color of the TO point is poorly matched. To achieve a better fit
a bluer (younger) isochrone is necessary.
To address the effect of a possible variation of the cluster parameters due to a different
metallicity, in the left panel of Fig. 7 we superposed the best fit Z=0.019isochrone, which provides an age of 2 Gyr and a distance modulus
(m-M)=14.8. The fit is rather good in the MS, but the RGB is too blue,
as in Ortolani et al. (2005). A lower metallicity isochrone would
solve this problem.
Moreover the reddening value we get in this case is
![]() .
This value of the reddening is reasonable
for this combination of age and metallicity.
If the Ortolani et al. (2005) fit matched the TO color, it
would imply exactly such a reddening, and not the value they report.
.
This value of the reddening is reasonable
for this combination of age and metallicity.
If the Ortolani et al. (2005) fit matched the TO color, it
would imply exactly such a reddening, and not the value they report.
Therefore we favor a low metal content and a younger age (see Table 4). Moreover the set of Galactic coordinates that Ortolani et al. (2005) report is in error, due to the wrong Galactic l and b they assign to this cluster. Therefore the cluster does not lie in the fourth Galactic quadrant, but below the plane in the third quadrant.
Interestingly, a considerable binary fraction seems to be present in the
form of a parallel sequence redward of the cluster MS.
Berkeley 75. The isochrone solution for this cluster is discussed in Fig. 8. We obtained the best fit for an age of 3 Gyr and a metallicity Z=0.004. The inferred reddening and apparent distance modulus are E(B-V)=0.08 (E(V-I)=0.13)and (m-M)=15.2, respectively. As a consequence the cluster lies at 9.8 kpc from the Sun, and is located at a Galactocentric distance of 16.2 kpc toward the anti-center direction in the third Galactic quadrant. The overall fit is very good also in this case, the detailed shape of the MS and TO are closely reproduced, as is the color of the clump.
The reddening we derived is in close agreement with FIRB maps, which at the Galactic latitude of Berkeley 75 are reliable.
Also in this case we check the age-metallicity effect. Superposed on the left panel of Fig. 8 is a Z=0.008 isochrone for the age of 3.5 Gyr, which produces the best fit to the bulk of Berkeley 75 stars. By assuming this combination of age and metallicity, the derived distance modulus is (m-M)=14.9, and the reddening E(B-V) = 0.00. By increasing the metallicity more an untenable negative reddening would be necessary to get a good fit. We therefore conclude that the best fit metallicity is Z=0.004, which yields the parameter set reported in Table 4.
Berkeley 25. The isochrone solution for this cluster is shown in Fig. 9. We obtained the best fit for an age of 4 Gyr and a metallicity Z=0.008. The inferred reddening and apparent distance modulus are E(B-V)=0.17 (E(V-I)=0.24)and (m-M)=15.8, respectively. Therefore the cluster has a heliocentric distance of 11.3 kpc, and is located at a Galactocentric distance of 16.8 kpc. The overall fit is very good also in this case, the detailed shape of the MS and TO are well reproduced, as is the color of the clump. The reddening we derived is in close agreement with FIRB maps.
In the left panel of the same figure we overlaid a metal poorer (Z=0.004)
isochrone for the age of 3.5 Gyr. This isochrone provides a good fit
as well, with a distance modulus
(m-M)=16.2 and a reddening
E(B-V)=0.35.
However, since FIRB maps support a much lower reddening, we tend to favour
here the higher metallicity solution, which provides a more reasonable reddening
value.
All these clusters are very interesting because of their position so far away from the Galactic center. We only known a few clusters located so distant from the center of the Galaxy (Villanova et al. 2005), and therefore they are crucial targets for spectroscopic follow-up. Also, Berkeley 25 is one of the old open clusters located at the highest Galactic latitude (see Table 4; and Friel 1995).
The fundamental findings of this paper are:
They may be very useful to trace the slope of the Galactic disk radial abundance gradient and to probe the chemical properties and the structure of the disk in its outskirts, in a region dominated by the Galactic warp and/or the recently discovered Canis Major over-density.
If we make use of the provisional photometric estimates
presented in this paper, we obtain that all the clusters
are consistent
with the most recent slope of the gradient in the
3-4 Gyr and ![]() 2 Gyr bins, as derived by Friel et al. (2002).
2 Gyr bins, as derived by Friel et al. (2002).
Further studies therefore should concentrate on the confirmation of the clusters' metal content by means of a detailed abundance analysis of the clump stars.
Finally, Berkeley 75 and Berkeley 25 are very interesting clusters because they fall in an age range where only a few clusters are known (see the discussion in Ortolani et al. 2005). The authors show the age distribution of 103 old open clusters. The ages they use are highly inhomogeneous, since they come from a variety of different sources. This fact however does not seem to change significantly the overall conclusions on the possible existence of a peak at 5 Gyr with respect to the previous analysis on the same subject conducted by Friel (1995) using a smaller but homogeneous sample. This might mean that the level of inhomogeneity in the ages is not very important.
If we include the two new clusters Berkeley 75 and Berkeley 25, Berkeley 22 and Berkeley 66 (around 3-4 Gyr old, Villanova et al. 2005) and Berkeley 29 (4 Gyr, Carraro et al. 2004), for which we report new estimates of the age, the dip that Ortolani et al. (2005) report in the old open clusters age distribution (their Fig. 11) becomes less prominent, and the reality of a peak at 5 Gyr less significant. The new age distribution is shown in Fig. 10, where we consider all the clusters reported by Ortolani et al. (2005, solid line) and add a few more clusters (dashed line).
It is quite probable that more clusters will be discovered in this age range.
This simply suggests that the completeness of the sample and homogeneity of the ages are crucial issues that have to be carefully taken into account before drawing conclusions on the star formation history of the Galactic disk using old open clusters.
Acknowledgements
The observations presented in this paper were carried out at Cerro Tololo Interamerican Observatory CTIO (Chile). CTIO is operated by the Association of Universities for Research in Astronomy, Inc. (AURA), under a cooperative agreement with the National Science Foundation as part of the National Optical Astronomy Observatory (NOAO). The work of G.C. is supported by Fundación Andes. D.G. gratefully acknowledges support from the Chilean Centro de Astrofísica FONDAP No. 15010003. This workhas been also developed in the framework of the Programa Científico-Tecnológico Argentino-Italiano SECYT-MAE Código: IT/PA03 - UIII/077 - período 2004-2005. A.M. acknowledges support from FCT (Portugal) through grant SFRH/BPD/19105/2004. This study made use of Simbad and WEBDA databases.