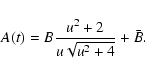
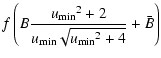
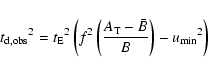
A&A 442, 501-505 (2005)
DOI: 10.1051/0004-6361:20053462
Source blending effects on microlensing time-histograms and optical depth determination
Y. Alibert 1,2 - G. Chabrier 2 - G. Massacrier 2
1 - Physikalisches Institut, University of Bern, Sidlerstrasse 5, 3012 Bern, Switzerland
2 -
C.R.A.L (UMR 5574 CNRS),
École Normale Supérieure, 69364 Lyon Cedex 07, France
Received 18 May 2005 / Accepted 28 June 2005
Abstract
Source blending in microlensing experiments is known to modify the Einstein time of the observed events.
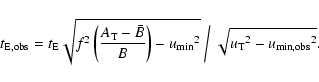
In this paper, we have conducted Monte-Carlo calculations, using analytical relationships
to quantify the effect of blending on the observed event time distribution and optical depth. We show that short events are affected
significantly by source blending and that, for moderately blended sources, the optical depth  is globally overestimated,
because of an underestimation of the exposure. For high blending situations, on the other hand, blending leads to an underestimation of the optical depth. Our results are in agreement with the most recent optical depth determinations toward the Galactic Center of the
MACHO and OGLE-II collaborations
that use clump giants (less affected by the blending effect) as sources.
The blending-corrected, lower optical depth toward the Galactic Bulge is now in good agreement with the value inferred from
galactic models, reconciling theoretical and observational determinations.
is globally overestimated,
because of an underestimation of the exposure. For high blending situations, on the other hand, blending leads to an underestimation of the optical depth. Our results are in agreement with the most recent optical depth determinations toward the Galactic Center of the
MACHO and OGLE-II collaborations
that use clump giants (less affected by the blending effect) as sources.
The blending-corrected, lower optical depth toward the Galactic Bulge is now in good agreement with the value inferred from
galactic models, reconciling theoretical and observational determinations.
Key words: Galaxy: stellar content - galaxies: structure - gravitational lensing
Microlensing is one of the most efficient ways to measure the amount of (sub)stellar matter, dark or luminous, in our Galaxy.
By measuring the amplification
of the flux of a source star, one can statistically derive the mass, distance and transverse velocity of the deflector.
When a deflector passes near the line of sight between the observer and the source,
the flux of the source is amplified by a factor (Paczynski 1986)
if the origin of time is taken at the moment of maximum amplification.
The light curve depends on two parameters only,
 and
and
 ,
where
is the minimum impact parameter
(the minimum distance to the line
of sight,
normalized to the Einstein radius of the lens
,
where
is the minimum impact parameter
(the minimum distance to the line
of sight,
normalized to the Einstein radius of the lens
 ), and
is the Einstein time, i.e. the time required to cross the Einstein radius.
), and
is the Einstein time, i.e. the time required to cross the Einstein radius.
The Einstein radius is given by the lens mass M, the observer-source distance Land the ratio x of the lens-observer distance to L:
When a microlensing event occurs, a theoretical light curve is ajusted to give
and
:
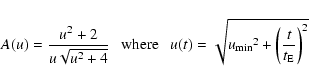
is related to the maximum amplification
by
 ,
where the function f is defined by
,
where the function f is defined by
 .
The Einstein time is obtained from theevent duration
.
The Einstein time is obtained from theevent duration
 during which
 (where
 is the threshold amplification,
usually taken as
is the threshold amplification,
usually taken as
 ,
which corresponds to
,
which corresponds to
 )
by:
)
by:
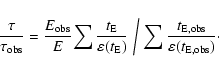
The observed optical depth is estimated from the Einstein times of the events as (Alcock et al. 1997):
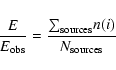
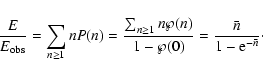
where E is the exposure, i.e. the number of observed sources
times the duration of the experiment (in stars  years), and
 is the detection efficiency.
This optical depth can be compared with the one obtained from galactic models using
is the detection efficiency.
This optical depth can be compared with the one obtained from galactic models using
 |
(1) |
for a constant observer-source distance, where  is the galactic mass density distribution.
A long-standing unsolved problem concerning the microlensing
experiments towards the Galactic bulge is the significant discrepancy between the optical depths derived from microlensing experiments and the one
calculated from theoretical models, as identified originally by Kiraga & Paczynski (1994).
Using Difference Image Analysis, and using main sequence stars as microlensing sources,
the MACHO project(Alcock et al. 2000)
deduced an optical depth
 at
at  with 99 observed events, where
 .
The OGLE collaboration derived
.
The OGLE collaboration derived
 at
with 9 observed events
(Udalski et al. 1994). More recently, the MOA collaboration has determined an optical depth
at
with 9 observed events
(Udalski et al. 1994). More recently, the MOA collaboration has determined an optical depth
 (Sumi et al. 2003).
On the other hand, all Galactic models predict a typical optical depth
 (see for example
Peale 1998;
Bissantz et al. 1997).
As shown by Peale (1998),
one can reproduce the observed optical depth only if the bulge mass is equal to
(see for example
Peale 1998;
Bissantz et al. 1997).
As shown by Peale (1998),
one can reproduce the observed optical depth only if the bulge mass is equal to
 ,
whereas gas dynamics calculations based on DIRBE observations to derive the gravitational potential of our Galaxy
yield a maximum mass for the bulge
,
whereas gas dynamics calculations based on DIRBE observations to derive the gravitational potential of our Galaxy
yield a maximum mass for the bulge
 (Bissantz et al. 1997;
Englmaier et al. 1999; Sevenster et al. 1999).
More recently, Han & Gould (2003) derived an optical depth
(Bissantz et al. 1997;
Englmaier et al. 1999; Sevenster et al. 1999).
More recently, Han & Gould (2003) derived an optical depth
 ,
for events due to bulge
stars, and
,
for events due to bulge
stars, and
 when including the events due to the disk.
Using brighter stars (in particular red clump giants), the MACHO and the OGLE-II collaborations have derived new optical depth determinations, namely
 for 62 events
for the MACHO group (Popowski et al. 2004), and
for 62 events
for the MACHO group (Popowski et al. 2004), and
 for 33 events for the
OGLE-II group (Sumi et al. 2005). These values, closer to the theoretical expectations,
are significantly lower than the aforementioned ones based on main sequence star sources. This raises two important questions:
1) what is the origin of the systematic discrepancy between optical depth measured using faint (main sequence)
and bright (clump giant) stars; and 2) which one should be compared with theoretical calculations.
We demonstrate here that this difference is largely due to blending effects, and that the
optical depth measured using main sequence stars is systematically biased.
for 33 events for the
OGLE-II group (Sumi et al. 2005). These values, closer to the theoretical expectations,
are significantly lower than the aforementioned ones based on main sequence star sources. This raises two important questions:
1) what is the origin of the systematic discrepancy between optical depth measured using faint (main sequence)
and bright (clump giant) stars; and 2) which one should be compared with theoretical calculations.
We demonstrate here that this difference is largely due to blending effects, and that the
optical depth measured using main sequence stars is systematically biased.
Microlensing experiments are subject to different biases such as source blending (when the observed lensed source
is blended with other unresolved stars), lens blending (when the lens is a luminous star, its own luminosity
may affect the observed light curve), and amplification bias (the amplified source is a star below the detection limit
close to another star above the detection limit).
Lens blending has been adressed by Han (1998);
the effect is found to result in an underestimation of the real optical depth by 
 .
Amplification bias also has been studied by Han (1997):
its effect
is an overestimation of the optical depth by a factor
1.7 + 0.7 -0.4, depending on the size of the seeing disk.
Alard (1997)
studied source blending
by taking it into account directly in Eq. (1). The effect on the optical depth is an overestimation of
.
Amplification bias also has been studied by Han (1997):
its effect
is an overestimation of the optical depth by a factor
1.7 + 0.7 -0.4, depending on the size of the seeing disk.
Alard (1997)
studied source blending
by taking it into account directly in Eq. (1). The effect on the optical depth is an overestimation of 
 ,
but
the effect on
-histograms was not quantified.
In this paper, we study in detail the afore mentioned first kind of blending, i.e. when the amplified source is a star
above the detection limit, blended with a star above the detection limit.
,
but
the effect on
-histograms was not quantified.
In this paper, we study in detail the afore mentioned first kind of blending, i.e. when the amplified source is a star
above the detection limit, blended with a star above the detection limit.
In the case of source blending, an observed source is the superposition of different source stars, all above the detection limit.
When an event occurs, only one of the stars composing the observed source will be amplified, in general![[*]](/icons/foot_motif.gif) . The observed flux is no longer the baseline flux multiplied by the amplification,
but instead, if one notes
. The observed flux is no longer the baseline flux multiplied by the amplification,
but instead, if one notes
 as the flux of the amplified source and
 the flux of the other unresolved sources,
It is very difficult to account
correctly for this effect for, as shown by Han (1999),
there is an almost perfect degeneracy between unblended and blended light curves. Moreover, it is very difficult to
determine the amount of blending by photometrical means (see Wozniak & Paczynski 1997).
Nevertheless, using
the astrometric shift during a microlensing event,
Goldberg & Wozniak (1998)
have shown that about half of the sources observed by the OGLE collaboration suffer some amount of blending.
To quantify the effect of source blending on the duration
of a microlensing event and on the inferred optical depth,
we first outline in Sect. 2 the relations between
and
with
and without blending. In Sect. 3, we derive the distribution function to be used for blending. The consequences on the Einstein time histograms
and on the optical depth are examined in Sects. 4 and 5, respectively.
Section 6 is devoted to the conclusions.
We will follow the previous calculations by Han (1999)
with slightly different notations.
When a star suffers blending, the total observed flux is the sum of the flux from the source
and the flux from the
other unresolved stars
.
We define the dimensionless parameters B as
 and
and
 .
.
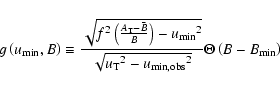
The observed amplification of a microlensing event thus reads:
Using the observed light curve, one can derive some quantities, such as the impact parameter or the duration of the event.
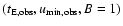
We will label "obs'' the quantities derived when one supposes that B=1 (i.e. when one ignores that
the source is blended). The quantities corrected for blending will be called "true'',
and will have no index.
The observed impact parameter
 is
is
so that the duration of the event
is underestimated.
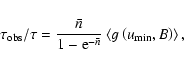
We can then relate
the observed Einstein time to the true Einstein time, the true impact parameter and
the amount of blending by:
 |
(2) |
These relations allow us to relate the "observed'' and "real'' quantities, for a known amount of blending.
As shown by Han (1999),
the curves characterized by
 and the corresponding
 lie very close to each other, and the difference is smaller than the observational errors.
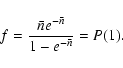
In order to estimate the effect of blending, one needs to know the distribution function (DF) of the blending factor B.
We first need to estimate the number of stars whose projection lies inside a small surface  .
For that purpose, we suppose that the projected
density of stars is constant and that the stars are distributed randomly.
By doing so, we neglect all systematic effects in the spatial distribution
of stars. Note that this approximation is used by the MACHO group to compute
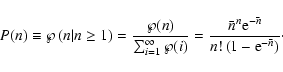
their detection efficiency toward the LMC (Alcock et al. 2001).
Then, the probability that there are n stars inside
is given by
the Poisson law:
.
For that purpose, we suppose that the projected
density of stars is constant and that the stars are distributed randomly.
By doing so, we neglect all systematic effects in the spatial distribution
of stars. Note that this approximation is used by the MACHO group to compute
their detection efficiency toward the LMC (Alcock et al. 2001).
Then, the probability that there are n stars inside
is given by
the Poisson law:
 ,
where
,
where  is the mean number of stars lying inside .
The second step is to calculate the probability that there are n stars inside the seeing disk, of surface ,
of
an observed source. This probability P(n) is the probability that there are n stars inside ,
knowing that there is at least one star inside .
We thus have
The only free parameter in this law is ,
the mean number of stars inside a seeing disk.
This parameter depends on the size of the seeing disk, and we will usually
take
 ,
which ensures that
half of the observed sources are unblended (i.e.
P(1) = 0.5), as inferred by Goldberg & Wozniak (1998)
from the OGLE data. Once the number
is given,
and
are randomly determined for a given bulge luminosity function (LF).
,
which ensures that
half of the observed sources are unblended (i.e.
P(1) = 0.5), as inferred by Goldberg & Wozniak (1998)
from the OGLE data. Once the number
is given,
and
are randomly determined for a given bulge luminosity function (LF).
For this latter, we use the LF obtained towards Baade's Window with the Hubble Space Telescope (HST) (Holtzman et al. 1998).
Since there are very few observed bright stars, we have proceeded
as follows to obtain a combined LF: for bright stars (V<18.5) the HST LF is
matched to a power law function, with a -2 exponent.
We restrict our calculations to sources fainter than
 ,
which corresponds to the
majority of observed sources (Alcock et al. 1997),
and we performed calculations
with different values of this parameter (
,
which corresponds to the
majority of observed sources (Alcock et al. 1997),
and we performed calculations
with different values of this parameter (
 ranging from 15.5 to 16.5).
The faint cutoff
 is more difficult to determine. We tried different limiting
magnitudes between V=21.5 and V=22.5,
which correspond to the lower cutoff of the MACHO LF (Alcock et al. 1997).
Since we are only concerned by source
blending and not by amplification bias, there is no effect arising from the part of the LF below the detection limit.
is more difficult to determine. We tried different limiting
magnitudes between V=21.5 and V=22.5,
which correspond to the lower cutoff of the MACHO LF (Alcock et al. 1997).
Since we are only concerned by source
blending and not by amplification bias, there is no effect arising from the part of the LF below the detection limit.
Blending affects the Einstein time histogram in two different ways.
The first one is to decrease
to
 (Eq. (2)).
The second one is to reduce the number of observed events:
if the maximum amplification is lower than the threshold amplification, the event is missed. This occurs if B is lower than
(Eq. (2)).
The second one is to reduce the number of observed events:
if the maximum amplification is lower than the threshold amplification, the event is missed. This occurs if B is lower than
 ,
where
is a function of
:
,
where
is a function of
:
The Einstein time histograms are calculated using a Monte-Carlo code originally developed by Chabrier & Méra
(Méra et al. 1998).
We have simulated 107 events which result, once including detection efficiency, in about 106 observed events.
The Galactic model (model 1) used in the calculations is the following:
a bar-shaped bulge with a density
given by the model of Zhao (1996).
The bar is in the plane of the disk, with an angle
 with respect to
the Sun-Galactic center line, the near end of the bar lying in the first quadrant.
The bulge mass is taken to be
with respect to
the Sun-Galactic center line, the near end of the bar lying in the first quadrant.
The bulge mass is taken to be
 .
.
The bar rotates rigidly with an angular speed
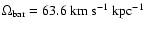 ,
the velocity dispersion is
,
the velocity dispersion is
 in all directions.
The model of the disk is a classical double exponential disk (Bahcall & Soneira 1980),
with a scale length
in all directions.
The model of the disk is a classical double exponential disk (Bahcall & Soneira 1980),
with a scale length
 pc and
a scale height h=300 pc. The local normalization of the disk is
pc and
a scale height h=300 pc. The local normalization of the disk is
 .
The rotation velocity is
.
The rotation velocity is
 and the isotropic velocity dispersion is
 .
The velocity distribution of each star is assumed to be Gaussian, with the mean velocity equal to
the rotation velocity and the afore mentioned dispersions.
The Sun is in the galactic plane, at a distance of
.
The velocity distribution of each star is assumed to be Gaussian, with the mean velocity equal to
the rotation velocity and the afore mentioned dispersions.
The Sun is in the galactic plane, at a distance of  kpc from the Galactic center. Its velocity is equal to that of
the local standard of rest,
kpc from the Galactic center. Its velocity is equal to that of
the local standard of rest,
 .
The visibility function of the sources is the one used
by Kiraga & Pacsynski (1994),
with
.
The visibility function of the sources is the one used
by Kiraga & Pacsynski (1994),
with
 .
The mass function is the one derived by Méra et al. (1998).
.
The mass function is the one derived by Méra et al. (1998).
We stress that the aim of the present paper is not to examine the validity of
different galactic models, but to study the effect of source blending on
the microlensing event time distribution and optical depth.
To compute the time-histograms, we also need to take into account the detection efficiency.
We used the clump giant efficiency toward the bulge:
this efficiency is equal to the sampling efficiency and is not corrected for blending
(Alcock et al. 1997).
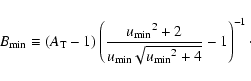
Figure 1 shows the effect of blending on the theoretical histogram
(fraction of events as a function of the Einstein time) for different values of
in the Poisson distribution function of B (Sect. 3).
As expected, the effect of blending is to decrease the mean Einstein time when the fraction of unblended stars f decreases.
At the maximum of the histogram (between 4 and 6 days), there are  more events in the case of the Poisson DF (
 )
compared to the
unblended histogram. This difference increases in the short-time region, and reaches
)
compared to the
unblended histogram. This difference increases in the short-time region, and reaches  for
for
 days, but due to the decrease of the efficiency,
there are very few observed events in this region. The mean Einstein time is
to
lower
for the three Poisson DF.
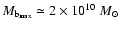
If we convert this difference into a mean lens mass (
days, but due to the decrease of the efficiency,
there are very few observed events in this region. The mean Einstein time is
to
lower
for the three Poisson DF.
If we convert this difference into a mean lens mass (
 ),
we obtain a difference larger than
),
we obtain a difference larger than  between the unblended case and
the Poisson law, i.e. the observed mean mass (derived from observations assuming that there is no blending) and the real mean mass
(that could be derived from observations if one knows the amount of blending)
i.e.
between the unblended case and
the Poisson law, i.e. the observed mean mass (derived from observations assuming that there is no blending) and the real mean mass
(that could be derived from observations if one knows the amount of blending)
i.e.
 .
.
![\begin{figure}
\par\includegraphics[width=8cm,height=8.2cm,clip]{3462fig1.eps}
\end{figure}](/articles/aa/full/2005/41/aa3462-05/Timg82.gif) |
Figure 1:
Einstein time histogram for differents amounts of blending.
The curves give the relative number of short time events (below 66 days), binned in one-day time intervals.
The curves are computed assuming a Poisson law with different values of
corresponding to different fractions of unblended stars (f). |
| Open with DEXTER |
5 The observed optical depth
Source blending has three effects on the estimation of the optical depth .
The first one is to lower
,
which tends to underestimate the optical depth. The second one, as we just showed, is to
underestimate the exposure (when a single source is thought to be observed, there are in fact
many sources that may be lensed), which tends to overestimate the optical depth. The last one is
due to the efficiency
which, depending on the variations of the efficiency with
,
can
either underestimate or overestimate .
In order to quantify the resulting global effect, we performed the same Monte-Carlo calculations as described previously.
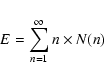
We first need to relate the true exposure to the observed one. If n(i) is the real number of sources
inside the observed source i, the ratio of the true to the observed exposure is given by:
where
 is the number of monitored sources. The true exposure is given by
where
 is the number of observed sources composed
of n blended sources. Therefore
is the number of observed sources composed
of n blended sources. Therefore
It is then straightforward to compute the ratio of the observed optical depth to the real optical depth,
for a given DF of the blending B. The luminosity of the source is
calculated for each event with the bulge LF. Then, knowing the real number n(i) of sources, we can calculate the amount of blending.
The ratio of the true to observed optical depth thus reads:
Figure 2 shows the ratio
 for different values of the fraction of unblended stars f.
f is related to the parameter of the Poisson law by
for different values of the fraction of unblended stars f.
f is related to the parameter of the Poisson law by
In order to test the sensitivity of this ratio to the Galactic model, we have performed the same calculations
for two other models. Model 2 is obtained by changing only the bar angle (set to
 ),
the mass of the bulge (
),
the mass of the bulge (
 )
and the disk scale length (
)
and the disk scale length (
 ), while the local
normalization of the disk
), while the local
normalization of the disk
 is unchanged.
Model 3 is obtained by changing the velocity parameters:
is unchanged.
Model 3 is obtained by changing the velocity parameters:
 ,
,
 and
and
 .
As seen in Fig. 2,
the ratio
.
As seen in Fig. 2,
the ratio
 is not very sensitive
to the Galactic model. This was expected since, forgeting the
term,
is not very sensitive
to the Galactic model. This was expected since, forgeting the
term,
 with
with
where  is the Heaviside function (equal to 0 for a negative argument).
Then the ratio
is the Heaviside function (equal to 0 for a negative argument).
Then the ratio
 can be written:
which is independent of the galactic model.
The ratio is also quite insensitive to the cutoff values of the LF since all the curves in the case of model 1 are very close to each other and
the differences are of the order of the errors in the Monte-Carlo calculations.
The effect of blending is to overestimate the optical depth, for each of the three models considered.
The ratio of the true optical depth to the observed one can reach  .
This result is consistent with the one derived by Alard (1997)
using a different mehod. By taking into account the blending directly in Eq. (1), he found an overestimation of ,
whereas
we obtain
for f= 0.5.
.
This result is consistent with the one derived by Alard (1997)
using a different mehod. By taking into account the blending directly in Eq. (1), he found an overestimation of ,
whereas
we obtain
for f= 0.5.
We can relate our results to the last determinations of the optical depth using clump giant stars as sources.
Popowski et al. (2004) argue that, using clump giant and Differential Image Analysis, they can derive
an optical depth with no blending effect. This comes from the fact that, due to their luminosity, clump giant stars
are unlikely to suffer large amounts of blending. Note, however, that Sumi et al. (2005) suggest that
even clump giant stars can suffer some amount of blending, at least in the OGLE-II sample.
Using the last MACHO value as the true optical depth, the
corresponding observed optical depth for blended sources, assuming a Poisson law with
 ,
would be
,
would be
 ,
compatible with the value obtained from main sequence sources,
(Alcock
et al. 2000).
,
compatible with the value obtained from main sequence sources,
(Alcock
et al. 2000).
Note that for very crowded fields,
 ,
the ratio
is greater than one, so that in that case blending effects yield an underestimation
of the optical depth.
,
the ratio
is greater than one, so that in that case blending effects yield an underestimation
of the optical depth.
![\begin{figure}
\par\includegraphics[width=7.5cm,height=8cm,clip]{3462fig2.eps}
\end{figure}](/articles/aa/full/2005/41/aa3462-05/Timg107.gif) |
Figure 2:
Ratio
as a function of the unblended source fraction for different values of the LF cutoff.
Standard values are
 and
and these values are assumed except when indicated by the legend.
Triangles and circles are computed using the same LF as the continuous line, but with model 2 and model 3 (see text).
and
and these values are assumed except when indicated by the legend.
Triangles and circles are computed using the same LF as the continuous line, but with model 2 and model 3 (see text). |
| Open with DEXTER |
We have shown in this paper that blending can have an important effect both on the Einstein time histograms and
the inferred optical depth.
For
histograms, the effect is to lower the observed
and then to decrease
the derived mean lens mass.
The change in the histogram is about
in the low-
region
corresponding to the maximum of the expected histogram, and can decrease substantially
the inferred mean lens mass (the difference can reach ).
For the optical depth, we have shown that, for all values considered for ,
the effect
is to overestimate the optical depth as a result of an underestimation of the exposure.
In the case of the Poisson law we used, with an unblended fraction around ,
this effect can reach .
These results are quite insensitive to the cutoff of the LF and to the galactic model. We note, however, that in the case of very high blending,
for
,
the effect of blending is to underestimate the optical depth. This can occur for microlensing experiments towards very crowded fields,
like M 31 (AGAPE project, Ansari et al. 1997,
and references therein).
Finally, to relate the observed optical depth to the one derived from different models,
it is necessary to combine these results with the effect of other biases, like lens blending
(Han 1998)
and amplification bias (Han 1997;
Alard 1997).
The effect of lens blending is to underestimate the optical depth by about ,
which can cancel, at least in part, the effect of source blending derived presently in the case of moderate blending (for the Poisson law used
in these calculations, this corresponds to an unblended fraction larger than  ).
For the amplification bias, Han (1997)
has shown that the effect would be to overestimate the optical depth. Therefore, the net effect of the various blending effects is very likely to overestimate the correct optical depth by a substantial fraction.
Taking blending effects into account brings into agreement the optical depth
derived with main sequence sources (Alcock et al. 2000;
Udalski et al. 1994), the one derived using brighter stars
(Popowski et al. 2004; Sumi et al. 2005) and the one
derived
from usual Galactic models
(Bissantz et al. 1997;
Englmaier et al. 1999; Sevenster et al. 1999) at the 2
).
For the amplification bias, Han (1997)
has shown that the effect would be to overestimate the optical depth. Therefore, the net effect of the various blending effects is very likely to overestimate the correct optical depth by a substantial fraction.
Taking blending effects into account brings into agreement the optical depth
derived with main sequence sources (Alcock et al. 2000;
Udalski et al. 1994), the one derived using brighter stars
(Popowski et al. 2004; Sumi et al. 2005) and the one
derived
from usual Galactic models
(Bissantz et al. 1997;
Englmaier et al. 1999; Sevenster et al. 1999) at the 2 level, and thus reconciles
experimental and theoretical determinations without drastic changes in galactic modelling.
Further observational determinations of the exact
amount of blending are needed to determine precisely
the net effect of blending.
level, and thus reconciles
experimental and theoretical determinations without drastic changes in galactic modelling.
Further observational determinations of the exact
amount of blending are needed to determine precisely
the net effect of blending.
- Ansari, R.,
Auriere, M., Baillon, P., et al. 1997, A&A, 324, 843 [NASA ADS] (In the text)
- Alard, C. 1997,
A&A, 321, 424 [NASA ADS] (In the text)
- Alcock, C.,
Allsman, R. A., Alves, D., et al. 1997, ApJ, 479, 119 [NASA ADS] [CrossRef] (In the text)
- Alcock, C.,
Allsman, R. A., Alves, D. R., et al. 2000, ApJ, 541, 734 [NASA ADS] [CrossRef] (In the text)
- Alcock, C.,
Allsman, R. A., Alves, D. R., et al. 2001, ApJS, 136, 439 [NASA ADS] [CrossRef] (In the text)
- Bahcall, J.,
& Soneira, R. 1980, ApJS, 44, 73 [NASA ADS] [CrossRef] (In the text)
- Bissantz, N.,
Englmaier, P., Binney, J., & Gerhard, O. 1997, MNRAS, 289,
651 [NASA ADS] (In the text)
- Englmaier,
P., & Gerhard, O. 1999, MNRAS, 304, 512 [NASA ADS] [CrossRef] (In the text)
- Goldberg, D.
M., & Wozniak, P. R. 1998, Acta Astron., 48, 19 [NASA ADS] (In the text)
- Gould, A., Bahcall,
J. N., & Flynn, C. 1997, ApJ, 482, 913 [NASA ADS] [CrossRef]
- Han, C. 1997, ApJ, 484,
555 [NASA ADS] [CrossRef] (In the text)
- Han, C. 1998, ApJ, 500,
569 [NASA ADS] [CrossRef] (In the text)
- Han, C. 1999, MNRAS, 309,
373 [NASA ADS] [CrossRef] (In the text)
- Han, C., & Gould, A.
2003, ApJ, 592, 172 [NASA ADS] [CrossRef]
- Holtzman, J.
A., Watson, A. M., Baum, W. A., et al. 1998, AJ, 115, 1946 [NASA ADS] [CrossRef] (In the text)
- Kiraga, M., &
Paczynski, B. 1994, ApJ, 430, L101 [NASA ADS] [CrossRef] (In the text)
- Mera, D., Chabrier, G.,
& Schaeffer, R. 1998, A&A, 330, 937 [NASA ADS] (In the text)
- Paczynski, B.
1986, ApJ, 304, 1 [NASA ADS] [CrossRef] (In the text)
- Peale, S. J. 1998,
ApJ, 509, 177 [NASA ADS] [CrossRef] (In the text)
- Popowski, P.
K., Griest, C. L., Thomas, et al. 2004
[arXiv:astro-ph/0410319]
(In the text)
- Sevenster,
M., Saha, P., Valls-Gabaud, D., & Fux, R. 1999, MNRAS307,
584
(In the text)
- Sumi, T., Abe, F.,
Bond, I. A., et al. 2003, ApJ, 591, 204 [NASA ADS] [CrossRef] (In the text)
- Sumi, T., P. R.,
Wozniak, A., Udalski, et al. 2005
[arXiv:astro-ph/0502363]
(In the text)
- Udalski, A.,
Szymanski, M., Stanek, K. Z., et al. 1994, Acta Astron., 44,
165 [NASA ADS] (In the text)
- Wozniak, P. R.,
& Paczynnski, B. 1997, ApJ, 487, 55 [NASA ADS] [CrossRef] (In the text)
- Zhao, H. S. 1996,
MNRAS, 283, 149 [NASA ADS] (In the text)
Copyright ESO 2005
![\begin{figure}
\par\includegraphics[width=8cm,height=8.2cm,clip]{3462fig1.eps}
\end{figure}](/articles/aa/full/2005/41/aa3462-05/img82.gif)
![\begin{figure}
\par\includegraphics[width=7.5cm,height=8cm,clip]{3462fig2.eps}
\end{figure}](/articles/aa/full/2005/41/aa3462-05/img107.gif)