![\begin{figure}
\par\includegraphics[width=7.7cm,clip]{2476fig1.eps} %
\end{figure}](/articles/aa/full/2005/41/aa2476-04/img148.gif) |
Figure 1:
Reduced |
| Open with DEXTER | |
In the text
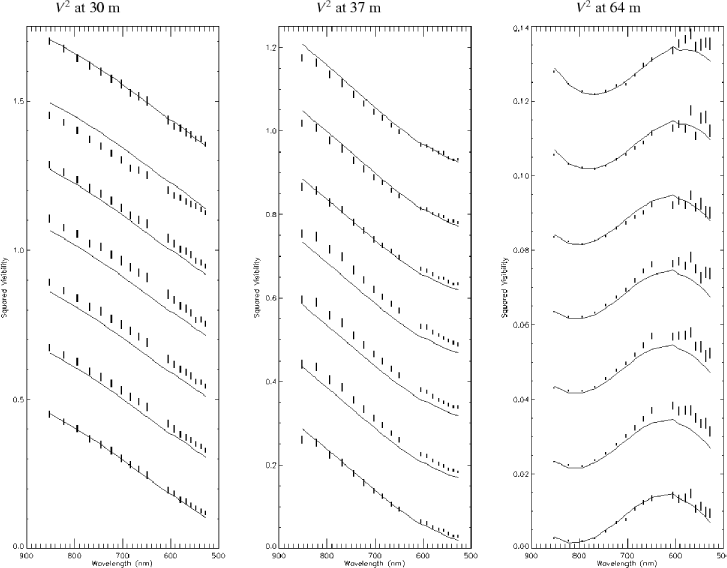 |
Figure 2:
Squared visibilities V2 and corresponding errors
versus the wavelength for the seven NPOI scans (see
Sect. 2). Solid curves correspond to theoretical
values obtained from our best model from the |
| Open with DEXTER | |
In the text
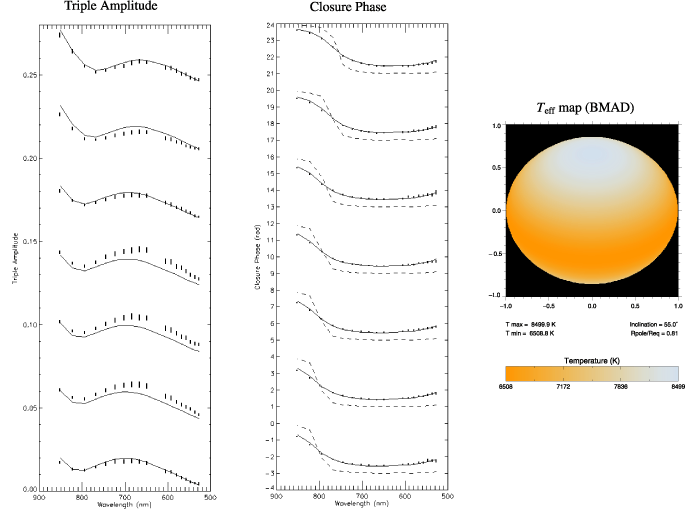 |
Figure 3:
Triple amplitudes
|
| Open with DEXTER | |
In the text
![\begin{figure}
\par\includegraphics*[width=12.5cm,clip]{2476fig4.eps} %
\end{figure}](/articles/aa/full/2005/41/aa2476-04/img160.gif) |
Figure 4:
Squared visibilities V2 (triangles) and corresponding
error bars from VLTI-VINCI (H and K bands) and PTI (K band;
baselines 85 m and 110 m) as described in Sect. 2.
The abscissa is an index (integer number) to label each group of
V2 data. The crosses correspond to theoretical V2 obtained
from the model with minimum |
| Open with DEXTER | |
In the text
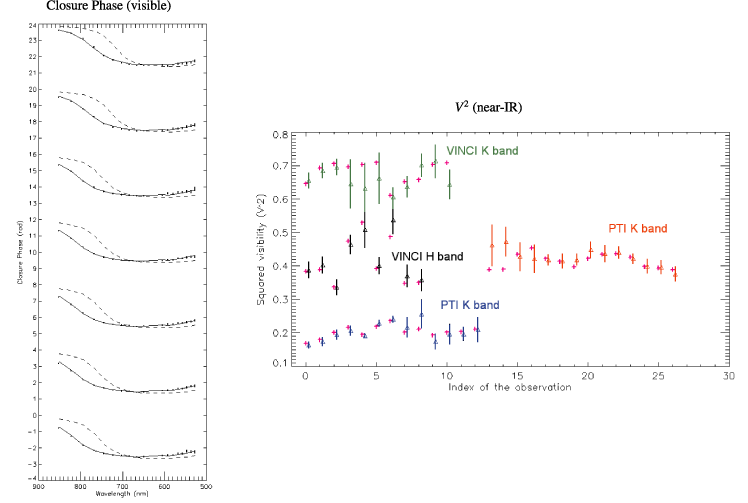 |
Figure 5:
The left panel shows the closure phases
|
| Open with DEXTER | |
In the text