A&A 441, 181-194 (2005)
DOI: 10.1051/0004-6361:20042149
S. Casassus 1 - O. Stahl 2 - T. L. Wilson3,4
1 - Departamento de Astronomía, Universidad de Chile,
Casilla 36-D, Santiago, Chile
2 -
Landessternwarte Königstuhl, 69117 Heidelberg, Germany
3 -
ESO, Karl-Schwarzschild-Str. 2, 85748 Garching bei
München, Germany
4 -
Max-Planck-Institut für Radioastronomie, Postfach 2024, 53010 Bonn, Germany
Received 8 October 2004 / Accepted 2 June 2005
Abstract
The 12C/13C isotope ratio is a tracer of
stellar yields and the efficiency of mixing in the ISM.
12CH+/13CH+ is not affected by interstellar
chemistry, and is the most secure way of measuring 12C/13C
in the diffuse ISM. R=12C/13C is 90 in the solar system.
Previous measurements of 12CH
![]() 3957.7,4232.3
and 13CH
3957.7,4232.3
and 13CH
![]() 3958.2,4232.0 absorption toward
nearby stars indicate some variations in 12C/13C, with
values ranging from 40 to 90 suggesting inefficient mixing. Except for
the cloud toward
3958.2,4232.0 absorption toward
nearby stars indicate some variations in 12C/13C, with
values ranging from 40 to 90 suggesting inefficient mixing. Except for
the cloud toward ![]() Oph, these R values are strongly affected by
noise. With UVES on the VLT we have improved on the previous
interstellar 12C/13C measurements. The weighted
12C/13C ratio in the local ISM is
Oph, these R values are strongly affected by
noise. With UVES on the VLT we have improved on the previous
interstellar 12C/13C measurements. The weighted
12C/13C ratio in the local ISM is
![]() ,
while the weighted
dispersion of our measurements is 12.7, giving a
6.9
,
while the weighted
dispersion of our measurements is 12.7, giving a
6.9![]() scatter. Thus we report on a 6.9
scatter. Thus we report on a 6.9![]() detection of 16.2% root-mean-square variations in the carbon
isotopic ratio on scales of
detection of 16.2% root-mean-square variations in the carbon
isotopic ratio on scales of ![]() 100 pc:
100 pc:
![]() in the
in the
![]() Oph cloud, while
Oph cloud, while
![]() toward HD 152235 in the
Lupus clouds,
toward HD 152235 in the
Lupus clouds,
![]() towards HD 110432 in the Coalsack, and
towards HD 110432 in the Coalsack, and
![]() toward HD 170740. The observed variations in
13C/12C are the first significant detection of chemical
heterogeneity in the local ISM.
toward HD 170740. The observed variations in
13C/12C are the first significant detection of chemical
heterogeneity in the local ISM.
Key words: ISM: abundances - ISM: clouds - ISM: molecules - ISM:
individual objects: Coalsack - ISM: individual objects: Lupus cloud - ISM: individual objects: ![]() Oph cloud
Oph cloud
The ratio of the 12C to 13C isotope is a good tracer of the
amount of stellar processing in low and intermediate mass stars during
the asymptotic giant branch (AGB) phase. The third dredge-up
increases 12C/13C to about ![]() 300, while stars massive
enough to undergo "hot bottom burning'' bring their surface carbon
isotopic ratio to CNO processing equilibrium,
12C/13C
300, while stars massive
enough to undergo "hot bottom burning'' bring their surface carbon
isotopic ratio to CNO processing equilibrium,
12C/13C ![]() 3. The carbon yields of AGB stars are sensitive
functions of their initial masses and metallicities (e.g. Renzini &
Voli 1981; or Casassus & Roche 2001, for a population
synthesis approach and references to model results).
3. The carbon yields of AGB stars are sensitive
functions of their initial masses and metallicities (e.g. Renzini &
Voli 1981; or Casassus & Roche 2001, for a population
synthesis approach and references to model results).
A measurement of the 12C/13C ratio in the interstellar medium (ISM) gives important data for the total amount of low mass stellar evolution and subsequent enrichment of the ISM in the Galaxy. The terrestrial value of 12C/13C is 90 (Rosman & Taylor 1998). The 12C/13C ratio is a cornerstone of models of the nuclear history of our galactic ISM, that is, the Galactic Chemical Evolution. Models of chemical evolution predict a decrease in the 12C/13C ratio with time for a given galactocentric distance, and a decrease with galactocentric distance in the Galaxy (e.g. Palla et al. 2000, their Figs. 4 and 5.). Such models use the assumption that mixing in the ISM is complete and restricted to material at a given galactocentric distance (azimuthal mixing). A comparison of results between our Galaxy and other galaxies will give important data for the nuclear processing history (see, e.g., Tosi 2000; Prantzos 2001).
There are a large number of measurements of the 12C/13C ratio from radio astronomy data (see, e.g., Wilson & Rood
1994). However, these results may be affected by interstellar
chemistry in two ways. These are chemical fractionation (which
enriches molecules in 13C and thus lowers the ratio) and
selective dissociation (which destroys the rarer species more, and
thus raises the ratio). The 13C enrichment is due to
fractionation of the CO molecule via the ion-molecule process,
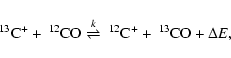 |
(1) |
Ultra-high-resolution spectroscopy of CH+ (Crawford et al. 1994) absorption towards ![]() Oph reveals broader
profiles compared to CN and CH, with an upper limit kinetic
temperature of
Oph reveals broader
profiles compared to CN and CH, with an upper limit kinetic
temperature of ![]() 2000 K, and with no velocity offset. This is
consistent with CH+ production through the endothermic reaction
2000 K, and with no velocity offset. This is
consistent with CH+ production through the endothermic reaction
The carbon isotope ratio as measured by 12CH+/13CH+ is not affected by selective
dissociation. Although photodissociation of CH+ contributes to PDR chemical networks (Sternberg & Dalgarno 1992), CH+ is
optically thin to photodissociating UV radiation in translucent
clouds. The strongest optical CH+ line in ![]() Oph is
Oph is
![]() at 4232 Å (Morton 1975), which reaches
maximum opacities of
at 4232 Å (Morton 1975), which reaches
maximum opacities of ![]() 0.3 (e.g. this work). Since no ultra-violet
CH+ lines have been reported, they are bound to be faint, and thus
thin. The photodissociation cross-section
0.3 (e.g. this work). Since no ultra-violet
CH+ lines have been reported, they are bound to be faint, and thus
thin. The photodissociation cross-section
![]() calculated by
Kirby et al. (1980) is mostly due to transitions from the
ground
calculated by
Kirby et al. (1980) is mostly due to transitions from the
ground
![]() state to the vibrational continua of the
state to the vibrational continua of the
![]() ,
,
![]() ,
and
,
and ![]() states, which smooths out
any difference between isotopes. Some resonant absorption derives from
the calculation of
states, which smooths out
any difference between isotopes. Some resonant absorption derives from
the calculation of
![]() at wavelengths of 1418 Å,
1453 Å, and 1490 Å. But Kirby et al. (1980) assign oscillator
strengths of less than 10-3 in any of these peaks, which
represents Einstein B absorption rates one order of magnitude
smaller than at 4232 Å.
at wavelengths of 1418 Å,
1453 Å, and 1490 Å. But Kirby et al. (1980) assign oscillator
strengths of less than 10-3 in any of these peaks, which
represents Einstein B absorption rates one order of magnitude
smaller than at 4232 Å.
The 12CH+/13CH+ ratio is thus a secure
representation of 12C/13C in translucent clouds. In
addition, the absorption line from 12CH+ at 4232 Å is
separated from the line of 13CH+ by 0.265 Å, which
permits unblended measurements. These ratios, obtained from optical
measurements, are restricted to regions within ![]() 2 kpc of the Sun
because of the need for bright background stars, and of narrow
velocity profiles in the intervening cloud. Eight ratios have been
measured but only one line of sight, toward
2 kpc of the Sun
because of the need for bright background stars, and of narrow
velocity profiles in the intervening cloud. Eight ratios have been
measured but only one line of sight, toward ![]() Oph, has an
excellent signal to noise ratio. The average 12C/13C ratio
from CH+ data agrees well with those obtained for sources near
the Sun, from radio astronomy data. This gives one confidence in the
ratios obtained from radio data.
Oph, has an
excellent signal to noise ratio. The average 12C/13C ratio
from CH+ data agrees well with those obtained for sources near
the Sun, from radio astronomy data. This gives one confidence in the
ratios obtained from radio data.
However, the CH+ measurements so far resulted in isotopic ratios
with a large scatter between different lines of sight, and there is
only one line of sight with an excellent signal to noise ratio. The
previous data from CH+ were taken with the ESO CAT, and 4-m or
smaller aperture telescopes. The best results from the point of view
of the signal to noise ratio and the reliability of the ratio for ![]() Oph were presented by 3 different groups (Stahl et al. 1989; Stahl & Wilson 1992; Crane et al. 1991; Hawkins et al. 1985, 1993). The
final ratio obtained by each group was
Oph were presented by 3 different groups (Stahl et al. 1989; Stahl & Wilson 1992; Crane et al. 1991; Hawkins et al. 1985, 1993). The
final ratio obtained by each group was ![]() .
The
.
The ![]() Oph value is by far the best measurement of the 12C/13C ratio
for the ISM near the Sun. However, the measurements for 7 other
nearby weak sources were of lower quality. The ratios for 3 of these
regions, toward HD 26676 (
Oph value is by far the best measurement of the 12C/13C ratio
for the ISM near the Sun. However, the measurements for 7 other
nearby weak sources were of lower quality. The ratios for 3 of these
regions, toward HD 26676 (![]() ,
Centurion & Vladilo
1991), HD 110432 (
,
Centurion & Vladilo
1991), HD 110432 (![]() ,
Centurion et al. 1995),
and
,
Centurion et al. 1995),
and ![]() Norma (
Norma (![]() ,
Centurion & Vladilo 1991 ) are in
very good agreement with the
,
Centurion & Vladilo 1991 ) are in
very good agreement with the ![]() Oph ratio. But there are
discordant ratios:
Oph ratio. But there are
discordant ratios: ![]() toward HD 157038 (Hawkins & Meyer
1989), and
toward HD 157038 (Hawkins & Meyer
1989), and ![]() toward
toward ![]() Per (Hawkins et al. 1993) while the ratio toward HD 152235 is
Per (Hawkins et al. 1993) while the ratio toward HD 152235 is
![]() and
is
and
is ![]() towards HD 152424 (Vladilo et al. 1993). Most
of the measurements are limited by noise, but the profile toward
HD 152424 is complex and thus a determination of the ratio is not easy,
because of CH+ and 13CH+ line blending.
towards HD 152424 (Vladilo et al. 1993). Most
of the measurements are limited by noise, but the profile toward
HD 152424 is complex and thus a determination of the ratio is not easy,
because of CH+ and 13CH+ line blending.
We repeated the CH+ observations toward ![]() Oph, HD 110432,
HD 152235, HD 152424 and HD 157038, and included the new lines of sight
toward HD 152236, HD 154368, HD 161056, HD 169454, HD 170740. Our goal was
first to determine whether the ratios are truly different from the
value for
Oph, HD 110432,
HD 152235, HD 152424 and HD 157038, and included the new lines of sight
toward HD 152236, HD 154368, HD 161056, HD 169454, HD 170740. Our goal was
first to determine whether the ratios are truly different from the
value for ![]() Oph, which would indicate that the mixing of the ISM
is not very fast and complete, and second, we wanted to increase the
sample of lines of sight with good to excellent signal to noise
ratios, and from this determine an average ratio near the Sun truly
representative for the local ISM.
Oph, which would indicate that the mixing of the ISM
is not very fast and complete, and second, we wanted to increase the
sample of lines of sight with good to excellent signal to noise
ratios, and from this determine an average ratio near the Sun truly
representative for the local ISM.
Section 2 describes the observations, and Sect. 3 gives details on our procedure to measure the isotopic ratio R. Section 4 contains our results, which are then summarised and discussed in Sect. 5. Section 6 concludes.
There are two systems of CH+ lines which have appreciable
oscillator strengths. Because of atmospheric absorption, the lines at 4232 Å are easier to measure. The 13CH+ line is 0.26 Å (
![]() km s-1) shortward of the 12CH+line. The other system, at 3957 Å, is more difficult to measure, but
has the property that the 13CH+ line is on the long
wavelength side of the 12CH+ line at a separation of 0.44 Å (
km s-1) shortward of the 12CH+line. The other system, at 3957 Å, is more difficult to measure, but
has the property that the 13CH+ line is on the long
wavelength side of the 12CH+ line at a separation of 0.44 Å (
![]() km s-1). This property has been used by
Stahl & Wilson (1992) to check that there is no accidental
overlap of a weak velocity component of 12CH+ at -18.8 km s-1 from the deepest 12CH+ absorption line with the
13CH+ line. Nearly all previous data were taken at 4232 Å.
km s-1). This property has been used by
Stahl & Wilson (1992) to check that there is no accidental
overlap of a weak velocity component of 12CH+ at -18.8 km s-1 from the deepest 12CH+ absorption line with the
13CH+ line. Nearly all previous data were taken at 4232 Å.
Our observations were obtained with the UVES echelle spectrograph at the VLT unit telescope Kueyen at Cerro Paranal, Chile, in three nights between June 14/15 and June 16/17, 2003. UVES allows measuring both line systems in the same detector setting, thus providing a means to correct for line blending if it is apparent in the spectra.
The observations are difficult because of the need for both very high
S/N and very high spectral resolution to acquire the profile of faint 13CH+, against a very bright stellar continuum and close to
the much stronger 12CH+ component. We need S/N ratios of at
least ![]() 10 on 13CH+ for accurate profile fitting. The
project requires the highest possible spectral resolution. We
therefore used an image slicer to minimize flux losses. In addition,
the image slicer distributes the light along the slit, which improves
flat-fielding and allows for our bright targets longer integration
times before saturation occurs. UVES slicer #2 was used, which
reformats an entrance opening of
10 on 13CH+ for accurate profile fitting. The
project requires the highest possible spectral resolution. We
therefore used an image slicer to minimize flux losses. In addition,
the image slicer distributes the light along the slit, which improves
flat-fielding and allows for our bright targets longer integration
times before saturation occurs. UVES slicer #2 was used, which
reformats an entrance opening of
![]() to a slit
of 0
to a slit
of 0
![]() 44 width and a length of 7
44 width and a length of 7
![]() 9, which is imaged on the
spectrograph entrance slit of 0
9, which is imaged on the
spectrograph entrance slit of 0
![]() 45 width. The spectral resolution
in this configuration is
45 width. The spectral resolution
in this configuration is ![]() /
/
![]() .
The
central wavelength was set to 4370 Å, which gives a spectral
coverage from 3730 to 5000 Å. During our observations the
seeing was typically too good to fill the entrance aperture of the
images slicer. Therefore, for most spectra, only one or two slices
contained most of the signal, which unfortunately decreases the
expected gain of the image slicer.
.
The
central wavelength was set to 4370 Å, which gives a spectral
coverage from 3730 to 5000 Å. During our observations the
seeing was typically too good to fill the entrance aperture of the
images slicer. Therefore, for most spectra, only one or two slices
contained most of the signal, which unfortunately decreases the
expected gain of the image slicer.
Accurate flat-fielding is also important. Therefore a large number of flat-fields (200) was obtained during daytime distributed along the observing run.
In addition, a rapidly rotating unreddened early-type star
(
![]() Cap = HD 205637, spectral type B3V) was observed in
order to check for possible faint terrestrial features. We confirm
there are no detectable telluric features under the CH+ absorption,
and show in Fig. 1 the template star spectrum in the
region of interest, at airmasses <1.08. Higher airmasses result in
telluric absorption features, as in the case of
Cap = HD 205637, spectral type B3V) was observed in
order to check for possible faint terrestrial features. We confirm
there are no detectable telluric features under the CH+ absorption,
and show in Fig. 1 the template star spectrum in the
region of interest, at airmasses <1.08. Higher airmasses result in
telluric absorption features, as in the case of ![]() Oph discussed
below.
Oph discussed
below.
![\begin{figure}
\par\resizebox{8.8cm}{!}{\includegraphics[clip]{2149fig1.eps}}
\end{figure}](/articles/aa/full/2005/37/aa2149-04/img57.gif) |
Figure 1: Spectral region about the CH+ absorption towards the template star HD 205637, emphasizing the absence of telluric features at airmasses of 1.05-1.08. |
| Open with DEXTER | |
The brighter targets where exposed until about 50% of the maximum
level allowed by the CCD detector was reached. For ![]() Oph, this
limits the exposure time to about 5 s, and typically a few minutes
for the fainter targets. Series of up to 50 exposures per night were
obtained to build up the required S/N-ratio. Some targets turned out
to show too complex line profiles. These were dropped from our initial
target list. The observations are summarized in
Table 1, which also lists the mean airmass of the target
objects in the different nights. At the higher airmass values, the
range in airmass differed from the mean by about
Oph, this
limits the exposure time to about 5 s, and typically a few minutes
for the fainter targets. Series of up to 50 exposures per night were
obtained to build up the required S/N-ratio. Some targets turned out
to show too complex line profiles. These were dropped from our initial
target list. The observations are summarized in
Table 1, which also lists the mean airmass of the target
objects in the different nights. At the higher airmass values, the
range in airmass differed from the mean by about ![]() 0.1 during the
observations, and less at smaller airmass.
0.1 during the
observations, and less at smaller airmass.
We also list in Table 1 the radial velocities relative
to the solar barycentre of the CH+ absorption. These are calculated
from the shift in wavelength between the rest wavelengths of the
transitions and of the average of the Gaussian centroids weighted by
their equivalent widths. The uncertainty on the derived velocities is
conservatively ![]() 1 km s-1, and depends on the accuracy of the
rest wavelengths.
1 km s-1, and depends on the accuracy of the
rest wavelengths.
We used the Midas package originally developed for the ESO Feros spectrograph for the reduction of the spectra (Stahl et al. 1999). In order to maximize the S/N-ratio of the extracted spectra, all flat-fields obtained during the run were averaged. After background subtraction and flat-fielding, the spectra were extracted with a very long slit, extracting all slices together. The wavelength calibration of the extracted spectra was done with a 2D-polynomial, fitting all echelle orders in one step. A mean ThAr-spectrum obtained during day time was used for the calibration of all spectra obtained in one night. Finally, all spectra were merged to a 1D-spectrum and all observations of each night averaged to a nightly mean spectrum. Wavelengths are reported in air and refererred to the solar barycentre.
Table 1:
Summary of the observations, giving the total number of
exposures, N, the integrated exposure time in seconds, and the
observed heliocentric velocities of the absorbing clouds,
![]() .
.
The nightly spectra were combined in a weighted average to produce
coadded spectra. The weights were taken as 1/![]() ,
where
,
where ![]() is the noise in each spectra, as calculated from the
root-mean-square deviations from a linear fit to a region of the
spectrum devoid of conspicuous features (we chose 4204.2 Å to 4205.9 Å). Table 2 summarise the resulting weights.
is the noise in each spectra, as calculated from the
root-mean-square deviations from a linear fit to a region of the
spectrum devoid of conspicuous features (we chose 4204.2 Å to 4205.9 Å). Table 2 summarise the resulting weights.
Table 2: Relative weights used to combined the nightly spectra.
In order to use the fact that both 12CH+ and 13CH+lines have the same opacity profile ![]() ,
we must fit the 12CH+ absorption with a parametrised model and scale it to 13CH+.
,
we must fit the 12CH+ absorption with a parametrised model and scale it to 13CH+.
We considered using Voigt profiles to account for the intrinsic line
profiles of the CH+ vibronic lines. In order to fit the low-level
broad wings (e.g. Stahl et al. 1989) towards ![]() Oph with
an hypothetical Lorentzian core, Einstein A values of order 109 s-1 are required. Gredel. et al. (1993) quote
an oscillator strength of
Oph with
an hypothetical Lorentzian core, Einstein A values of order 109 s-1 are required. Gredel. et al. (1993) quote
an oscillator strength of
![]() ,
or
,
or
![]() ,
for 12CH
,
for 12CH
![]() 4232
4232
![]() and
and
![]() ,
or
,
or
![]() ,
for 12CH
,
for 12CH
![]() 3957
3957
![]() .
We therefore used simple Gaussian profiles to
describe the lines.
.
We therefore used simple Gaussian profiles to
describe the lines.
We preferred to fit the two overtones separately, and thus obtain independent measurements with which to assess the role of systematics. A simultaneous fit of both overtones could have helped constrain the opacity profiles, which in our separate fits do not always share the same Gaussian components.
The fitting algorithm is as follows.
 |
(4) |
![$\displaystyle \tau(\lambda) = \sum_{i=1}^{n_{\rm g}} \left[ \tau^{\circ}_i \exp...
...a^{\circ}_i (1+\Delta
v_{\rm iso}/c))^2 / {\sigma^{\circ}}_i^2 \right) \right].$](/articles/aa/full/2005/37/aa2149-04/img77.gif) |
(5) |
 |
(6) |
The correlation between the spectral datapoints is ignored when
fitting for the parametrised model. The off-diagonal terms of the
covariance matrix add terms to the ![]() goodness-of-fit estimator
(Eq. (7)). The number of additional terms is roughly
goodness-of-fit estimator
(Eq. (7)). The number of additional terms is roughly
![]() per diagonal element, which increase
per diagonal element, which increase ![]() by a
factor
by a
factor
![]() .
But the noise estimate from the dispersion of
the residuals also increases due to the correlation of the datapoints,
the actual noise should be
.
But the noise estimate from the dispersion of
the residuals also increases due to the correlation of the datapoints,
the actual noise should be
![]() .
Both
corrections cancel out and leave
.
Both
corrections cancel out and leave ![]() as in Eq. (7).
as in Eq. (7).
We tested for systematic noise by comparing the noise in the nightly
coadded spectra,
![]() ,
with that expected from the
noise in each of the
,
with that expected from the
noise in each of the
![]() individual exposures,
individual exposures,
![]() .
For thermal noise it should hold that
.
For thermal noise it should hold that
![]() .
We define
.
We define
![]() ,
and
raise the order of the baselines until
,
and
raise the order of the baselines until ![]() .
The tests were run
for the case of HD 170740, which presents the most ragged
continuum. The reference baseline is defined on the coadded spectrum,
and the noise is given by the dispersion of the residuals, excluding
the spectral regions affected by the ISM lines (these regions are
defined in Fig. 12). We scale the reference baseline
to the line-free continua of single exposures using the ratio of their
median values. Figure 2 shows we need to reach orders of
.
The tests were run
for the case of HD 170740, which presents the most ragged
continuum. The reference baseline is defined on the coadded spectrum,
and the noise is given by the dispersion of the residuals, excluding
the spectral regions affected by the ISM lines (these regions are
defined in Fig. 12). We scale the reference baseline
to the line-free continua of single exposures using the ratio of their
median values. Figure 2 shows we need to reach orders of ![]() for
for ![]() 3957, and of
3957, and of ![]() for
for ![]() 4232. Below
these orders the continua are affected by systematic
noise. Unfortunately the level of systematic noise changes for each
observation and setting, so that we can only use the tests on HD 170740
as guidelines for the other lines of sight. In practice we chose the
smallest order that is compatible with the data, without exceeding the
limits in HD 170740.
4232. Below
these orders the continua are affected by systematic
noise. Unfortunately the level of systematic noise changes for each
observation and setting, so that we can only use the tests on HD 170740
as guidelines for the other lines of sight. In practice we chose the
smallest order that is compatible with the data, without exceeding the
limits in HD 170740.
![\begin{figure}
\par\resizebox{8.8cm}{!}{\includegraphics[clip]{2149fig2.eps}}
\end{figure}](/articles/aa/full/2005/37/aa2149-04/img99.gif) |
Figure 2:
The ratio of measured to expected noise, Q, as a function
of the order of the Legendre polynomial used to define the
baselines, l. The data are for 25 exposures of HD 170740 on June 15th, for two 1.5 |
| Open with DEXTER | |
The isotopic ratio derived from the fits is the ratio of the column
densities of each isotope,
![]() .
With the best fit fwe can calculate R=1/f for a line of sight with constant R. We
neglect the small difference in oscillator strength between 12CH+ and 13CH+. The two ions have slightly different
vibrational structures which will lead to small changes in the
.
With the best fit fwe can calculate R=1/f for a line of sight with constant R. We
neglect the small difference in oscillator strength between 12CH+ and 13CH+. The two ions have slightly different
vibrational structures which will lead to small changes in the
![]() values for individual vibrationally resolved transitions
(J. Tennyson, private communication). We are thus neglecting
values for individual vibrationally resolved transitions
(J. Tennyson, private communication). We are thus neglecting
![]() -value differences of the order of the relative difference in
reduced mass, or
-value differences of the order of the relative difference in
reduced mass, or
![]() .
.
![\begin{figure}
\par\includegraphics[width=16cm,clip]{2149fig3.eps}
\end{figure}](/articles/aa/full/2005/37/aa2149-04/img103.gif) |
Figure 3:
|
| Open with DEXTER | |
![\begin{figure}
\par\includegraphics[width=16cm,clip]{2149fig4.eps}
\end{figure}](/articles/aa/full/2005/37/aa2149-04/img104.gif) |
Figure 4:
Same as Fig. 3. The fits on the |
| Open with DEXTER | |
In taking statistics on the values of R=1/f in the local ISM care
must be taken to assess the significance of measurements along
individual sightlines. The uncertainties on individual fits do not
include the systematic error involved in baseline definition. If
baselines were known a priori, the expectation value and
uncertainty on f for each individual sightline would be obtained
from the statistics of multiple measurements of the same
quantity. Thus, in the absence of this systematic error,
![]() and
and ![]() correspond to the weighted average and
quadratic sum of the weighted uncertainties, where the weights are
taken as the inverse variance of each measurement,
correspond to the weighted average and
quadratic sum of the weighted uncertainties, where the weights are
taken as the inverse variance of each measurement,
![]() :
:
 |
(8) | ||
 |
(9) |
To estimate the systematic error involved in baseline definition, we
compare a posteriori the scatter of individual measurements with
that expected from the noise level. We use the rms dispersion
![\begin{displaymath}\sigma_2(f) = \sqrt{ \sum_i w_i~ \left[ (f_i - \langle f \rangle) \right]^2}.
\end{displaymath}](/articles/aa/full/2005/37/aa2149-04/img109.gif) |
(10) |
Table 3:
We list
![]() to improve the clarity of the
table.
to improve the clarity of the
table. ![]() refers to the Gaussian errors (those derived from
the
refers to the Gaussian errors (those derived from
the ![]() curvature matrix). The average values are quoted as
curvature matrix). The average values are quoted as
![]() (see text for details),
and exclude the coadded spectra. Equivalent widths for
12CH+,
(see text for details),
and exclude the coadded spectra. Equivalent widths for
12CH+, ![]() ,
are given in mÅ. The stars select the
measurements included in the combined values of R; the selection
are discussed in the text.
,
are given in mÅ. The stars select the
measurements included in the combined values of R; the selection
are discussed in the text.
An application of the fitting procedure described in Sect. 3 to our sample of 10 lines of sight gives the best fit parameters and isotopic ratios listed in Table 3. We show a selection of some of our results in Figs. 3-12. Full details can be found in complete versions of Figs. 3-12 in the electronic version of this paper, which includes nightly spectra and the complete dataset.
The isotopic ratio f= 13C/12C is better suited as free parameter than R=1/f for the purpose of fitting individual spectra, and subsequently averaging the best fit values. For noisy data the error propagation when using R would involve second order expansions in R(f) when calculating averages and dispersions. In what follows we prefer to list our results in terms of f, and revert to the more common usage of R in Sect. 5 when comparing with previous data.
Table 3 lists the isotope ratios and best fit
parameters. It is apparent the ![]() 4232 line generally gives the
best estimate of R. We note from Table 3 that the
normal errors are good approximations to the 68.3% confidence limits,
which justifies their subsequent use in the weighted averages. We also
note the weighted average of several measurements for the same line of
sight are consistent, within the errors, with the fit to the coadded
spectra (which are in general excluded from the averages), giving
confidence in our procedure.
4232 line generally gives the
best estimate of R. We note from Table 3 that the
normal errors are good approximations to the 68.3% confidence limits,
which justifies their subsequent use in the weighted averages. We also
note the weighted average of several measurements for the same line of
sight are consistent, within the errors, with the fit to the coadded
spectra (which are in general excluded from the averages), giving
confidence in our procedure.
![\begin{figure}
\par\includegraphics[width=16cm,clip]{2149fig5.eps}
\end{figure}](/articles/aa/full/2005/37/aa2149-04/img116.gif) |
Figure 5:
Same as Fig. 3. The fits on |
| Open with DEXTER | |
![\begin{figure}
\par\includegraphics[width=16cm,clip]{2149fig6.eps}
\end{figure}](/articles/aa/full/2005/37/aa2149-04/img118.gif) |
Figure 6:
Same as Fig. 8. No excess absorption is
detected on the blue edge of
|
| Open with DEXTER | |
From Hipparcos results, the distance to ![]() Oph gives an
upper limit to the absorbing cloud of
Oph gives an
upper limit to the absorbing cloud of ![]() pc. The spectra of
pc. The spectra of ![]() Oph around the CH+ lines are shown in Fig. 3,
where we have also plotted the Gaussian components on the
12CH+ line (the individual components on the 13CH+ line are left out for clarity).
Oph around the CH+ lines are shown in Fig. 3,
where we have also plotted the Gaussian components on the
12CH+ line (the individual components on the 13CH+ line are left out for clarity).
Residual features under the absorption lines vary on scales of ![]() 0.02 Å. These reflect the imperfection in the model line
profiles, more Gaussian components reduce these residuals.
0.02 Å. These reflect the imperfection in the model line
profiles, more Gaussian components reduce these residuals.
![\begin{figure}
\par\includegraphics[width=16cm,clip]{2149fig7.eps}
\end{figure}](/articles/aa/full/2005/37/aa2149-04/img120.gif) |
Figure 7:
Same as Fig. 8. 13CH+ is visible
as excess absorption on the blue edge of
|
| Open with DEXTER | |
The ![]() Oph spectra were acquired at airmasses of 1.8 and 1.7 on
the 15th and 16th of June. Both spectra show
absorption at 3958.15 Å (at 3958.5 Å in the observatory's rest
frame). This is absent in the spectrum from 14th of June
and in all other targets. Since all other spectra were acquired with
low airmass values compared with that of
Oph spectra were acquired at airmasses of 1.8 and 1.7 on
the 15th and 16th of June. Both spectra show
absorption at 3958.15 Å (at 3958.5 Å in the observatory's rest
frame). This is absent in the spectrum from 14th of June
and in all other targets. Since all other spectra were acquired with
low airmass values compared with that of ![]() Oph on the 15th and 16th, we conclude the 3958.15 Å feature is telluric. We did not attempt to include the 3958.15 Å feature in the fits. The telluric absorption propagates into the
residuals, and contributes to the noise level. Note that the telluric
feature has no effect on where we set the baseline level, because we
assigned zero weights to the spectral points in its neighbourhood.
Oph on the 15th and 16th, we conclude the 3958.15 Å feature is telluric. We did not attempt to include the 3958.15 Å feature in the fits. The telluric absorption propagates into the
residuals, and contributes to the noise level. Note that the telluric
feature has no effect on where we set the baseline level, because we
assigned zero weights to the spectral points in its neighbourhood.
![\begin{figure}
\par\includegraphics[width=16cm,clip]{2149fig8.eps}
\end{figure}](/articles/aa/full/2005/37/aa2149-04/img121.gif) |
Figure 8:
Same as Fig. 3. This line of sight has blended
12CH+ and 13CH+ absorption at |
| Open with DEXTER | |
![\begin{figure}
\par\includegraphics[width=16cm,clip]{2149fig9.eps}
\end{figure}](/articles/aa/full/2005/37/aa2149-04/img122.gif) |
Figure 9:
Same as Fig. 8. The fit for 13CH+ absorption on the blue edge of
|
| Open with DEXTER | |
Stahl et al. (1989) reported ![]()
![]() from
from ![]() 4232,
using a single Gaussian fit. But Stahl & Wilson (1992) used
two Gaussian components to account for the broad wings detected by
Crane et al. (1991), and thus obtained a tighter fit to the
4232,
using a single Gaussian fit. But Stahl & Wilson (1992) used
two Gaussian components to account for the broad wings detected by
Crane et al. (1991), and thus obtained a tighter fit to the
![]() Oph CH+ absorption, with
Oph CH+ absorption, with ![]() for
for ![]() 4232 and
4232 and
![]() for
for ![]() 3957.
3957.
We also find that using two instead of one Gaussian components
significantly improves the fit, bringing reduced ![]() values for
the coadded
values for
the coadded ![]() Oph
Oph ![]() 4232 spectrum from 2.07 for one
Gaussian (using the noise reference of the two Gaussian fit), to 1.05
for two Gaussians. But the resulting average for R is unchanged, we
obtain
4232 spectrum from 2.07 for one
Gaussian (using the noise reference of the two Gaussian fit), to 1.05
for two Gaussians. But the resulting average for R is unchanged, we
obtain
![]() with one Gaussian,
with one Gaussian,
![]() with two Gaussians.
with two Gaussians.
What is the effect of including more than two Gaussians? It is
difficult to separate an error in the definition of the continuum
baseline from a real increase in confidence level of the fit. We
experimented on ![]() Oph with 3 and 4 Gaussians, keeping the noise
fixed to the rms dispersion of the residuals in the 2 Gaussian
fit. The reduced
Oph with 3 and 4 Gaussians, keeping the noise
fixed to the rms dispersion of the residuals in the 2 Gaussian
fit. The reduced ![]() were respectively 0.92 and 0.88 for the 3
and 4 Gaussian fits to the spectral region centred on
were respectively 0.92 and 0.88 for the 3
and 4 Gaussian fits to the spectral region centred on ![]() 4232 in
the coadded spectrum of
4232 in
the coadded spectrum of ![]() Oph. But some of the 4-Gaussians fits
to the
Oph. But some of the 4-Gaussians fits
to the ![]() Oph spectra contained very narrow features,
corresponding to unphysical opacity components. Since we cannot
separate the uncertainty in the baseline definition, we adopt the
smallest number of Gaussians consistent with the dataset (with reduced
Oph spectra contained very narrow features,
corresponding to unphysical opacity components. Since we cannot
separate the uncertainty in the baseline definition, we adopt the
smallest number of Gaussians consistent with the dataset (with reduced ![]() close to 1). We chose 3 Gaussians rather than 2 because
Crawford et al. (1994) report a 3-Gaussians decomposition of the
ultra-high resolution CH+ profile toward
close to 1). We chose 3 Gaussians rather than 2 because
Crawford et al. (1994) report a 3-Gaussians decomposition of the
ultra-high resolution CH+ profile toward ![]() Oph. The final
value from the UVES data is thus
Oph. The final
value from the UVES data is thus
![]() ,
with a 3-Gaussian fit.
,
with a 3-Gaussian fit.
All R values for ![]() Oph are consistent within 2
Oph are consistent within 2![]() .
The
value we obtain here is higher than previously reported by Stahl et al. (1992) by 1.6
.
The
value we obtain here is higher than previously reported by Stahl et al. (1992) by 1.6![]() ,
adding the statistical errors in
quadrature. For comparison Hawkins et al. (1993) give
,
adding the statistical errors in
quadrature. For comparison Hawkins et al. (1993) give
![]() for
for ![]() 4232,
4232, ![]() for
for ![]() 3957, Crane et al. (1991) give
3957, Crane et al. (1991) give
![]() for
for ![]() 4232, and
Vanden Bout & Snell (1980) report
R =77+17-12,
also for
4232, and
Vanden Bout & Snell (1980) report
R =77+17-12,
also for ![]() 4232.
4232.
The value reported in this article has an accuracy close to that of
Stahl et al. (1992), of ![]() .
Combining both measurement
with identical weights gives our best value for
.
Combining both measurement
with identical weights gives our best value for ![]() Oph as
Oph as
![]() .
.
In what follows we will nonetheless use the UVES value of R for ![]() Oph to compare with the other lines of sight,
Oph to compare with the other lines of sight,
![]() thus relying exclusively on
measurements obtained with the same instrument.
thus relying exclusively on
measurements obtained with the same instrument.
The profile from Crawford (1995) is well fit by 1 Gaussian only, but we obtain best results with 2 Gaussians.
The Hipparcos distance to HD 110432 is ![]() pc, which
confirms that the CH+ absorption most likely arises in the
Coalsack, at a maximum distance of 180 pc (Franco 1989).
pc, which
confirms that the CH+ absorption most likely arises in the
Coalsack, at a maximum distance of 180 pc (Franco 1989).
The fit on the ![]() 3957 line is excluded from the combined
measurement of R because the adjacent telluric absorption feature
could affect the wings of the CH+ absorption. Also the baseline
around
3957 line is excluded from the combined
measurement of R because the adjacent telluric absorption feature
could affect the wings of the CH+ absorption. Also the baseline
around ![]() 3957 seems to be strongly affected by systematic
noise. The
3957 seems to be strongly affected by systematic
noise. The ![]() 3957 values differ from
3957 values differ from ![]() 4232, which
otherwise give consistent numbers for each night.
4232, which
otherwise give consistent numbers for each night.
![\begin{figure}
\par\includegraphics[width=16cm,clip]{2149fig10.eps}
\end{figure}](/articles/aa/full/2005/37/aa2149-04/img134.gif) |
Figure 10:
Same as Fig. 3. None of the |
| Open with DEXTER | |
HD 152235 is a member of the Sco OB1 association, but as discussed by Crawford (1995) the absorbing CH+ lies in the Lupus molecular cloud, at 170 pc (Murphy et al. 1986).
The profile from Crawford (1995) is fit by 3 Gaussians. Our
data, presented in Fig. 5, also required 3 Gaussians
for ![]() 3957.
3957.
The CH+ absorption has a red tail than difficults separating both isotopes at 4232 Å, while the telluric absorption feature borders the 13CH+ line. It is difficult to pin down the underlying continuum at 4232 Å. We tried two approaches to define the continuum from edge to edge of the CH+ absorption (from 4232 Å to 4232.7 Å): a free fit (i.e. roughly a straight-line, with zero weights over 4232 Å - 4232.7 Å), and the inclusion of a small non-zero weight mid-way between the two isotopes (see Fig. 5).
The spectrum from 2003 June 14th is clear of telluric absorption (it
was observed with the smallest air mass, see Table 1),
so both overtones should give consistent values for R. This is why
we chose the baseline shown in Fig. 5. The two
overtones give consistently high value for June 14th, and also on
average. So we are rather confident of the ratio we report. The fits
on ![]() 3957 for June 15th and 16th are
excluded from the combined measurement of R because they are
affected by telluric absorption under the red tail of 13CH+.
3957 for June 15th and 16th are
excluded from the combined measurement of R because they are
affected by telluric absorption under the red tail of 13CH+.
Vladilo et al. (1993) reported
![]() .
Our
measurement, which has better accuracy, gives lower value, although
still higher than the ISM average (see Sect. 5).
.
Our
measurement, which has better accuracy, gives lower value, although
still higher than the ISM average (see Sect. 5).
This line of sight gives a significantly higher R value than in HD 110432 at 4.2![]() ,
using the conservative uncertainties
,
using the conservative uncertainties ![]() ,
from the scatter of each individual measurement of R.
,
from the scatter of each individual measurement of R.
Figure 6 presents the CH+ spectra for HD 152236, along with our fits. Crawford (1995) used 4 Gaussians, but we needed 6.
HD 152236, as HD 152235, is a member of the Sco OB1 association, so that the absorption probably occurs in the Lupus cloud.
There is no manifest absorption at ![]() 3957, but we give the
result of the formal fit, which allows assigning a lower limit R value. We take
3957, but we give the
result of the formal fit, which allows assigning a lower limit R value. We take
![]() ,
and
,
and
![]() ,
giving R > 61.4 at
the 3
,
giving R > 61.4 at
the 3![]() level.
level.
Although the ![]() 4232 line has better signal to noise, both
isotopes are blended. We tried to apply the technique described below
in the case of HD 154368 (Sect. 4.1.6), but did not obtain
significant excess absorption in the blue wing of the main line. The
lower limit refers only to the
4232 line has better signal to noise, both
isotopes are blended. We tried to apply the technique described below
in the case of HD 154368 (Sect. 4.1.6), but did not obtain
significant excess absorption in the blue wing of the main line. The
lower limit refers only to the ![]() 3957 measurement.
3957 measurement.
![\begin{figure}
\par\includegraphics[width=8.8cm,clip]{2149fig11.eps}
\end{figure}](/articles/aa/full/2005/37/aa2149-04/img138.gif) |
Figure 11:
Same as Fig. 8. The information from
|
| Open with DEXTER | |
![\begin{figure}
\par\includegraphics[width=15cm,clip]{2149fig12.eps}
\end{figure}](/articles/aa/full/2005/37/aa2149-04/img139.gif) |
Figure 12:
Same as Fig. 8. The spectra around
|
| Open with DEXTER | |
HD 152424, as HD 152235, is a member of the Sco OB1 association, so that the absorption probably occurs in the Lupus cloud.
Vladilo et al. 1993 report
![]() ,
but this target
gives us our lowest R value, of
,
but this target
gives us our lowest R value, of
![]() .
.
The two isotopes are blended at ![]() 4232, so we apply the same
technique as for HD 154368 (Sect. 4.1.6). The residuals
under the 13CH+ absorption are consistent with the noise, which
gives us confidence in the inferred R value. HD 152424 provides our
best measurement of R for blended lines, as obtained by keeping the
opacity profile fixed to the best fit on
4232, so we apply the same
technique as for HD 154368 (Sect. 4.1.6). The residuals
under the 13CH+ absorption are consistent with the noise, which
gives us confidence in the inferred R value. HD 152424 provides our
best measurement of R for blended lines, as obtained by keeping the
opacity profile fixed to the best fit on ![]() 3957. But defining
consistent baselines between the two overtones is very difficult
without including the baseline as free parameter. So we decided to
ignore the significant residuals under the main isotope at
3957. But defining
consistent baselines between the two overtones is very difficult
without including the baseline as free parameter. So we decided to
ignore the significant residuals under the main isotope at ![]() 4232. We include the noisy residuals in the noise estimate,
so that the significance of the R values derived from the blended
line is lowered.
4232. We include the noisy residuals in the noise estimate,
so that the significance of the R values derived from the blended
line is lowered.
The importance of quantifying systematic uncertainties is manifest in HD 152424: a visual inspection of Fig. 7 shows the fit
under ![]() 3957 is very good, and that the baseline seems
smooth. However appeareances can be deceiving: the extrapolation of
the
3957 is very good, and that the baseline seems
smooth. However appeareances can be deceiving: the extrapolation of
the ![]() 3957 fit to
3957 fit to ![]() 4232 gives a very different value of R. Had we considered only the
4232 gives a very different value of R. Had we considered only the ![]() uncertainties, the value
for HD 152424 would have been one of the most accurate. But because CH+ towards HD 152424 is so broad the conservative uncertainty
uncertainties, the value
for HD 152424 would have been one of the most accurate. But because CH+ towards HD 152424 is so broad the conservative uncertainty ![]() is much higher than
is much higher than ![]() and reflects the systematic
uncertainty involved in the baseline definition.
and reflects the systematic
uncertainty involved in the baseline definition.
This target was selected from the survey of Gredel et al. (1993).
The CH+ absoprtion for HD 154368 (with an Hipparcos distance
of
![]() pc) shown in Fig. 8 has four
conspicuously distinct velocity components. The two isotopes are
manifestly blended for the
pc) shown in Fig. 8 has four
conspicuously distinct velocity components. The two isotopes are
manifestly blended for the ![]() 4232 transition.
4232 transition.
Our data cover the two overtones in the same UVES dichroic setting
simultaneously, and the spectral resolution is expected to be constant
with wavelength in such an instrumental setup. After checking we had
no detectable trend of varying resolution by measuring the arc line
widths, we attempted fitting ![]() 4232 using the results of the
4232 using the results of the ![]() 3957 fits.
3957 fits.
A fit of both overtones simultaneously would be counterproductive
because the ![]() 4232 region has better sensitivity, and would
dominate the fit, placing Gaussian components of 12CH+ under
the rarer isotope. Instead we kept the 12CH+ opacity profile
as a function of velocity
4232 region has better sensitivity, and would
dominate the fit, placing Gaussian components of 12CH+ under
the rarer isotope. Instead we kept the 12CH+ opacity profile
as a function of velocity ![]() as inferred from the
as inferred from the ![]() 3957 fit. We then scaled
3957 fit. We then scaled ![]() to
to
![]() for the
for the
![]() 4232 region, which implies scaling component widths and
separations in wavelengths. After setting baselines as in the
unblended case, the optimization involved two free parameters, the
scaling factors on the 12CH+ and 13CH+ opacity
profiles.
4232 region, which implies scaling component widths and
separations in wavelengths. After setting baselines as in the
unblended case, the optimization involved two free parameters, the
scaling factors on the 12CH+ and 13CH+ opacity
profiles.
The fits shown in Fig. 8 are rather poor in the case
of ![]() 4232. Uncertainties in the baseline determination resulted
in significant residuals under the main isotope line. But these do not
affect the 13CH+ absorption. We recompute the noise level from
the residuals, including the baseline uncertainties. The uncertainties
on R tabulated in Table 3 are a result of this
exaggerated noise level.
4232. Uncertainties in the baseline determination resulted
in significant residuals under the main isotope line. But these do not
affect the 13CH+ absorption. We recompute the noise level from
the residuals, including the baseline uncertainties. The uncertainties
on R tabulated in Table 3 are a result of this
exaggerated noise level.
This line of sight also has blended absorption at ![]() 4232, and
we apply the same technique as for HD 154368. But the results on
4232, and
we apply the same technique as for HD 154368. But the results on ![]() 4232 are useless because they are too sensitive on the
baseline definition, so we avoided the use of
4232 are useless because they are too sensitive on the
baseline definition, so we avoided the use of ![]() 4232
altogether.
4232
altogether.
Hawkins & Meyer (1989, and references therein) give
![]() from
from ![]() 4232 and use a distance of 1.7 kpc to HD 157038. We
confirm this line of sight is enriched in 13C, with a lower R value than the average ISM value (see Sect. 5.1).
4232 and use a distance of 1.7 kpc to HD 157038. We
confirm this line of sight is enriched in 13C, with a lower R value than the average ISM value (see Sect. 5.1).
13CH+ absorption towards HD 161056 (selected from Gredel et al. 1993) is very weak at ![]() 3957, and yet conspicuous
at
3957, and yet conspicuous
at ![]() 4232 (see Fig. 10). We first attempted to
fit the two overtones separately, and found widely discrepant values:
4232 (see Fig. 10). We first attempted to
fit the two overtones separately, and found widely discrepant values:
![]() ,
and
,
and
![]() .
The
two isotopes may be blended at
.
The
two isotopes may be blended at ![]() 4232. We thus applied the same
technique as for HD 154368, extrapolating the
4232. We thus applied the same
technique as for HD 154368, extrapolating the ![]() 3957 opacity
profile to
3957 opacity
profile to ![]() 4232. But the inferred isotope ratios were still
very different (see Table 3). There must be additional
absorption bridging the two overtones at
4232. But the inferred isotope ratios were still
very different (see Table 3). There must be additional
absorption bridging the two overtones at ![]() 4232, not due to CH+: the red tail of
4232, not due to CH+: the red tail of ![]() 4232 is also seen at
4232 is also seen at ![]() 3957,
while the absorption at the blue edge of
3957,
while the absorption at the blue edge of ![]() 4232 is not seen at
4232 is not seen at ![]() 3957. We cannot identify the nature of the additional
absorption, so we choose to exclude
3957. We cannot identify the nature of the additional
absorption, so we choose to exclude ![]() 4232 from the combined
measurement of R in HD 161056.
4232 from the combined
measurement of R in HD 161056.
The Hipparcos distance to HD 161056 is
![]() pc.
pc.
This line of sight, selected from Gredel et al. (1993),
exibits at least 4 distinct velocity components. We use 6 Gaussians to
describe the profile, but did not attempt to compare reduced ![]() when varying the number of Gaussians because of the uncertainties in
the baseline definition.
when varying the number of Gaussians because of the uncertainties in
the baseline definition.
The total number of free-parameters used to describe the main line is
![]() ,
with 3 parameters per Gaussian. The zero-absorption line
width for HD 169454 is
,
with 3 parameters per Gaussian. The zero-absorption line
width for HD 169454 is ![]() 0.8 Å, or 80 spectral datapoints. But
the number of independent resolution elements under 12CH+ is
about 16. Thus 18 free parameters may seem slightly excessive. But
over-constraining the opacity profile is of no consequence to the
derived isotopic ratio.
0.8 Å, or 80 spectral datapoints. But
the number of independent resolution elements under 12CH+ is
about 16. Thus 18 free parameters may seem slightly excessive. But
over-constraining the opacity profile is of no consequence to the
derived isotopic ratio.
We use the same technique as for HD 154368 to model the blended
12CH+ and 13CH+ absorption at ![]() 4232, but do
not obtain satisfactory results. The fits on
4232, but do
not obtain satisfactory results. The fits on ![]() 4232 are shown
in Fig. 11 for completeness, and are not included in
the combined measurement of R towards HD 169454. An unphysical value
of f is obtained, but this value is still consistent with zero 13CH+ within the uncertainties. Also excluded from the
combined measurement of R is the fit to
4232 are shown
in Fig. 11 for completeness, and are not included in
the combined measurement of R towards HD 169454. An unphysical value
of f is obtained, but this value is still consistent with zero 13CH+ within the uncertainties. Also excluded from the
combined measurement of R is the fit to ![]() 3957 from
June 14th because it shows non-ISM absorption at 3957.3
3957 from
June 14th because it shows non-ISM absorption at 3957.3 ![]() .
The
.
The ![]() 3957.3 feature is not seen in other
spectra acquired at similar airmass (e.g. that of HD 152235 on
June 15th), and is either an instrumental artifact or the
effect of passing clouds.
3957.3 feature is not seen in other
spectra acquired at similar airmass (e.g. that of HD 152235 on
June 15th), and is either an instrumental artifact or the
effect of passing clouds.
This line of sight, selected from Gredel et al. (1993), is
important since it has the highest R value among those considered in
this work, together with HD 161056. The Hipparcos distance to HD 170740
is
![]() pc.
pc.
Unfortunately instrumental fringing, especially at ![]() 3957,
limits the accuracy of the fits. The
3957,
limits the accuracy of the fits. The ![]() 3957 13CH+line is only marginally detected in individual nights, but we give the
formal fits. The value we report relies on the nigthly spectra for
3957 13CH+line is only marginally detected in individual nights, but we give the
formal fits. The value we report relies on the nigthly spectra for ![]() 4232, and on the coadded spectrum for
4232, and on the coadded spectrum for ![]() 3957.
3957.
Figure 13 summarises our results. The isotopic ratio R is
lower for HD 110432 than for HD 152235 by 4.3![]() ,
and lower than
for HD 170740 by 3.2
,
and lower than
for HD 170740 by 3.2![]() .
In this comparison we have used the
conservative uncertainties
.
In this comparison we have used the
conservative uncertainties ![]() ,
derived from the scatter of Rfor different nights and different overtones.
,
derived from the scatter of Rfor different nights and different overtones.
![\begin{figure}
\par\resizebox{8.8cm}{!}{\includegraphics[clip]{2149fig13.eps}}
\end{figure}](/articles/aa/full/2005/37/aa2149-04/img148.gif) |
Figure 13:
A plot of individual R values for the lines of sight
studied in this work. The thick lines are |
| Open with DEXTER | |
The weighted average of R for the 9 lines of sight considered in
this work with 13CH+ detections is
![]() C/13C =
C/13C =
![]() .
The weighted 1
.
The weighted 1![]() dispersion of the
data is 12.7. The hypothesis that the observed scatter is
derived from a single value of R can be tested by calculating the
corresponding value of
dispersion of the
data is 12.7. The hypothesis that the observed scatter is
derived from a single value of R can be tested by calculating the
corresponding value of
![]() ,
where
,
where ![]() is the number of
the degrees of freedom (the number of line of sights less one free
parameter). We obtain
is the number of
the degrees of freedom (the number of line of sights less one free
parameter). We obtain
![]() ,
which discards the
hypothesis at a confidence level of essentially 1.
,
which discards the
hypothesis at a confidence level of essentially 1.
The observed scatter is not due to the galactocentric abundance
gradient studied by Hawkins & Meyer (1989), and predicted by
Galactic chemical evolution models. The targets in our sample all lie
within 30 deg of l=0, and at distances of at most ![]() 200 pc
(except for the clouds toward HD 157038 and HD 169454, whose distances
are unknown). Figure 13 also gives longitude and distance
information for each target.
200 pc
(except for the clouds toward HD 157038 and HD 169454, whose distances
are unknown). Figure 13 also gives longitude and distance
information for each target.
Our value for
![]() is significantly higher than those for
the Pleiades,
is significantly higher than those for
the Pleiades, ![]() Per and P Cyg. Vanden Bout & Snell (1980)
measured 49
+12-8 and 59
+24-13 for 20 Tau (Maia in the
Pleiades) and
Per and P Cyg. Vanden Bout & Snell (1980)
measured 49
+12-8 and 59
+24-13 for 20 Tau (Maia in the
Pleiades) and ![]() Per. Hawkins & Jura (1987) report R values of
Per. Hawkins & Jura (1987) report R values of ![]() for
for ![]() Per,
Per, ![]() for 20 Tau,
for 20 Tau, ![]() for 23 Tau (also in the Pleiades), and
for 23 Tau (also in the Pleiades), and ![]() for P Cyg. Hawkins et al. (1993) confirm a low value of
for P Cyg. Hawkins et al. (1993) confirm a low value of ![]() for
for ![]() Per.
Even taking 3
Per.
Even taking 3![]() errors, the measurements by Hawkins et al. are
below our results. One can ask whether the 13C enrichment in the
Pleiades is due to contamination from past stellar winds in the
cluster itself.
errors, the measurements by Hawkins et al. are
below our results. One can ask whether the 13C enrichment in the
Pleiades is due to contamination from past stellar winds in the
cluster itself.
Aside from the R values obtained by other groups and quoted so far
in this work, there are also those from Centurion & Vladilo
(1991) for ![]() Nor (
Nor (![]() )
and HD 26676 (
)
and HD 26676 (![]() ), which
differ at 2
), which
differ at 2![]() with our average ISM value (including its
scatter).
with our average ISM value (including its
scatter).
From our data set, the values of R vary by 7![]() in the local
translucent clouds, where
in the local
translucent clouds, where ![]() is the uncertainty in the weighted
average value
is the uncertainty in the weighted
average value
![]() .
This is strong
indication that the ISM at the same galactocentric distance is not
completely mixed. If this is the case in the chemical composition of
the ISM in general, then one expects that the D/H ratios in the local
ISM will also differ from place to place. Moos et al. (2002)
(see also Vidal-Madjar 2002) summarise the FUSE results
towards nearby white dwarfs, located within 100 pc of the Sun. The
D I/H I ratios measured with interstellar D I and
H I Lyman absorption varies by less than
.
This is strong
indication that the ISM at the same galactocentric distance is not
completely mixed. If this is the case in the chemical composition of
the ISM in general, then one expects that the D/H ratios in the local
ISM will also differ from place to place. Moos et al. (2002)
(see also Vidal-Madjar 2002) summarise the FUSE results
towards nearby white dwarfs, located within 100 pc of the Sun. The
D I/H I ratios measured with interstellar D I and
H I Lyman absorption varies by less than ![]() 10% towards 7 white dwarfs within 100 pc of the Sun, at the limits of the Local
Bubble. The fractional standard deviation of D I/H I
(the ratio of the scatter in the data to its weighted average) is 12%, but cannot be distinguished from a single D I/H I value within the uncertainties. By contrast, the D I/H I ratios obtained with IMAPS show a factor of 2 scatter towards
10% towards 7 white dwarfs within 100 pc of the Sun, at the limits of the Local
Bubble. The fractional standard deviation of D I/H I
(the ratio of the scatter in the data to its weighted average) is 12%, but cannot be distinguished from a single D I/H I value within the uncertainties. By contrast, the D I/H I ratios obtained with IMAPS show a factor of 2 scatter towards ![]() Vel,
Vel, ![]() Pup and
Pup and ![]() Ori, beyond the Local
Bubble, at distances of 300-500 pc (Jenkins et al. 1999;
Sonneborn et al. 2000).
Ori, beyond the Local
Bubble, at distances of 300-500 pc (Jenkins et al. 1999;
Sonneborn et al. 2000).
Is the scatter in the observed interstellar D I/H I due
to variations in D/H? The primary objective of the IMAPS D
I/H I observations, as stated by Sonneborn et al. (2000), is "to determine D/H with sufficient accuracy to
test for spatial inhomogeneity''. But the D/H ratio is notoriously
difficult to measure, and often involves the use of several different
instruments. The H I lines are ![]() km s-1 broad and
saturated so that N(H I) is measured from the Ly
km s-1 broad and
saturated so that N(H I) is measured from the Ly ![]() damping wings, while N(D I) is best measured from Ly
damping wings, while N(D I) is best measured from Ly ![]() or Ly
or Ly ![]() in the case of the IMAPS targets. The D/H ratio
involves carefully considering the effect of the underlying stellar
continua and the contribution from other interstellar H I components in the rising part of the curve of growth (with a high
ratio of equivalent width to opacity compared to the main absorption
line). Chemical fractionation and selective dissociation of HD affects
D I/H I for lines of sight where H2 is observed, and
differential acceleration by radiation pressure could displace D
I relative to H I in the diffuse ISM. Bruston et al. (1981) assign the D I/H I scatter known at
the time to such effects, and estimate a value of unperturbed D/H almost a factor of two higher than the observed average D/H of
in the case of the IMAPS targets. The D/H ratio
involves carefully considering the effect of the underlying stellar
continua and the contribution from other interstellar H I components in the rising part of the curve of growth (with a high
ratio of equivalent width to opacity compared to the main absorption
line). Chemical fractionation and selective dissociation of HD affects
D I/H I for lines of sight where H2 is observed, and
differential acceleration by radiation pressure could displace D
I relative to H I in the diffuse ISM. Bruston et al. (1981) assign the D I/H I scatter known at
the time to such effects, and estimate a value of unperturbed D/H almost a factor of two higher than the observed average D/H of
![]() .
.
In addition Draine (2004) argues for variable depletion of D onto dust grains, such that the gas phase D/H would be a function of dust processing, which is in turn a function of Galactic environment. The variations in D I/H I do not seem to be a faithful measure of D/H.
What is the level of elemental homogeneity in the ISM? What is the power-spectrum of the dispersion in elemental abundance relative to the total metalicity? Does heterogeneity increase with size?
At least one extreme of spatial scale indicates perfect mixing: the meteoritic evidence favours mixing at the molecular level of interstellar dust from different origin, during the formation of the solar system. Zinner et al. (1991, their Table 1) measured 12C/13C values from 3 to 1000 in different SiC grains found in the Murchison meteorite. At some point in the presolar cloud the SiC grains must have been mixed from a previously heterogenous distribution.
In a recent review of interstellar turbulence and mixing, Scalo & Elmegreen (2004) summarise current knowledge of the level of elemental heterogeneity in the ISM. The stellar return to the ISM should be spotty and poorly mixed. Scalo & Elmegreen explain that in contrast with diffusive processes, turbulence transport does not homogenize the gas at the atomic level. Yet the heterogeneity is notoriously difficult to detect. The available gas-phase diagnostics depend on local excitation, while the stellar data give upper limits only on the dispersion of elemental composition.
But the 12CH+/13CH+ ratio, in contrast to D
I/H I, is a particularly sensitive probe of the mixing
efficiency of the ISM. In terms of the fractional standard deviation
used by Moos et al. (2002), the scatter we have measured is
![]() 16.2% on a
scale of 100 pc. Considering the precise location of the absorbing
material is unknown, we take the Moos et al. (2002)
measurement of a 10% scatter of D I/H I from the mean
value as a indication of inhomogeneity of the local ISM, over 100 pc
scales. This value is similar to the variations reported in this work,
even though D is burned in stellar interiors, rather than produced as
is the case of 13C. Although their absolute yields are different,
the mixing process (i.e. passive scalar turbulence, Scalo & Elmegreen
2004) should be similar for both species.
16.2% on a
scale of 100 pc. Considering the precise location of the absorbing
material is unknown, we take the Moos et al. (2002)
measurement of a 10% scatter of D I/H I from the mean
value as a indication of inhomogeneity of the local ISM, over 100 pc
scales. This value is similar to the variations reported in this work,
even though D is burned in stellar interiors, rather than produced as
is the case of 13C. Although their absolute yields are different,
the mixing process (i.e. passive scalar turbulence, Scalo & Elmegreen
2004) should be similar for both species.
The terrestrial value of R is 90 (Rosman & Taylor 1998),
and is usually extrapolated to the Sun. However, the preliminary
results of Ayres et al. (2005) indicate a photospheric carbon
isotopic ratio of 70. The average value of our measurements of R in
the local ISM,
![]() ,
is slightly lower than the solar value of 90 (or
even higher than the photospheric value of 70). But in fact
,
is slightly lower than the solar value of 90 (or
even higher than the photospheric value of 70). But in fact
![]() is indistinguishable from the solar carbon
isotope ratio given the observed scatter of 12.7.
is indistinguishable from the solar carbon
isotope ratio given the observed scatter of 12.7.
Models of galactic chemical evolution predict an enhancement of 13C relative to 12C with time. Thus our result that 13C/12C has essentially remained constant over the past 4.5 Gyr is surprising. The inconsistency is worsened when comparing
with the preliminary results of Ayres et al. (2005). We may
be affected by a sampling bias. Around 30 lines of sight or more are
required to faithfully estimate
![]() .
.
But is the solar value truly representative of the ISM at the time of collapse of the solar nebula? The process of CO fractionation followed by condensation on cold dust grains may have increased 13C in the pre-solar dust. With an enhanced dust-to-gas ratio through sedimentation in the accretion disk of the Sun, the result may have been a modification in the final R value.
We imagine a 13C-rich disk with a dust mass of 0.01 ![]() ,
dust to gas ratio of unity, accreting on a zero-age Sun with
metalicity Z=0.01. The 13C-poor atmosphere of the disk may have
been blown away by the early solar wind, so that once the accretion of
the disk is concluded, the Sun reaches Z=0.02 and higher 13C/12C than the pre-solar cloud.
,
dust to gas ratio of unity, accreting on a zero-age Sun with
metalicity Z=0.01. The 13C-poor atmosphere of the disk may have
been blown away by the early solar wind, so that once the accretion of
the disk is concluded, the Sun reaches Z=0.02 and higher 13C/12C than the pre-solar cloud.
Aside from the possibility of preferential accretion of 13C over 12C, there is evidence that the solar nebula differed in
composition from the bulk ISM. For instance the metalicity of B stars
in Orion is lower than that of the Sun, even after 4.5 Gyr of Galactic
chemical evolution, indicating that the Sun must have been
exceptionally metal-rich. This discrepancy has been interpreted in the
framework of Galactic diffusion (Wielen 1977), by which the
Sun diffused from its birthplace outwards in Galactocentric radius by
![]() kpc. Since 13C/12C is also
predicted to increase with
kpc. Since 13C/12C is also
predicted to increase with
![]() ,
Galactic diffusion may
bring in agreement the ISM and solar values of R at the time of
solar birth (Wielen & Wilson 1997).
,
Galactic diffusion may
bring in agreement the ISM and solar values of R at the time of
solar birth (Wielen & Wilson 1997).
But perhaps the most compelling evidence that isotopic ratios in the
Sun cannot be taken as direct constraint on the bulk ISM are isotopic
anomalies in meteorites, such as the presence of extinct
radionuclides. For instance Zinner et al. (1991) found that
![]() in the pre-solar nebula. They measured
the concentration of the decay product of 26Al, 26Mg, locked
in SiC grains from the Murchison meteorite. But in other meteorites
26Al/
in the pre-solar nebula. They measured
the concentration of the decay product of 26Al, 26Mg, locked
in SiC grains from the Murchison meteorite. But in other meteorites
26Al/
![]() /4000 in Al-rich minerals from refractory
inclusions not representative of the pre-solar composition. Since the
half-life of 26Al is 106 yr, the pre-solar enrichment in 26Al suggests pollution by a nearby source of 26Al, such as
a supernova explosion (see Zinner et al. 1991; and Clayton
1994, for thorough discussions).
/4000 in Al-rich minerals from refractory
inclusions not representative of the pre-solar composition. Since the
half-life of 26Al is 106 yr, the pre-solar enrichment in 26Al suggests pollution by a nearby source of 26Al, such as
a supernova explosion (see Zinner et al. 1991; and Clayton
1994, for thorough discussions).
The VLT-UVES spectra of CH+ absorption in the lines of sight toward
10 bright stars have allowed us to measure the carbon isotopic ratio
R= 12C/13C with unprecedented accuracy. We confirm previous
measurements of R toward ![]() Oph, and obtain significant scatter
in the local ISM.
Oph, and obtain significant scatter
in the local ISM.
Our value for ![]() Oph is
Oph is
![]() ,
where the
second uncertainty in parenthesis is that obtained a posteriori,
from independent measurements, and independent baseline and absorption
fits. Combining this value with that of Stahl et al. (1992)
gives our best value for
,
where the
second uncertainty in parenthesis is that obtained a posteriori,
from independent measurements, and independent baseline and absorption
fits. Combining this value with that of Stahl et al. (1992)
gives our best value for ![]() Oph,
Oph,
![]() .
.
Averaging our measurements for the 10 lines of sight gives a value
representative of the local ISM:
![]()
![]() ,
with a weighted rms dispersion of 12.7. The
dispersion in isotopic ratio is 7 times the uncertainty in
,
with a weighted rms dispersion of 12.7. The
dispersion in isotopic ratio is 7 times the uncertainty in
![]() - we detect heterogeneity at 7
- we detect heterogeneity at 7![]() .
.
The observed scatter in 13C/12C is the first significant detection of heterogeneity in the isotopic composition of the local ISM, and was obtained with a single instrument and a homogeneous analysis, with a diagnostic independent of the local excitation and of chemical fractionation. The observed variations in R can be extrapolated to an overall elemental heterogeneity, and reveal that mixing in the ISM is not perfect.
The solar carbon isotope ratio of 90 is undistinguishable from the present-day ISM ratio, considering its intrinsic scatter, even after 4.5 Gyr of galactic evolution. This statement is not affected by instrumental uncertainties, although a sampling bias could distort our ISM value. We question whether the solar carbon isotopic ratio is equal to that of the presolar nebula.
A larger sample of stars, and new data towards the Pleiades, the Taurus cloud and P Cyg with 8 m aperture telescopes, will allow a better estimate of the average ISM value, and an improved understanding of the relationship between elemental heterogeneity and spatial scale in the ISM.
Acknowledgements
We thank the referee, Roland Gredel, for critical readings and constructive comments that improved the article. S.C. acknowledges support from Fondecyt grant 1030805, and from the Chilean Center for Astrophysics FONDAP 15010003.
![\begin{figure}
\par\includegraphics[width=16cm,clip]{online/2149fig3.eps}
\end{figure}](/articles/aa/full/2005/37/aa2149-04/img175.gif) |
Figure 3:
|
| Open with DEXTER | |
![\begin{figure}
\par\includegraphics[width=16cm,clip]{online/2149fig4.eps}
\end{figure}](/articles/aa/full/2005/37/aa2149-04/img176.gif) |
Figure 4:
Same as Fig. 3. The fits on the |
| Open with DEXTER | |
![\begin{figure}
\par\includegraphics[width=16cm,clip]{online/2149fig5.eps}
\end{figure}](/articles/aa/full/2005/37/aa2149-04/img177.gif) |
Figure 5:
Same as Fig. 3. The fits on |
| Open with DEXTER | |
![\begin{figure}
\par\includegraphics[width=16cm,clip]{online/2149fig10.eps}
\end{figure}](/articles/aa/full/2005/37/aa2149-04/img178.gif) |
Figure 10:
Same as Fig. 3. None of the |
| Open with DEXTER | |
![\begin{figure}
\par\includegraphics[width=16cm,clip]{online/2149fig11.eps}
\end{figure}](/articles/aa/full/2005/37/aa2149-04/img179.gif) |
Figure 11:
Same as Fig. 8. The information from
|
| Open with DEXTER | |
![\begin{figure}
\par\includegraphics[width=16cm,clip]{online/2149fig12.eps}
\end{figure}](/articles/aa/full/2005/37/aa2149-04/img180.gif) |
Figure 12:
Same as Fig. 8. The spectra around
|
| Open with DEXTER | |