A&A 440, 373-383 (2005)
DOI: 10.1051/0004-6361:20053109
Statistical survey of earthbound interplanetary shocks, associated coronal mass ejections and their space weather consequences![[*]](/icons/foot_motif.gif)
T. A. Howard - S. J. Tappin
School of Physics and Astronomy, University of Birmingham, Edgbaston B15 2TT, UK
Received 22 March 2005 / Accepted 19 May 2005
Abstract
A comprehensive statistical analysis of events relevant to space weather over the 80 month period from January 1998 to August 2004 is presented. A database has been constructed using data from instruments from the SOHO, ACE, WIND and GOES spacecraft, as well as ground magnetometer data. Parameters investigated include times and epochs of halo and partial halo coronal mass ejections (HCMEs) along with details of the interplanetary shock at L1 (0.99 AU), namely the changes in the interplanetary magnetic field and solar wind density, and shock speed. Transit time to the Earth and average transient speed have also been determined, along with the projected speed and angular width of the HCME at the Sun. An estimate is made of the acceleration of the transients on their passage from the Sun to the Earth, and associated solar flare data are considered. Finally, the geoeffectiveness of the events are analysed using  ,
Dst and sudden commencement data. We found that just over a quarter of the 938 HCMEs observed by LASCO were associated with a forward shock near L1, suggesting that around half of the Earthbound HCMEs are either deflected away from the Sun-Earth line or do not form a shock. Around half of the shocks went on to cause a geomagnetic storm, consistent with a southward
,
Dst and sudden commencement data. We found that just over a quarter of the 938 HCMEs observed by LASCO were associated with a forward shock near L1, suggesting that around half of the Earthbound HCMEs are either deflected away from the Sun-Earth line or do not form a shock. Around half of the shocks went on to cause a geomagnetic storm, consistent with a southward
 occurring 50% of the time. There was a general tendency for HCME and shock speeds to be more varied (with more events at higher speeds) around solar maximum, and most events decelerated in transit to the Earth, implying a speed "equalisation'' between the HCME shock and surrounding solar wind, although an assumption of a constant acceleration appears to be invalid. Only around 40% of the shock/storms were associated with an X or M class flare, and there appears to be no relationship between flare intensity and any physical parameter close to the Earth, except in extreme cases. There was a tendency for HCME speed near the Sun to increase with flare intensity. This casts doubt on the validity of using flare data alone as an effective space weather forecaster.
Key words: Sun: coronal mass ejections (CMEs) - Sun: solar-terrestrial relations - Sun: flares - Sun: solar wind -
interplanetary medium - shock waves
A geomagnetic storm is initiated when enhanced energy transfer from the solar wind and interplanetary magnetic field (IMF) leads to an intensification of the Earth's ring current (e.g. Burton et al. 1975). The strength of a geomagnetic storm is mainly affected by two physical properties,
- 1.
- Solar wind ram pressure near the magnetopause, given by
 ,
where
,
where  is the mass density and V is the radial speed of the solar wind. If the solar wind is perturbed by a supersonic ejection causing an interplanetary shock, both
 and
and
 are enhanced locally.
- 2.
- The direction of the z-component of the interplanetary magnetic field (IMF). When this component is directed southward for a long duration, magnetic reconnection occurs between the IMF and the geomagnetic field (Dungey 1961). This allows solar wind plasma particles to be injected into the Earth's ring current. Such an effect does not occur with a northward-directed IMF.
The response of the Earth's magnetosphere to Earthbound interplanetary shocks has been studied by many workers. Gonzalez & Tsurutani (1987) and Gosling et al. (1990) identified a strong relationship between interplanetary shocks observed near the Earth and large geomagnetic storms, while Gosling et al. (1991) and Jurac et al. (2002) have also investigated the effects of interplanetary shocks on the magnetosphere. More recently, Echer et al. (2004) found that solar wind velocity and magnetic field strength variation across the shock were correlated with the Dst index (Sugiura 1964). They also found that near solar maximum, 64% of shocks were followed by a geomagnetic storm (i.e. Dst  -50 by their definition), while near minimum the figure was 46%.
Since their discovery in the early 1970's (Tousey 1973), the properties of coronal mass ejections (CMEs) observed in coronagraph data have been well documented (e.g. Gosling et al. 1976; Howard et al. 1985; Hundhausen 1993; Hundhausen et al. 1994; Yashiro et al. 2004). A Halo CME (HCME) appears in coronagraph data as a CME which encircles the occulting disk as it moves away from the Sun. This is due to a projection effect of a CME travelling along the Sun-Earth line (Howard et al. 1982). The connection between HCMEs, interplanetary shocks and geomagnetic storms is well established (Sheeley et al. 1985; Gosling et al. 1991; Kahler 1992; Fox et al. 1998; Webb et al. 2000, and references therein). For example, Fox et al. (1998) used a halo CME observed in January 1997 to forecast the arrival of a magnetic flux rope and geomagnetic storm at the Earth, while studies by Lindsay et al. (1999) and Dal Lago et al. (2004) found a high correlation between expansion speeds of HCMEs and those of the interplanetary ejecta (magnetic clouds) observed near the Earth. These are not the same as interplanetary shocks, which often precede the magnetic cloud, are faster than the bulk matter, and are good candidates for (or very good indicators of) enhanced geomagnetic activity at the Earth.
Solar flares were originally believed to be the cause of CMEs (e.g. Dryer & Wilson 1979), but several studies using an assortment of instruments have since proven this not to be the case (e.g. Munro et al. 1979; Wagner & MacQueen 1983; Simnett & Harrison 1985; Webb & Hundhausen 1987). It has been shown, for example, that geomagnetic storms and CMEs are not always accompanied by H or X-Ray flares (Joselyn & McIntosh 1981; Munro et al. 1979; Webb & Hundhausen 1987) and in many cases the associated flare occurs after the CME onset (Harrison et al. 1985; Harrison & Sime 1989). While it is incorrect to identify a flare as a source for a CME, they may be used to identify the heliospheric location of at least one footprint of a CME, as these are often connected with an active region or flare (e.g. Simnett & Harrison 1985). It is possible that a common (and yet undiscovered) physical mechanism is responsible for both CMEs and flares.
The behaviour of HCMEs as they propagate through the interplanetary medium is difficult to monitor and it is only recently with instruments such as SMEI on board Coriolis (Eyles et al. 2003) and the forthcoming Heliospheric Imager (HI) on board STEREO (Socker et al. 2000) that progress in this area is beginning to be made. It has been shown that fast CMEs propagating into the slower solar wind medium are subjected to a drag force (Chen & Garren 1993; Cargill 2004, and references therein) which leads to a deceleration of the CME as it travels towards 1 AU. Cargill (2004) describes this drag force as a relationship between the speed of the transient and background solar wind and the solar wind density. There also appears to be a relationship between the longitude of the CME footprint and the occurrence of geomagnetic storms. Work by several authors has demonstrated that HCMEs with associated flares and active regions in the western hemisphere are more likely to connect with the Earth than those in the eastern hemisphere (e.g. Cane et al. 1988; Wang et al. 2002b, 2004), and that HCMEs with footprints close to the Sun-Earth line are also more likely to be geoeffective (e.g. Cane et al. 2000; Gopalswamy et al. 2000). This evidence suggests that several Earthbound HCMEs may be deflected away from the Earth on transit, or may not have sufficient radial speed to establish an interplanetary shock.
This paper presents the results obtained from a survey compiled using 80 months of solar, interplanetary and ground-based data. Almost 300 Earthbound interplanetary shocks were detected near L1 during this time and corresponding HCME activity and subsequent geomagnetic storm occurrence have been identified and documented. Attempts have also been made to estimate the propagation speed, angular width and acceleration of the transient. These have been compared with measured parameters such as initial speed, increase in IMF and solar wind density, and occurrence time. Finally, likely associated flare activity has also been identified and compared with the abovementioned parameters. Another objective was to produce a space weather database for reference by those of interest in the community.
The database was compiled using a combination of data sources:
- 1.
- Coronagraph data were obtained from the Large-Angle Spectroscopic Coronagraph (LASCO, Brueckner et al. 1995) on board the Solar and Heliospheric Observatory (SOHO). Halo, or partial halo CMEs were identified from the following sources:
- (a)
- Analysis and measurement of original LASCO images;
- (b)
- The NRL CME list (St. Cyr et al. 2000), available online at http://lasco-www.nrl.navy.mil/cmelist.html;
- (c)
- The CDAW Data Center CME catalogue (Yashiro et al. 2004), available online at
http://cdaw.gsfc.nasa.gov/CME_list/.
Unless distinction is required, both halo and partial halo CMEs are henceforth referred to as HCMEs. In some cases, interplanetary shocks were not connected with a HCME in either catalogue, but close inspection of LASCO data revealed events at appropriate times. Height-time, speed and angular range measurements were obtained mainly from the two catalogues, but many events required confirmation and/or correction by the authors.
- 2.
- X-Ray solar flare data were obtained from NOAA, available at ftp://ftp.ngdc.noaa.gov/STP/SOLAR_DATA/SOLAR_FLARES/XRAY_FLARES. Identification of the associated solar flare involved a comparison of the listed onset time with the approximate onset time of the HCME. Flares which occurred within an hour of the HCME onset time were listed as likely associated flares.
- 3.
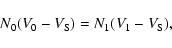
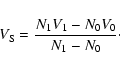
- Interplanetary shock data were obtained primarily from the ACE spacecraft, from direct measurements of the interplanetary magnetic field and solar wind using the MAG (Smith et al. 1998) and the Solar Wind Electron Proton Alpha Monitor (SWEPAM, McComas et al. 1998) instruments. Shock events were also identified using the ACE Shock Lists, available online at http://www.bartol.udel.edu/~chuck/ace/ACElists/obs_list.html and http://www-ssg.sr.unh.edu/mag/ace/ACElists/obs_list.html. This uses least-squares fitting of the incomplete Rankine-Hugoniot relations (excluding those requiring temperature data) to identify interplanetary shocks. During time periods when ACE data were not available (e.g. during January 1998), the Magnetic Fields Investigation (MFI, Lepping et al. 1995) and Solar Wind Experiment (SWE, Ogilvie et al. 1995) on board the WIND spacecraft were used.
The identification of a shock was based on either of the following selection criteria:
- (a)
- A discrete, sudden (time range < 3 min), increase in IMF, solar wind speed and solar wind density simultaneously. The magnitude of the increase should exceed background fluctuations by at least a factor of three in each case.
- (b)
- The event was identified as a shock in an ACE Shock List, and therefore obeys the Rankine-Hugoniot conditions for shock conservation.
- 4.
- Space weather data were obtained from ground-based sources, primarily from the
(a daily index, derived from the three-hourly
 ,
Bartels et al. 1939) and Dst indices. Geomagnetic storm occurrence and intensity were obtained using the criteria outlined in Table 1. The standard definition of storm intensity includes only Dst data (Gonzalez et al. 1994), while we have included
and set the upper threshold of Dst to -60 for a small storm. These data were obtained from the Solar Geophysical Database. This database also includes the times of probable Sudden Commencements (SCs), which were also used to confirm the occurrence of a geomagnetic storm.
,
Bartels et al. 1939) and Dst indices. Geomagnetic storm occurrence and intensity were obtained using the criteria outlined in Table 1. The standard definition of storm intensity includes only Dst data (Gonzalez et al. 1994), while we have included
and set the upper threshold of Dst to -60 for a small storm. These data were obtained from the Solar Geophysical Database. This database also includes the times of probable Sudden Commencements (SCs), which were also used to confirm the occurrence of a geomagnetic storm.
Table 1:
Definition of storm rating.
The database includes 80 months of solar, interplanetary and ground-based data, spanning the complete years of 1998-2003, and up to the end of August 2004. These data are shown in Table 3, and are tabulated according to the following:
- 1.
- IMF and solar wind data obtained from the ACE and WIND spacecraft. This consists of:
- (a)
- Label, date and time of the arrival of the shock at the spacecraft, determined by the jump in IMF (Cols. 1-4);
- (b)
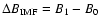
- B0 and B1, the pre- and post-shock IMF magnitude (Cols. 5 and 6);
- (c)
- N0 and N1, the initial and final particle density of the shock (Cols. 7 and 8);
- (d)
- V0 and V1, the initial and final solar wind speed of the shock (Cols. 9 and 10). V0 has been taken as the background solar wind speed
,
as it is a measurement of the bulk SW speed before the shock;
- (e)
 ,
the shock speed (Col. 11), determined from the conservation of mass at the shock front and the assumption that all speeds are radial from the Sun. That is,
,
the shock speed (Col. 11), determined from the conservation of mass at the shock front and the assumption that all speeds are radial from the Sun. That is,
 |
(1) |
or
 |
(2) |
The error is sometimes very significant with this method as the Earth does not always pass through the nose of the shock (e.g. Wang et al. 2003b);
- (f)
- the type of shock (forward or reverse), the spacecraft by which the shock was observed and whether or not the shock is included in the ACE Shock List (Cols. 12-14). For the purposes of the present study, only the forward shocks are discussed.
- 2.
- Geomagnetic ground-based data, including:
- (a)
- the date and time of the arrival of an SC (Cols. 15 and 16). The arrival time is limited to a 3 h time range due to the 3 h average of the index;
- (b)
- the
index of the day of arrival of the shock. As geomagnetic storms generally last 2-3 days the indices of the following two days are given as well (Cols. 17-19);
- (c)
- the minimum Dst index and corresponding hour for the shock arrival day and following two days (Cols. 20-25);
- (d)
- the corresponding storm rating derived from the criteria in Table 1 (Col. 26).
- 3.
- HCME data, including:
- (a)
- the date and time of first appearance in the LASCO C2 coronagraph, which has a Field Of View (FOV) of 2.0-6.0
 (Col. 27);
- (b)
- the angular width as projected in the sky plane (Col. 28). A full halo CME has a projected angular width of 360
 ,
while a partial halo CME has a projected width
,
while a partial halo CME has a projected width 
 (following Yashiro et al. 2004);
- (c)
- the measured speed of the HCME in km s-1
 ,
obtained from height-time profiles taken at a single position angle (Col. 29). This is a projected speed of the HCME in the sky plane. In cases where the HCME is accelerating or decelerating within the FOV of C3 (
,
obtained from height-time profiles taken at a single position angle (Col. 29). This is a projected speed of the HCME in the sky plane. In cases where the HCME is accelerating or decelerating within the FOV of C3 (
 )
(i.e. where a second-order polynomial fits the height-time data better than a linear fit), the maximum or minimum speed is given respectively;
)
(i.e. where a second-order polynomial fits the height-time data better than a linear fit), the maximum or minimum speed is given respectively;
- (d)
- the catalogue from which the HCME was identified, or whether identification was made by the authors (H & T) (Col. 30);
- (e)
- given the projected speed of the HCME and assuming that this speed remains unchanged on transit to the Earth, the estimated propagation time in days was calculated and compared with the actual time of arrival of the shock at ACE/WIND (Cols. 31 and 32). This was only used as a guide to assist in connecting HCMEs with shocks;
- (f)
- in the cases where there is a large discrepancy between the estimated and actual time of arrival at ACE/WIND, the time of arrival was also estimated using the shock speed as measured by ACE/WIND. If the time of arrival at ACE/WIND lay between the estimated times from the LASCO speed and ACE/WIND speed, then it was determined likely to be the same event (Cols. 33-35).
- 4.
- GOES X-Ray flare data, including the start time and class of the flare which was likely to be associated with the HCME (Cols. 36 and 37).
- 5.
- Physical parameters calculated from the combination of the solar and shock data. These include:
- (a)
- the actual time of flight of the transient (Cols. 38 and 39). This is the difference between the arrival time at ACE/WIND and the first appearance of the HCME in LASCO. Although this time is given with an accuracy of minutes, it is probably only accurate to within an hour or two, given that the propagation time of the HCME from its source to the C2 FOV has not been taken into account;
- (b)
- given the time of flight, the average speed
 in km s-1 was determined, using
 ,
where D is the approximate distance from the Sun to ACE (0.99 AU) and T is the actual time of flight (Col. 40).
,
where D is the approximate distance from the Sun to ACE (0.99 AU) and T is the actual time of flight (Col. 40).
- (c)
- assuming that there is a constant acceleration from the Sun to ACE (L1), the following equation:
 |
(3) |
may be used to estimate the initial speed,  ,
of the HCME at the Sun (Col. 41);
,
of the HCME at the Sun (Col. 41);
- (d)
- by comparing
with the projected speed in the sky plane obtained from the LASCO measurements,
,
the angular width of the HCME
 can be approximated by
 |
(4) |
(Col. 42). In some cases
 ,
and so
could not be determined;
,
and so
could not be determined;
- (e)
- finally, the acceleration a can be determined using the linear equation for constant acceleration (Col. 43):
 |
(5) |
- 6.
- The time and/or possible type of storm predicted by the Space Environment Centre (SEC) at NOAA, the archives of which are located at http://www.sec.noaa.gov/alerts/archive.html/.
Matching interplanetary shocks measured near the Earth with HCMEs observed at the Sun is not straightforward, especially during solar maximum, where there may be several occurring within hours of one another. For those events where more than one HCME could be matched with a particular shock, all the possible HCMEs have been included in the database, and each of their corresponding characteristics (associated flare, average speed etc.) determined. The HCME most likely to be connected with the shock is given first in these cases. The possibility that more than one HCME may contribute to a single shock has been discussed by several workers (Burlaga et al. 2001; Wang et al. 2002a, 2003a).
A statistical overview of the events identified in the 80 month time period is given in Table 2. The following summary has been obtained from the events for which LASCO data were available:
Table 2:
Statistical Summary of results drawn from the database. The third column includes only those events for which LASCO data were available.
- 1.
- 27% of all HCMEs were connected with interplanetary shocks. Statistically one would expect
 50% of observed HCMEs to be Earthbound, implying that around 54% of Earthbound HCMEs are connected with interplanetary shocks. The discrepancy could be due to an optimistic definition of a partial halo CME by the authors and creators of the catalogues, or it could be an indication that a substantial fraction of HCMEs do not generate shocks which can be detected at ACE.
- 2.
- 97% of all forward shocks are associated with HCMEs. As shown in Table 2, only 7 shocks could not be connected with HCMEs observed by LASCO. These shocks may be caused by Corotating Interaction Regions (CIRs, e.g. Smith & Wolfe 1976; Rottman et al. 1982; Balogh et al. 1999) or Erupting Magnetic Structures (EMS, Lyons & Simnett 2001) and are discussed by Howard & Tappin (2005).
- 3.
- 46% of all shocks caused geomagnetic storms when they hit the Earth. This proportion is in agreement with the 50% ratio which might be expected, as the z-component of the IMF is directed southward statistically around half of the time.
- 4.
- 40% of all shock/HCMEs, and 42% of all shock/storms are associated with M or X class flares. This suggests that Earthbound and geoeffective CMEs will be associated with a large flare in less than half the cases.
- 5.
- 70% of the geomagnetic storms were preceded by SCs.
![\begin{figure}
\par\includegraphics[width=14.5cm,clip]{3109fig1.eps}
\end{figure}](/articles/aa/full/2005/34/aa3109-05/Timg50.gif) |
Figure 1:
The distribution of various parameters with time. In the cases where more than HCME could be connected with the shock at L1, the likely HCME is indicated with a black circle, while the others are the white circles. In panels a) (shock speed ), b) (average transient speed
)
and c) (projected speed as measured by LASCO
), the average solar wind (417 km s-1) is indicated by the solid horizontal line, while the first standard deviation ( 88 km s-1) shown as the dashed lines. d) Acceleration. The dashed line indicates 0 m/s2. e) Increase in B field 88 km s-1) shown as the dashed lines. d) Acceleration. The dashed line indicates 0 m/s2. e) Increase in B field
 and f) increase in density
  across the shock. g) Estimated HCME width. The solid lines indicate 45,
90
and 135.
h) Flare class
across the shock. g) Estimated HCME width. The solid lines indicate 45,
90
and 135.
h) Flare class
 on a log-linear plot. Solid lines indicate the limits of each class.
 |
| Open with DEXTER |
Figure 1a shows the distribution of the shock speed
plotted against time. The average solar wind (SW) speed was determined by taking the average of all of the pre-shock speeds measured by SWEPAM, and is shown as a solid horizontal line. Most of the shock speeds are greater than the average SW speed and virtually all are greater than the first standard deviation downwards from the mean SW speed. This result is expected as only events which were travelling faster than the surrounding solar wind would be expected to form shocks. There may
be a tendency for greater scatter of shock speeds around solar maximum, but this may be biased due to the larger number of events during this time period when compared with solar minimum. The two fastest shock speeds (>1500 km s-1) were recorded on 5 January and 31 March 2001, which is around solar maximum. It should be noted that the ACE and WIND instruments saturated for some extreme events, such as the October 2003 "Halloween'' event (Veselovsky et al. 2004). While some attempts have been made by workers to provide accurate solar wind speeds for these events (e.g. Skoug et al. 2004), we have not included these measurements in the present study.
The distribution of the average solar wind speed
with time is given in Fig. 1b. In this plot, the best associations are indicated by the filled circles, while alternative possibilities are indicated by open circles. As with the shock speed distribution there may be a tendency for greater scatter around solar maximum. Here the fastest average speeds occur at 2 October 2002 and 8 March 2004, as we head towards solar minimum.
The projected LASCO speed is plotted as a distribution with time in Fig. 1c. The average SW speed is also included in this plot, but it should be noted that SW speeds measured near 1 AU are almost certainly not the same as those near the Sun. There may be a decreasing tendency in speed until around June 2000, a possible pick up in speeds, followed by another drop for around 8 months, from around August 2002 until April 2003. The HCMEs with the fastest projected speeds occur towards the end of 2003, and correspond to the "Halloween'' events. Note that if we neglect the "Halloween'' events we find a general decrease in projected LASCO speeds, starting late in 2000, or around solar maximum. Yashiro et al. (2004), in a study involving some 6600 CMEs (both halo and non-halo) from 1996 to 2002, revealed a similar trend of increasing projected LASCO speeds until 2000, and then a decrease in 2001. However, the maximum average of the projected LASCO speeds occurred in 2002, a finding which is not in agreement with the HCME results of the present study. It should, however, be noted that the high variance of these points in the present study do not indicate a clear trend.
Acceleration is plotted against time in Fig. 1d. Here we include only the events with accelerations in the range
 m/s2. There were 46 (16%) events with acceleration outside the range, but these were omitted as being unrealistic. A large majority (176 or 72%) of the events had a negative acceleration, which is probably related to the relationship between the speed at which the HCME is travelling and the surrounding solar wind. Well over half of the events (146 or 60%) have decelerations between 0 and -5 m/s2. There seems to be a tendency for events to have a higher deceleration around 2001-2003, but the large scatter prevent any conclusive deductions to be made.
Figures 1e and 1f show the distribution of the changes in the IMF and density across the shock for the events. In both plots the distribution appears to be roughly symmetric about a peak at around June 2001, with a small number of anomalous events, such as the "Halloween'' event. Just over half of the events (164 or 56%) had an IMF increase of 5 nT, while 191 (70%, neglecting the events for which there were no density measurements) of the events had a density increase
 .
.
The distribution of estimated HCME width
with time is shown in Fig. 1g. The majority (162 or 73%) of the events have estimated widths between 45
and 135,
with no tendency toward any particular width. There does not appear to be any trend in CME width with time. This is inconsistent with the findings of Yashiro et al. (2004), who found that the majority of the CMEs had apparent widths < .
It should be noted that Earthbound narrow CMEs would probably not be detected by the LASCO coronagraphs, as they would be very faint by the time they reached LASCO's field of view. Also, the chances of the erupting CME geometry crossing the Sun-Earth line decreases as the CME gets narrower.
.
It should be noted that Earthbound narrow CMEs would probably not be detected by the LASCO coronagraphs, as they would be very faint by the time they reached LASCO's field of view. Also, the chances of the erupting CME geometry crossing the Sun-Earth line decreases as the CME gets narrower.
Flare class is plotted with time in Fig. 1h. Note that the C class flares are included as well as the M and X classes. Once again there appears to be a tendency for larger spread of flare classes to higher values as we approach solar maximum, with only two X class flares occurring before June 2000. Once again there is a deviation from the general trend during the "Halloween'' event. There are slightly more flares (103) of an M or X class than there are C class flares (74).
![\begin{figure}
\par\includegraphics[width=8.8cm,clip]{3109fig2.eps}
\end{figure}](/articles/aa/full/2005/34/aa3109-05/Timg54.gif) |
Figure 2:
Variation of a) average transient speed and b) LASCO speed with acceleration. In both cases the zero acceleration line and the average solar wind speed and first standard deviation are shown. In panel a) the 2nd-order polynomial fit for
 ,
where
is the average solar wind speed is indicated. ,
where
is the average solar wind speed is indicated. |
| Open with DEXTER |
Figure 2a shows the distribution of the average speed
plotted against the acceleration. There is a clear, second-order fit which can be assigned to this trend, which is a mathematical consequence of the data. As a was determined with Eq. (5), and
from Eq. (3) it follows that
 |
(6) |
Hence, if the
component dominates Eq. (6) then
 .
The curved solid and dashed lines show the trend for when
is replaced with the average
and its first standard deviation in the case of dominant
(also shown as horizontal lines). From this trend it can be seen that in most cases of negative a, the average speed dominates the shock speed, but the same is not true for the events of positive acceleration.
.
The curved solid and dashed lines show the trend for when
is replaced with the average
and its first standard deviation in the case of dominant
(also shown as horizontal lines). From this trend it can be seen that in most cases of negative a, the average speed dominates the shock speed, but the same is not true for the events of positive acceleration.
A plot of the projected LASCO speed vs. acceleration is shown in Fig. 2b. Some features of note in this plot are:
- 1.
- There are only three events with a speed at the Sun <500 km s-1 which have an acceleration <-10 m/s2. Also, all but one event with a LASCO speed 500 km s-1 lie within
 m/s2.
m/s2.
- 2.
- The majority (47 or 60%) of the events with positive acceleration are associated with HCMEs which are travelling slowly (<600 km s-1) at the Sun and only two events with a positive acceleration have LASCO speeds greater than 1500 km s-1.
- 3.
- The fastest HCMEs (>2000 km s-1) have accelerations between 0 and -10 m/s2.
These results suggest that HCMEs with a low speed at the Sun tend to have low rates of acceleration/deceleration, while the faster HCMEs, while all are decelerating, do not appear to decelerate at a greater rate than the slower events.
![\begin{figure}
\par\includegraphics[width=7.2cm,clip]{3109fig3.eps}
\end{figure}](/articles/aa/full/2005/34/aa3109-05/Timg58.gif) |
Figure 3:
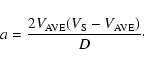
Change in IMF vs. a) shock speed, b) average transient speed, c) projected LASCO speed and d) change in density. In all four cases the linear least squares fit is shown. The equations of each are a)
 (R2 = 0.6), b)
 (R2 = 0.2), c)
 (R2 = 0.1) and d)
 (R2 = 0.5). In panel a) the other dashed line is the limit of the apparent "void'' in the data, with equation
 and the average and standard deviation of the solar wind speed are shown in panel c).
 |
| Open with DEXTER |
In Fig. 3a, the increase in the IMF (
 )
is plotted against the shock speed measured relative to the background solar wind speed, i.e.
)
is plotted against the shock speed measured relative to the background solar wind speed, i.e.
 .
There appears to be a void for the high
,
low
.
There appears to be a void for the high
,
low  region of the plot. The second dashed line shows the first-order least squares fit to the data, which has equation
and correlation coefficient (R2) 0.6. These results reveal a strong tendency for the magnitude of the change in
across a shock to be proportional to the speed of the shock relative to that of the background solar wind.
region of the plot. The second dashed line shows the first-order least squares fit to the data, which has equation
and correlation coefficient (R2) 0.6. These results reveal a strong tendency for the magnitude of the change in
across a shock to be proportional to the speed of the shock relative to that of the background solar wind.
Figure 3b shows a trend of similar parameters to Fig. 2a, except here
is plotted against the relative average transient speed
 .
Here the trend is less apparent, with a linear least squares fit of equation
and R2 = 0.2. The HCMEs with the fastest average speeds (>1500 km s-1) are all associated with low
(5 nT). The distribution is spread even further in Fig. 3c, which shows
plotted against the projected LASCO speed (not subtracted from the background solar wind). Here the least squares fit has equation
and R2 = 0.1.
.
Here the trend is less apparent, with a linear least squares fit of equation
and R2 = 0.2. The HCMEs with the fastest average speeds (>1500 km s-1) are all associated with low
(5 nT). The distribution is spread even further in Fig. 3c, which shows
plotted against the projected LASCO speed (not subtracted from the background solar wind). Here the least squares fit has equation
and R2 = 0.1.
Comparison of the three plots shows quite clearly that HCME speeds measured near the Sun are not strongly correlated with the properties of the disturbance that reaches 1 AU.
Finally, Fig. 3d shows the variation of
with the change in density across the shock,
 .
The least squares fit of equation
and R2 = 0.5 implies a tendency for
to increase proportionately with increasing N across a shock.
.
The least squares fit of equation
and R2 = 0.5 implies a tendency for
to increase proportionately with increasing N across a shock.
![\begin{figure}
\par\includegraphics[width=8cm,clip]{3109fig4.eps}
\end{figure}](/articles/aa/full/2005/34/aa3109-05/Timg64.gif) |
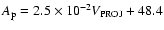
Figure 4:
Plot of shock speed vs. LASCO speed, both given as unitless quantities relative to the solar wind speed (i.e. /
vs.
 )
for each event. The vertical and horizontal dashed lines represent where
and )
for each event. The vertical and horizontal dashed lines represent where
and
 respectively, and the
 line of gradient = 1 is also shown as a dashed line.
 |
| Open with DEXTER |
The plot shown in Fig. 4 shows the shock speed measured at L1 plotted against the projected speed at the Sun as measured by LASCO. Both have been normalised by the associated solar wind speed for each event. The vertical dashed line marks where
 and the horizontal one where
 .
The
line of gradient = 1 is also shown. The majority (82%) of the points lie in the region enclosed by
.
The
line of gradient = 1 is also shown. The majority (82%) of the points lie in the region enclosed by
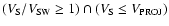 ,
indicating that these events slow down on their passage from the Earth to the Sun. Also, 81% of the points in this region have
,
indicating that these events slow down on their passage from the Earth to the Sun. Also, 81% of the points in this region have
 and 96% have
 .
This indicates that by the time the HCMEs reach L1, their speeds decrease to close to the solar wind speed.
.
This indicates that by the time the HCMEs reach L1, their speeds decrease to close to the solar wind speed.
![\begin{figure}
\par\includegraphics[width=8.5cm,clip]{3109fig5.eps}
\end{figure}](/articles/aa/full/2005/34/aa3109-05/Timg73.gif) |
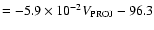
Figure 5:
Flare class (intensity) plotted against LASCO speed. The solid horizontal lines indicated the limits of each class of flare are shown. Vertical lines indicate the average (and standard deviation) solar wind speed(s) while the three remaining dashed lines represent the upper and lower "voids'' of points, spanning the regions
 and
and
 ,
and the linear least squares fit, of equation ,
and the linear least squares fit, of equation
 (R2 = 0.4).
 |
| Open with DEXTER |
Figure 5 shows the intensity of the associated flare (flare class,
)
plotted against the projected LASCO speed. There appears to be a correlation between the intensity of the flare (flare class) and the speed with which the HCME is launched from the solar corona. The dashed lines represent the boundaries of void regions, in which only one event occurs. These voids occur in the high (low)-flare class, low (high) HCME speed regions of the plot. The least squares fit to this plot has equation
and R2 = 0.4.
Variations of flare class against acceleration and the increases in
and N were also produced, but any tendencies in these plots were probably connected to tendencies of these parameters with other physical properties such as
.
![\begin{figure}
\par\includegraphics[width=17cm,clip]{3109fig6.eps}
\end{figure}](/articles/aa/full/2005/34/aa3109-05/Timg74.gif) |
Figure 6:
a) and c)
and b) and d) Dst vs. a) and b) projected LASCO speed and c) and d) shock speed for the events associated with a geomagnetic storm. In all cases the average and first standard deviation from the average solar wind speed is given, and also the linear least squares fit for each case. The equations of these are: a)
 (
R2 = 0.21), b) Dst
(
R2 = 0.21), b) Dst
 (R2 = 0.17) c)
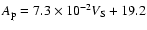 (
R2 = 0.34) and d) Dst
(
R2 = 0.34) and d) Dst
 (
R2 = 0.23).
(
R2 = 0.23). |
| Open with DEXTER |
![\begin{figure}
\par\includegraphics[width=8.5cm,clip]{3109fig7.eps}
\end{figure}](/articles/aa/full/2005/34/aa3109-05/Timg75.gif) |
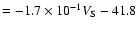
Figure 7:
Flare class vs. a)
and b) Dst for the events associated with the storms. In both cases the limits of each flare class is indicated by the solid lines. |
| Open with DEXTER |
Figure 6 shows the relationship between the
and Dst and both the speeds at the Sun and at L1 for the 117 events which caused a geomagnetic storm at the Earth. As shown by the linear least squares fit to each plot, there is a tendency for
to increase and Dst to decrease with increasing speeds at both the Sun and at L1. The correlation is stronger (
R2 = 0.34 for
and 0.22 for Dst) for the events measured at L1 than those at the Sun (
R2 = 0.21 for
and 0.17 for Dst). Also, only 1 event with a shock speed <350 km s-1 went on to cause a geomagnetic storm, while 10 events were recorded at the sun with these slow speeds which were geoeffective.
A plot of flare class vs.
and Dst is given in Fig. 7. There are 5 events which are associated with a very large geomagnetic storm (
 and Dst < -350), and 4 of these are associated with an X class flare (the remaining event with an M class), indicating a tendency for large flares to be associated with very large storms. Also, there is only one event causing a small storm (neglecting uncertainties) which is associated with an X class flare. For the remaining (and majority of) events, there does not appear to be a correlation.
The results show that a surprisingly small percentage of HCMEs observed at the Sun appeared as a shock near the Earth. Assuming that the partial halo CMEs have been identified correctly, then only around half of the Earthbound HCMEs were observed. This may be because the HCMEs were not travelling fast enough to develop into a shock by the time they reached 1 AU, or that the HCMEs were deflected away from the Earth in transit (Wang et al. 2004). It should be noted that partial halo CMEs were identified strictly on their width and not their geometry. To ensure that the HCME is travelling along the Sun-Earth line an added condition may be to continue the sky-plane projected geometry of the CME through the occulting disk to the Sun. A HCME would be travelling along the Sun-Earth line if the area of the completed structure included the projected location of the centre of the Sun.
The large majority of HCMEs decelerated as they moved through the interplanetary medium. Given the relationship between the drag coefficient on the HCMEs and the speed with which they are travelling (e.g. Chen & Garren 1993), one might expect the deceleration to be greater for the HCMEs with a fast speed near the Sun. This does not appear in our results. It is likely that the assumption of constant acceleration is oversimplified, as changes to interplanetary density and pressure is likely to change significantly as we move toward the Earth. The relative nature of the value of
must also be considered. Further work is needed to estimate the variation in acceleration of the transient. One more convincing demonstration of the deceleration of HCMEs is shown in Fig. 4. Here, the shock speed is lower than the speed measured by LASCO, indicating that the events have slowed down on passage to the Earth. Furthermore, the large majority of the events with shock speeds less than 2
clearly indicate that HCMEs tend toward the solar wind speed, regardless of the initial speed at the Sun. This demonstrates the tendency for HCME/SW speed "equalisation'' as discussed by Cargill (2004).
The three speeds (shock, average and LASCO) revealed similar distributions with time (i.e. a tendency for greater scatter around solar maximum with a small number of anomalous events), but there may be a tendency to favour the parameters which are physically closer to measured speed (e.g. parameters measured at the Earth are more correlated with speeds measured at ACE and flare measurements are more correlated with speeds measured by LASCO). This is best demonstrated in the relationship with
(Fig. 3), where the highest correlation occurred for the shock speed measured at L1, and dropped off significantly for the average and then LASCO speed near the Sun. In all cases there was a tendency for the IMF jump to increase with increasing speed.
One disturbing result is the low percentage of shock/storms which were associated with M or X class flares. Only 40% of those shocks and storms were connected with such a flare, and of those there was no apparent relationship between flare intensity and acceleration, IMF or density increase. While there was a tendency for the extreme cases, i.e. the largest flares were associated with the strongest geomagnetic storms and the smaller storms were not associated with large flares, no such correlation appeared to exist for the majority of the events. There was a correlation between LASCO speed and flare class. This is probably because there is more total energy available in these events, so if a certain percentage of the available energy goes into both the flare and the CME, then more energy would go to each. This would lead to an enhancement of both the speed of the CME and the intensity of the flare. Also, for the largest events (i.e. the events with the largest amount of energy available) it is conceivable that the surrounding solar wind may not have slowed the fastest CMEs to the same level as the majority of the events, indicating their arrival at the Earth with a larger speed. It would therefore appear that the observed correlations are secondary. Based on these results we conclude that using flares alone is an inaccurate method for geomagnetic storm prediction, as more than half the storms were not associated with flares, and there was no apparent physical relationship between flare intensity and any parameter measured near the Earth.
There is a tendency for the faster events to produce larger geomagnetic storms. This is because the solar wind ram pressure, which is a driver for geomagnetic activity, is a function of the solar wind or shock speed. The results were more apparent in the data measured near the Earth, while many events had associated LASCO speeds which were quite low. This is also representative of the nature of HCME speed to change in transit from the Sun to the Earth. It would appear that using LASCO speed may not be an accurate guide for forecasting geomagnetic activity.
The results we have presented here show very clearly that the simple-minded application of the "traditional'' methods of space weather forecasting are inadequate. In particular measurements of flare characteristics and HCME speeds are shown to be poor predictors of the properties of the disturbances reaching 1 AU. Rather such observations of HCMEs need to be combined with dynamic modelling to simulate their progress through the heliosphere (e.g. Cargill 2004).
We have not had the opportunity to compare our observations with the kinematic HAF model (Hakamada & Akasofu 1982; Akasofu & Fry 1986), which uses a large number of solar and heliospheric parameters to generate a global picture of the solar wind, although some idea of its effectiveness can be gained from the indications of successful and unsuccessful forecasts from SEC given in the database.
Limitations of the present study are as follows.
- 1.
- The assumption of constant acceleration, while a useful approximation in many cases, is physically unreasonable. Changes to solar wind speed and density along the Sun-Earth line affect the rate of acceleration of the HCME. We maintain that this assumption can be used to obtain a first-order assumption of the acceleration (e.g. if the HCME increased or decreased in speed). A better indicator of the rate of speed change is shown in Fig. 4.
- 2.
- We cannot be certain that there is a physical link between the flare and the HCME, it may be purely coincidence; however it is plausible that when two major events on the Sun occur simultaneously and close together that some relationship exists between them.
- 3.
- We have made every effort to link every possible HCME with each shock observed at ACE/WIND, but it is physically possible that the shock was caused by an eruption invisible to LASCO, and the appearance of a HCME is coincidence. We believe this latter case to be unlikely, based on the weight of statistical evidence in the present study.
- 4.
- HCME width was estimated using the average speed and an assumption of constant acceleration to estimate the original HCME speed, and then comparing it with the projected speed as measured by LASCO. The physical unreality of constant acceleration makes this assumption inaccurate. A more accurate method of HCME width determination may be to measure the angular width of erupting filaments in H data (Tripathi et al. 2004).
Acknowledgements
The authors would like to thank I. M. Robinson and G. M. Simnett for assistance and helpful discussions. SOHO is a project of international cooperation between ESA and NASA, and the SOHO/LASCO catalogues are maintained by NASA, The Catholic University of America and the US Naval Research Laboratory (NRL). They are made available courtesy of Goddard Space Flight Center and NRL. The "ACE Lists of Disturbances and Transients'' are made available courtesy of the Bartol Research Institute at the University of Delaware and the Experimental Space Plasma Group at the University of Hampshire, and maintained by C. W. Smith. The Solar Geophysical Database and the GOES solar flare catalogue are supported and maintained by NOAA and made available courtesy of the Solar-Terrestrial Physics Division and the Space Environment Center respectively.
- Akasofu,
S.-I., & Fry, C. D. 1986, Planet. Space Sci., 34, 77 [NASA ADS] [CrossRef] (In the text)
- Balogh, A.,
Gosling, J. T., Jokipii, J. R., et al. (eds.) 1999, Corotating
Interaction Regions, Proc. ISSI Workshop
(In the text)
- Bartels, J.,
Heck, N. H., & Johnston, H. F. 1939, J. Geophys. Res., 44,
411 (In the text)
-
Brueckner, G. E., Howard, R. A., Koomen, M. J., et al. 1995, Sol.
Phys., 162, 357 [NASA ADS] [CrossRef] (In the text)
- Burlaga, L.
F., Skoug, R. M., Smith, C. W., et al. 2001, J. Geophys. Res., 106,
20957 [NASA ADS] [CrossRef] (In the text)
- Burton, R. K.,
McPherron, R. L., & Russell, C. T. 1975, J. Geophys. Res., 80,
4204 [NASA ADS] (In the text)
- Cane, H. V.,
Reames, D. V., & von Rosenvinge, D. V. 1988, J. Geophys. Res.,
93, 9555 [NASA ADS] (In the text)
- Cane, H. V.,
Richardson, I. G., & St. Cyr, O. C. 2000, Geophys. Res. Lett.,
27, 3591 [NASA ADS] [CrossRef] (In the text)
- Cargill, P.
J. 2004, Sol. Phys., 221, 135 [NASA ADS] [CrossRef] (In the text)
- Chen, J., &
Garren, D. A. 1993, Geophys. Res. Lett., 20, 2319 [NASA ADS] (In the text)
- Dal Lago, A., Viera,
L. E. A., Echer, E., et al. 2004, Sol. Phys., 222, 323 [NASA ADS] [CrossRef] (In the text)
- Dryer, M., &
Wilson, R. M. 1979, ApJ, 227, 1059 [NASA ADS] [CrossRef] (In the text)
- Dungey, J. W.
1961, Phys. Rev. Lett., 6, 47 [NASA ADS] [CrossRef] (In the text)
- Echer, E., Alves,
M. V., & Gonzalez, W. D. 2004, Sol. Phys., 221, 361 [NASA ADS] [CrossRef] (In the text)
- Eyles, C. J.,
Simnett, G. M., Cooke, M. P., et al. 2003, Sol. Phys., 217,
319 [NASA ADS] [CrossRef] (In the text)
- Fox, N. J., Peredo,
M., & Thompson, B. J. 1998, Geophys. Res. Lett., 25, 2461 [NASA ADS] [CrossRef] (In the text)
- Gonzalez,
W. D., Joselyn, J. A., Kamide, Y., et al. 1994, J. Geophys. Res.,
99, 5771 [NASA ADS] [CrossRef] (In the text)
- Gonzalez, W.
D., & Tsurutani, B. T. 1987, Planet. Space Sci., 35, 1101 [NASA ADS] [CrossRef] (In the text)
- Gopalswamy, N.,
Lara, A., Lepping, R. P., et al. 2000, Geophys. Res. Lett., 27,
145 [NASA ADS] [CrossRef] (In the text)
- Gosling, J.
T., Bame, S. J., McComas, D. J., et al. 1990, Geophys. Res. Lett.,
17, 901 [NASA ADS] (In the text)
- Gosling, J.
T., McComas, D. J., Phillips, J. L., et al. 1991, J. Geophys. Res.,
96, 7831 [NASA ADS] (In the text)
- Gosling, J.
T., Hildner, E., MacQueen, R. M., et al. 1976, Sol. Phys., 48,
389 [NASA ADS] [CrossRef] (In the text)
- Hakamada,
K., & Akasofu, S.-I. 1982, Space Sci. Rev., 31, 3 [NASA ADS] [CrossRef] (In the text)
- Harrison,
R. A., & Sime, D. G. 1989, J. Geophys. Res., 94, 2333 [NASA ADS] (In the text)
- Harrison,
R. A., Waggett, P. W., Bentley, R. D., et al. 1985, Sol. Phys., 97,
387 [NASA ADS] [CrossRef] (In the text)
- Howard, R. A.,
Michels, D. J., Sheeley Jr., N. R., et al. 1982, ApJ, 263,
L101 [NASA ADS] [CrossRef] (In the text)
- Howard, R. A.,
Sheeley Jr., N. R., Michels, D. J., et al. 1985, J. Geophys. Res.,
90, 8173 [NASA ADS] (In the text)
- Howard, T. A.,
& Tappin, S. J. 2005, Geophys. Res. Lett., in press
(In the text)
-
Hundhausen, A. J. 1993, J. Geophys. Res., 98, 113 (In the text)
-
Hundhausen, A. J., Burkepile, J. T., & St. Cyr, O. C. 1994, J.
Geophys. Res., 99, 6543 [NASA ADS] [CrossRef] (In the text)
- Joselyn, J.
A., & McIntosh, P. S. 1981, J. Geophys. Res., 86, 4555 [NASA ADS] (In the text)
- Jurac, S.,
Kasper, J. C., Richardson, J., et al. 2002, Geophys. Res. Lett.,
29
(In the text)
- Kahler, S. W.
1992, ARA&A, 30, 113 [NASA ADS] (In the text)
- Lepping, R.
P., Acuna, M. H., Burlaga, L. F., et al. 1995, Space Sci. Rev., 71,
207 [NASA ADS] [CrossRef] (In the text)
- Lindsay, G.
M., Luhmann, J. G., Russell, C. T., et al. 1999, J. Geophys. Res.,
104, 12515 [NASA ADS] [CrossRef] (In the text)
- Lyons, M. A.,
& Simnett, G. M. 2001, Sol. Phys., 200, 203 [NASA ADS] [CrossRef] (In the text)
- McComas, D.
J., Blame, S. J., Barker, P., et al. 1998, Space Sci. Rev., 86,
563 [NASA ADS] [CrossRef] (In the text)
- Munro, R. H.,
Gosling, J. T., Hildner, E., et al. 1979, Sol. Phys., 61, 201 [NASA ADS] [CrossRef] (In the text)
- Ogilvie, K.
W., Chorney, D. J., Fitzenreiter, R. J., et al. 1995, Space Sci.
Rev., 71, 55 [NASA ADS] [CrossRef] (In the text)
- Rottman, G.
J., Orral, F. Q., & Klimchuk, J. A. 1982, ApJ, 260, 326 [NASA ADS] [CrossRef] (In the text)
- Sheeley, Jr.,
N. R., Howard, R. A., Koomen, M. J., et al. 1985, J. Geophys. Res.,
90, 163 [NASA ADS] (In the text)
- Simnett, G.
M., & Harrison, R. A. 1985, Sol. Phys., 99, 291 [NASA ADS] [CrossRef] (In the text)
- Skough, R. M.,
Gosling, J. T., Steinberg, J., et al. 2004, J. Geophys. Res.,
109
(In the text)
- Smith, C. W.,
Acuna, M. H., Burlaga, L. F., et al. 1998, Space Sci. Rev., 86,
613 [NASA ADS] [CrossRef] (In the text)
- Smith, E. J.,
& Wolfe, J. H. 1976, Geophys. Res. Lett., 3, 137 [NASA ADS] (In the text)
- Socker, D. G.,
Howard, R. A., Korendyke, C. M., et al. 2000, Proc. SPIE, 4139,
284 [NASA ADS] (In the text)
- St. Cyr, O. C.,
Howard, R. A., Sheeley Jr., N. R., et al. 2000, J. Geophys. Res.,
105, 18169 [NASA ADS] [CrossRef] (In the text)
- Sugiura, M.
1964, Ann. Int. Geophys. Year, 35, 945 (In the text)
- Tousey, R.,
Howard, R. A., & Koomen, M. J. 1974, Bull. Am. Astron. Soc., 6,
295 (In the text)
- Tripathi,
D., Bothmer, V., & Cremades, H. 2004, A&A, 422, 337 [EDP Sciences] [NASA ADS] [CrossRef] (In the text)
- Veselovsky,
I. S., Panasyuk, M. I., Avdyushin, S. I., et al. 2004, Cosmic Res.,
42, 435 [NASA ADS] [CrossRef] (In the text)
- Wagner, W. J.,
& MacQueen, R. M. 1983, A&A, 120, 136 [NASA ADS] (In the text)
- Wang, Y. M., Shen,
C. L., Wang, S., et al. 2004, Sol. Phys., 222, 329 [NASA ADS] [CrossRef] (In the text)
- Wang, Y. M.,
Wang, S., & Ye, P. Z. 2002a, Sol. Phys., 211, 333 [NASA ADS] [CrossRef] (In the text)
- Wang, Y. M., Ye,
P. Z., & Wang, S. 2003a, J. Geophys. Res., 108, 1370 [CrossRef] (In the text)
- Wang, Y. M., Ye,
P. Z., Wang, S., et al. 2002b, J. Geophys. Res., 107, 1340 [CrossRef] (In the text)
- Wang, Y. M., Ye,
P. Z., Wang, S., et al. 2003b, Geophys. Res. Lett., 30, 1700 [NASA ADS] [CrossRef] (In the text)
- Webb, D. F., &
Hundhausen, A. J. 1987, Sol. Phys., 108, 383 [NASA ADS] [CrossRef] (In the text)
- Webb, D. F.,
Cliver, E. W., Crooker, N. U., et al. 2000, J. Geophys. Res., 105,
7491 [NASA ADS] [CrossRef] (In the text)
- Yashiro, S.,
Gopalswamy, N., Michalek, G., et al. 2004, J. Geophys. Res.,
109
(In the text)
Copyright ESO 2005
![\begin{figure}
\par\includegraphics[width=14.5cm,clip]{3109fig1.eps}
\end{figure}](/articles/aa/full/2005/34/aa3109-05/img50.gif)
![\begin{figure}
\par\includegraphics[width=8.8cm,clip]{3109fig2.eps}
\end{figure}](/articles/aa/full/2005/34/aa3109-05/img54.gif)
![\begin{figure}
\par\includegraphics[width=7.2cm,clip]{3109fig3.eps}
\end{figure}](/articles/aa/full/2005/34/aa3109-05/img58.gif)
![\begin{figure}
\par\includegraphics[width=8cm,clip]{3109fig4.eps}
\end{figure}](/articles/aa/full/2005/34/aa3109-05/img64.gif)
![\begin{figure}
\par\includegraphics[width=8.5cm,clip]{3109fig5.eps}
\end{figure}](/articles/aa/full/2005/34/aa3109-05/img73.gif)
![\begin{figure}
\par\includegraphics[width=17cm,clip]{3109fig6.eps}
\end{figure}](/articles/aa/full/2005/34/aa3109-05/img74.gif)
![\begin{figure}
\par\includegraphics[width=8.5cm,clip]{3109fig7.eps}
\end{figure}](/articles/aa/full/2005/34/aa3109-05/img75.gif)