![[*]](/icons/foot_motif.gif)
A&A 436, 17-24 (2005)
DOI: 10.1051/0004-6361:20042385
M. Einasto1 - I. Suhhonenko1,2 - P. Heinämäki1,2 - J. Einasto1 - E. Saar1
1 - Tartu Observatory, 61602 Tõravere, Estonia
2 -
Tuorla Observatory, Väisäläntie 20, Piikkiö, Finland
Received 18 November 2004 / Accepted 7 February 2005
Abstract
We study the properties of dark matter haloes of a LCDM
model in different environments. Using the distance of the 5th
nearest neighbour as an environmental density indicator, we show that
haloes in a high density environment are more massive,
richer and have larger radii and larger velocity dispersions than haloes
in a low density environment. Haloes in high density regions move
with larger velocities, and are more spherical than haloes in low
density regions. In addition, low mass haloes in the vicinity of the most
massive haloes are themselves more massive, larger and have larger
rms velocities and larger 3D velocities than low mass haloes far from
massive haloes. The velocities of low mass haloes near massive haloes
increase with the parent halo mass. Our results are in agreement with
recent findings about environmental effects for groups and clusters of
galaxies from deep (SDSS and LCRS) surveys.
Key words: cosmology: large-scale structure of Universe - methods: numerical - methods: N-body simulations
Recent analyses of deep redshift surveys of galaxies, such as the Las Campanas Redshift Survey (LCRS), the Sloan Digital Sky Survey (SDSS) and the two-degree-field (2dF) Galaxy Redshift Survey have demonstrated the presence of environmental enhancement of groups and clusters of galaxies - groups and clusters of galaxies in high density regions are richer, more massive, more luminous and have larger velocity dispersions than groups and clusters of galaxies in low density regions (Einasto et al. 2003a,b,c,d; Ragone et al. 2004).
The goal of the present paper is to study the properties of dark matter (DM) haloes in LCDM simulations in various environments and to compare the properties of these haloes with observational results for groups and clusters of galaxies.
In the next section we describe the numerical model and the halo finding procedure used in our analysis. Then we describe the method used to calculate environmental densities around haloes, and study the properties of haloes in different environments. In the last two sections we give a discussion and summary of our results.
The colour figures and the three-dimensional distribution of the simulated haloes can be seen on EDP web pages, where we also present a catalogue of DM halos.
For the present study we use a flat cosmological model with the
parameters obtained from the WMAP microwave background anisotropy
experiment (Bennett et al. 2003): the total matter density
 ,
the baryonic density
,
the baryonic density
 ,
the vacuum
(dark) energy density (the cosmological constant)
,
the vacuum
(dark) energy density (the cosmological constant)
 ,
the Hubble constant h=0.71 (here and
throughout this paper h is the present-day Hubble constant in units
of 100 km s-1 Mpc-1) and the rms mass density fluctuation
parameter
,
the Hubble constant h=0.71 (here and
throughout this paper h is the present-day Hubble constant in units
of 100 km s-1 Mpc-1) and the rms mass density fluctuation
parameter
 .
.
The simulations were performed using the Multi Level Adaptive Particle Mesh code (MLAPM, Knebe et al. 2001). This code uses adaptive mesh techniques and adaptive force softening; new sub-grids are created in regions where the density exceeds a specified threshold. This scheme allows us to improve considerably the spatial resolution of the particle-mesh code without loss in the mass resolution, similarly to the ART code (Kravtsov & Klypin 1997). It is known that two-particle relaxation may enhance the fraction of particles in clusters. Adaptive force softening is found to prevent mass segregation caused by two-body relaxation, while in other algorithms (etc. GADGET), based on fixed force softening, two-body relaxation is more prominent (Binney & Knebe 2002).
We use the results of a simulation run in a cube of 200 h-1Mpc size,
using a 2563 mesh and the same number of particles. Each particle
has a mass of
 .
The
transfer function was computed using the COSMICS code by
E. Bertschinger (http://arcturus.mit.edu/cosmics/). For
selection of dark matter haloes we used the FoF (Friends-of-Friends)
algorithm (Zeldovich et al. 1982).
.
The
transfer function was computed using the COSMICS code by
E. Bertschinger (http://arcturus.mit.edu/cosmics/). For
selection of dark matter haloes we used the FoF (Friends-of-Friends)
algorithm (Zeldovich et al. 1982).
We use the linking length 0.23 in units of the mean particle
separation, which approximately corresponds to the matter density
contrast
 .
This value was used in compiling the
catalogue of the Las Campanas Loose Groups of Galaxies, hereafter LCLG
(Tucker et al. 2000; Heinämäki et al. 2003). It is
substantially lower than the spherical collapse model prediction for
virialized objects,
.
This value was used in compiling the
catalogue of the Las Campanas Loose Groups of Galaxies, hereafter LCLG
(Tucker et al. 2000; Heinämäki et al. 2003). It is
substantially lower than the spherical collapse model prediction for
virialized objects,
 (White et al. 1993).
Too large a linking length may lead to overestimation of the masses of
the simulated groups since particles outside of the virialized core
are included in the groups. To avoid possible effects of unbound
groups in simulations, we used the virial condition
 (
(
 is the potential energy and
 the kinetic energy of a group) for groups to be included in
our final group catalogue. Moreover, to avoid too small groups we
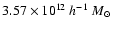
chose only groups that included more than 100 dark matter particles,
imposing a minimum halo mass of
the kinetic energy of a group) for groups to be included in
our final group catalogue. Moreover, to avoid too small groups we
chose only groups that included more than 100 dark matter particles,
imposing a minimum halo mass of
 .
The catalogue contained 5355 dark matter haloes, and
after applying the virial condition, 5219
dark matter haloes remained in our final catalogue.
.
The catalogue contained 5355 dark matter haloes, and
after applying the virial condition, 5219
dark matter haloes remained in our final catalogue.
Figure 1 shows the cumulative mass function for dark matter haloes, compared with observational data (LCLG). The mass function of the LCLG (with Poisson error bars) is shown by filled circles. For a more detailed description of selection effects in the LCLG sample and of the determination of the LCLG mass function see Tucker et al. (2000) and Heinämäki et al. (2003). The solid line shows the mass function of our simulations, with halo masses determined by the sum of the particle masses in the halo. We see that the mass functions of the LCLGs and of the simulation are rather similar. Less massive haloes in our simulation correspond to galaxy groups; the most massive haloes correspond to rich clusters of galaxies.
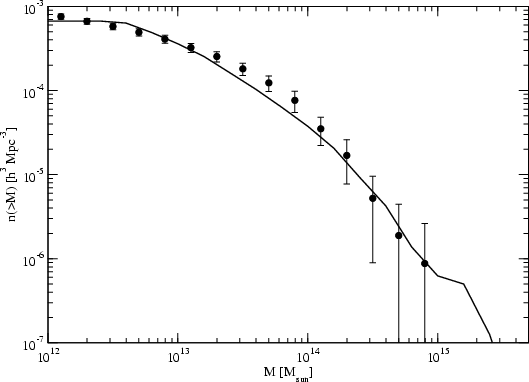 |
Figure 1: The observed mass function and the simulated mass function for haloes; the filled circles show the LCLG result and the solid line describes our simulations. |
| Open with DEXTER | |
Using the 5th neighbour distance we divide the haloes into four environment regions as described in Table 1. The neighbour distance intervals are chosen to have approximately the same number of haloes in each region. The region H23.1 has the closest neighbours and the highest environmental densities, the class H23.4 has the most distant neighbours and the lowest environmental densities.
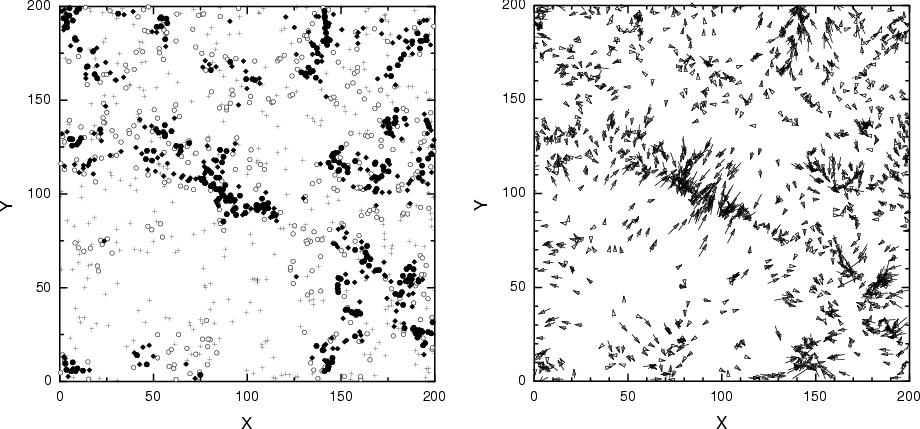 |
Figure 2: The spatial distribution of haloes in regions of different density in a slice of thickness of 50 h-1Mpc (in the Z-direction); the Z interval is 150-200 h-1Mpc. The left panel shows the spatial distribution of haloes, the right panel shows the velocity vectors of haloes. Filled large circles denote haloes in the highest density environment (sample H23.1 in Table 1), filled small diamonds stand for the sample H23.2, open circles for the sample H23.3, and crosses denote haloes in the lowest density environment, sample H23.4. |
| Open with DEXTER | |
In Einasto et al. (2003c) we showed that the properties of the LCLGs in the neighbourhood of rich clusters are enhanced in comparison to the properties of the LCLGs in average. Moreover, in Einasto et al. (2003d) we showed that the LCLGs in superclusters are more massive than loose groups of galaxies that do not belong to superclusters.
To test this result using LCDM haloes, we divided our sample of LCDM
haloes into two richness classes: the most massive haloes that
correspond to rich clusters of galaxies, and less massive haloes that
correspond to loose groups of galaxies. Here we used the mass threshold
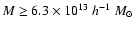 (see Heinämäki et al. 2003). Einasto et al. (2003c) also used this threshold
to determine the population of Abell-class clusters among the LCLGs.
(see Heinämäki et al. 2003). Einasto et al. (2003c) also used this threshold
to determine the population of Abell-class clusters among the LCLGs.
Once two subsamples with different masses were determined, we found
for the most massive haloes their 5 closest neighbours among less
massive haloes (with masses
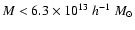 ). Then we divided the population of low mass neighbours
into the populations of close neighbours (CN) and distant neighbours
(DN), using a threshold distance of 6 h-1Mpc. This distance was used in
Einasto et al. (2003c) to define the populations of loose groups
around rich clusters of galaxies.
). Then we divided the population of low mass neighbours
into the populations of close neighbours (CN) and distant neighbours
(DN), using a threshold distance of 6 h-1Mpc. This distance was used in
Einasto et al. (2003c) to define the populations of loose groups
around rich clusters of galaxies.
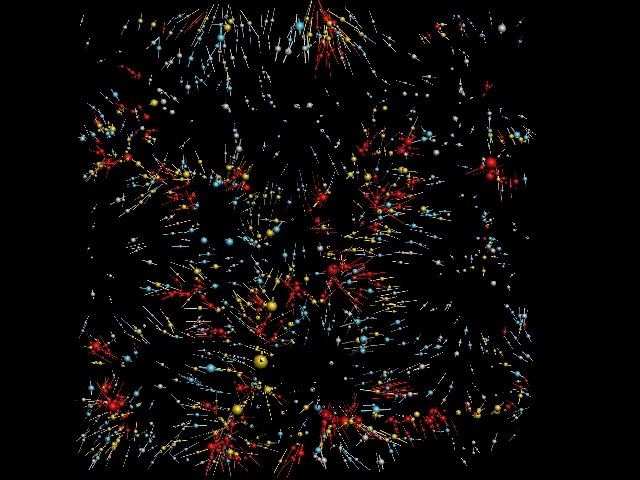
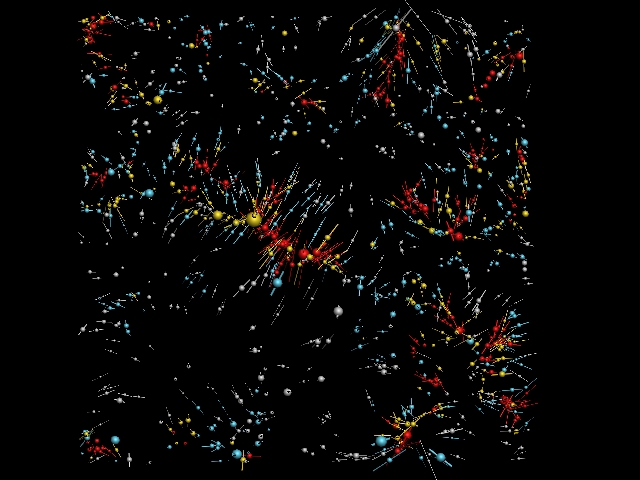
The spatial distribution of haloes in our L=200 h-1Mpc simulation box is shown in Fig. 2; (a 50 h-1Mpc thick slice in the Z-direction; color figures of all slices are given on web page together with animations). This figure shows haloes located in regions of different densities, as quantified by the 5th nearest neighbour distance. In general, in high density regions haloes are bigger and more massive than haloes located in low density regions. The velocities of haloes in high density regions are also larger than the velocities of haloes in low density regions. The velocity vectors of haloes are directed toward rich filaments and massive haloes - mass flows from voids into filaments, which act as attractors. In extreme void regions, where the haloes are most isolated, the haloes almost do not move; they also have low masses.
Table 1: Median and upper quartile (in parentheses) values of halo properties in high and low density environments.
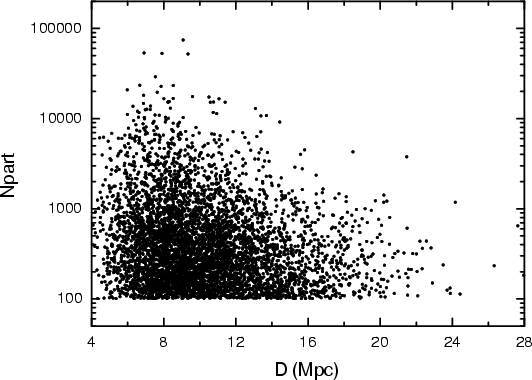 |
Figure 3: The number of particles in haloes versus the distance of the 5th nearest neighbour of the halo. |
| Open with DEXTER | |
Let us now analyse the properties of haloes in various environments in more detail. We made a series of scatter plots in which we plotted the number of particles in haloes, the halo virial radii, masses and velocity dispersions against the distance of the 5th nearest neighbour of the halo, and calculated cumulative distributions of these parameters (the number of particles in haloes, the halo virial radii, masses and velocity dispersions) for haloes from different environments, and the median and upper quartile values of the properties of haloes from high and low density regions. We have also estimated the statistical significance of our results, using the Kolmogorov-Smirnov test.
We compare haloes from different environments in Table 1. The columns show median and upper quartile (in parentheses) values of halo properties in high and low density environments. We show one representative scatter plot for the halo richness (Fig. 3).
Figure 3 and Table 1 show that the properties of haloes in high density regions are environmentally enhanced: they are richer, larger, more massive and have larger velocity dispersions than haloes in low density regions. The haloes in high density regions have larger velocities than haloes in a low density environment. In the lowest density regions (low density filaments and voids) haloes almost do not move. This is seen also in Fig. 2.
The cumulative mass function (MF) is defined as the number density of
clusters/groups above a given mass M, n(>M). We also used the
same definition for other properties of the haloes. Thus we get
the cumulative richness distribution, the cumulative virial radius
distribution, the cumulative rms velocity distribution and the
cumulative peculiar velocity distribution. We plot these functions
for haloes in different environments in Fig. 4.
These figures and Table 1
show that haloes in a high density environment are
richer, have larger masses, larger radii,
larger rms velocities and larger
peculiar velocities than haloes in a low density environment. For
example, at the density level
 the H23.1
clusters are about 3 times richer than the H23.4 clusters.
The cluster class haloes (with mass
)
are preferentially located
in high density regions. A few cluster class haloes, however, are
located in lower density environments. This is due do the
selection procedure of the haloes - the most massive haloes do not
have very close neighbours (they are halo members), thus the local
density is suppressed in the neighbourhood of the halo. This is
also seen in the colour figures on web page.
the H23.1
clusters are about 3 times richer than the H23.4 clusters.
The cluster class haloes (with mass
)
are preferentially located
in high density regions. A few cluster class haloes, however, are
located in lower density environments. This is due do the
selection procedure of the haloes - the most massive haloes do not
have very close neighbours (they are halo members), thus the local
density is suppressed in the neighbourhood of the halo. This is
also seen in the colour figures on web page.
![\begin{figure}
\par\mbox{\includegraphics[width=7.2cm,clip]{2385fig4a.eps}\hspac...
...space{2mm}
\includegraphics[width=7.2cm,clip]{2385fig4d.eps} }
\par\end{figure}](/articles/aa/full/2005/22/aa2385-04/img28.gif) |
Figure 4: The cumulative distributions of various parameters of haloes in different environments. Upper left panel: cumulative richness. Upper right panel: the mass functions. Lower left panel: the cumulative virial radius. Lower right panel: the cumulative velocity. Solid line - the supercluster region H23.1, dotted and dashed lines - the filament regions H23.2 and H23.3, and dot-dashed line - the void region H23.4. |
| Open with DEXTER | |
![\begin{figure}
\par\mbox{\includegraphics[width=7.3cm,clip]{2385fig5a.eps}\hspace{3mm}
\includegraphics[width=7.3cm,clip]{2385fig5b.eps} }
\end{figure}](/articles/aa/full/2005/22/aa2385-04/img29.gif) |
Figure 5: Left panel: the cumulative distributions of eccentricities for simulated haloes in different environments. Solid line - H23.1, dotted line - H23.2, dashed line - H23.3, and dot - dashed line - H23.4. Right panel: The eccentricity of haloes versus the richness of haloes, for all environments. |
| Open with DEXTER | |
We have determined also the eccentricities of DM-haloes. Figure 5 and Table 1 hint at the trend that the eccentricities of haloes in high density regions seem to be smaller than the eccentricities of haloes in low density regions. Haloes in high density regions are more spherical than haloes in low density regions, evidence of a higher degree of virilization.
Figure 5 shows also that the differences between the
eccentricities of haloes from different environments are smaller than
the differences between other parameters (distributions
on the Fig. 5, left panel, for samples
H23.2 and H23.3 even practically overlap). The reason for this can be
seen in the right panel of Fig. 5: haloes of medium
richness (about
200 - 1000 particles, mass
 )
have smaller eccentricities. This is probably due to
several factors: haloes of medium richness are more evolved than very
poor haloes; this makes them more spherical than the poorest haloes.
The shape of the richest haloes is more elongated due to the
influence of the large-scale structure around them (filaments).
Our sample includes also poor haloes (with less than several hundred
particles). Their shape cannot be defined well, and they add noise
to the overall shape distribution.
The environmental dependence of the shapes of haloes is affected
by these factors and is thus weaker than other environmental dependences.
)
have smaller eccentricities. This is probably due to
several factors: haloes of medium richness are more evolved than very
poor haloes; this makes them more spherical than the poorest haloes.
The shape of the richest haloes is more elongated due to the
influence of the large-scale structure around them (filaments).
Our sample includes also poor haloes (with less than several hundred
particles). Their shape cannot be defined well, and they add noise
to the overall shape distribution.
The environmental dependence of the shapes of haloes is affected
by these factors and is thus weaker than other environmental dependences.
The Kolmogorov-Smirnov test shows that the differences between the parameters of haloes from high and low density regions are statistically significant at the 99% significance level for all parameters except eccentricities. The differences between eccentricities of haloes in the highest and the lowest density regions are statistically significant at the 75% significance level according to the Kolmogorov-Smirnov test.
In Table 2 we give the median and upper quartile values of the parameters of the halo populations CN and DN (close neighbours and distant neighbours, see Sect. 3.2). In Fig. 6 we show the cumulative richness distributions, the mass functions, the cumulative virial radius distributions and the cumulative peculiar velocity distributions for low mass haloes around high mass haloes. In Table 2 we also give the statistical significances of the differences between the samples, according to the Kolmogorov-Smirnov test.
Figure 6 and Table 2 show that the low mass haloes in the close neighbourhood of high mass haloes are themselves richer, more massive, have larger rms velocities and move faster than the low mass haloes far from massive haloes. The eccentricities of haloes in the neighbourhood of massive haloes are smaller than the eccentricities of haloes farther away from massive haloes.
![\begin{figure}
\par\mbox{\includegraphics[width=7.3cm,clip]{2385fig6a.eps}\hspac...
...s}\hspace{2mm}
\includegraphics[width=7.3cm,clip]{2385fig6d.eps} }
\end{figure}](/articles/aa/full/2005/22/aa2385-04/img31.gif) |
Figure 6: The cumulative distributions of various parameters for low mass haloes in the vicinity of the most massive haloes. Upper left panel: cumulative richness. Upper right panel: the mass functions. Lower left panel: the cumulative rms velocity. Lower right panel: the cumulative peculiar velocity. Solid line - close neighbours, the sample CN, dashed line - distant neighbours, the sample DN. |
| Open with DEXTER | |
We also checked whether the properties of low mass haloes in the vicinity of massive haloes depend on the masses of high mass haloes. Our calculations show that while the intrinsic properties of low mass haloes do not seem to depend on the mass of the parent massive halo, the peculiar velocities of low mass haloes in the vicinity of massive haloes increase with the parent halo mass (Fig. 7, left panel) - an indication of the gravitational influence of massive haloes.
We obtain similar results if we use summed particle masses instead of virial masses for the massive haloes.
Our calculations show that if we find all low mass neighbours around high mass haloes within a 6 h-1Mpc sphere, (not just 5 closest neighbours), then we obtain almost the same population (with about 470 member haloes) of low mass neighbours. Thus we used the five closest neighbours, in accordance with our definition of environmental densities around haloes.
Table 2: Median and upper quartile (in parentheses) values of the properties of low mass haloes in the neighbourhood of massive haloes.
Early studies of galaxies in different environments have shown the presence of strong morphology-density and luminosity-density relations (Dressler 1980; Postman & Geller 1984; Einasto & Einasto 1987; Einasto 1991a,b; Mo et al. 1992). Presently, these relations are being studied intensively using new deep surveys of galaxies (Norberg et al. 2001, 2002; Croton et al. 2005; Kauffmann et al. 2004; Balogh et al. 2004; and Blanton et al. 2004, among others).
However, the study of the properties of galaxy groups and clusters in various environments is only in the beginning. Observations show that groups and clusters of galaxies in high density regions, in the vicinity of rich clusters of galaxies and in superclusters, are more massive and luminous and have larger velocity dispersions than loose groups on average (Einasto et al. #je2003a<#473,b,c,d, 2004, 2005). This enhancement extends to scales up to about 15-20 h-1Mpc around rich clusters.
Ragone et al. (2004) determined groups of galaxies for the 2dF Galaxy Redshift Survey and studied the properties of these groups in the vicinity of rich clusters. This study confirms the results obtained in Einasto et al. (2003c): groups in the vicinity of rich clusters of galaxies are themselves also richer and more massive than groups on average.
![\begin{figure}
\par\mbox{\includegraphics[width=7.3cm,clip]{2385fig7a.eps}\hspace{2mm}
\includegraphics[width=7.3cm,clip]{2385fig7b.eps} }
\end{figure}](/articles/aa/full/2005/22/aa2385-04/img32.gif) |
Figure 7: Left: peculiar velocities (in km s-1) of low mass haloes around high mass haloes versus the mass of the high mass halo. Right: the rms velocities (in km s-1) of low mass haloes around high mass haloes versus the distance of the low mass halo to the high mass halo. |
| Open with DEXTER | |
In Einasto et al. (2003d) we studied the environmental enhancement of the LCLGs in superclusters. In particular, we calculated for the LCLGs in superclusters the distance to the nearest Abell cluster in superclusters and studied the properties of the LCLGs as a function of the distance to the nearest rich cluster in a supercluster. In analogy to this test we plot the distribution of rms velocities of low mass haloes in the vicinity of massive haloes (Fig. 7, right panel). Note the similarity of Fig. 7, right panel, and Fig. 5 in Einasto et al. (2003d): groups close to rich clusters have larger rms velocities than groups far from rich clusters in a supercluster.
Several studies of the correlation function of nearby groups of galaxies show that groups of higher mass are more strongly clustered than groups on average (Giuricin et al. 2001; Girardi et al. 2000; Merchan et al. 2000). Stronger clustering is an indication that these groups could be located in high density regions (Einasto et al. 1997).
Plionis et al. (2004) showed that the shapes of poor groups of galaxies depend on their richness, poorer groups being more elongated than richer groups and clusters of galaxies. Observations show that very rich clusters of galaxies also are elongated (see references in Plionis et al. 2004). This is in accordance with our results showing that the poorest haloes have larger eccentricities than haloes of medium richness, and the most rich haloes again have larger eccentricities than medium rich haloes.
Several studies of clusters of galaxies have provided evidence that properties of rich clusters depend on their large scale environment (Novikov et al. 1999; Chambers et al. 2002; Einasto et al. 2001; Schuecker et al. 2001; and Plionis & Basilakos 2002) up to a distance of about 20 h-1Mpc. This distance is close to the so-called "pancake scale'' (Melott & Shandarin 1993), and corresponds to the mean thickness of superclusters (Einasto et al. 1994b, 1997; Jaaniste et al. 1998).
Our results on the properties of haloes in different environments are in accordance with these observational results. The LCDM model haloes in high density regions are richer, more massive etc than haloes in low density environments. In particular, low mass haloes around the most massive haloes are themselves also more massive and have larger velocities than haloes farther away from massive haloes.
Our study shows that haloes move toward massive systems. In the vicinity of massive systems the velocities of haloes are larger than in low density regions (voids). This is in accordance with observational studies of velocity fields of galaxy clusters which show that clusters move toward superclusters of galaxies (Hudson et al. 2004, and references therein).
Ragone et al. (2004) determined groups of galaxies from simulations by the Virgo Consortium, and studied the properties of these groups in the vicinity of rich clusters. This study confirmed the results obtained using observational data: groups in the vicinity of rich clusters of galaxies are themselves also richer and more massive than groups on average.
Ragone et al. (2004) also found that the enhancement of the properties of low mass haloes in the vicinity of massive haloes is a strong function of the mass of these massive haloes, while we did not detect such a strong dependence (except for 3D velocities). This difference is probably due to the fact that in this test, Ragone et al. (2004) used different host samples with an increasing mass limit for host haloes, while we did not change the host sample.
Suhhonenko (2003) has demonstrated using different N-body simulations that in simulated superclusters more massive clusters are located in the central regions of superclusters.
Gottlöber et al. (2002) and Faltenbacher et al. (2002) analysed high-resolution simulations of the formation of galaxies, groups and clusters, and found a significant enhancement of the mass of haloes in the environment of other haloes. This effect is especially significant at scales below 10 h-1 Mpc. Therefore, environmental enhancement of the halo mass is direct evidence for the process of hierarchical formation of galaxy and cluster haloes. Haloes inside clusters formed earlier than haloes in low density filaments and are more evolved (Gottlöber et al. 2001, 2003).
Kasun & Evrard (2004) found that the shapes of LCDM haloes do not depend on the large-scale (supercluster) environment of haloes. However, the small hint of such a correlation seen in our study may result from the different definitions of environmental density.
The finding that the richest haloes have larger eccentricities is in accordance with the recent results by Hopkins et al. (2005) who also found that clusters are aligned with one another, in accordance with several observational studies (see references in Hopkins et al. 2005) and the results by Colberg et al. (1999) who showed that the formation of a cluster in simulations is governed by its surrounding large - scale structure, and the properties of clusters are linked to the properties of structures around them. More massive clusters have more filaments than less massive clusters (Colberg et al. 2004a). This finding is in agreement with our result about the environmental dependence of halo properties. Moreover, observations show that rich superclusters usually have a multi-branch structure and that these superclusters contain more luminous clusters than poor superclusters (Einasto et al. 2003b).
Bahcall et al. (1994) and Colberg et al. (2000) found evidence that rich clusters have larger peculiar velocities than poor clusters, and clusters in high density regions have larger peculiar velocities than clusters in low density regions.
In a supercluster-void network haloes move toward density enhancements, where the velocities of haloes are larger than velocities of haloes in a low - density environment: rich systems become richer and the fraction of matter in voids decreases (see also Einasto et al. 1994a). Halos in the lowest density regions have the smallest masses in agreement with the recent results about the mass function of haloes in voids (Colberg et al. 2004b).
Our present paper extends the earlier findings about the environmental enhancement of haloes and shows that haloes in higher density environments, in general, are richer, more massive and have larger velocity dispersions than haloes in low density environment.
The environmental enhancement of galaxy systems in high-density regions was investigated by Einasto et al. (2004, 2005). These studies show that dynamical evolution in high-density regions is determined by the high overall mean density that speeds up the clustering of particles. Therefore, in high density regions clustering starts early and continues until the present. The haloes that populate high density regions are themselves also richer, more massive and have larger velocities than the haloes in low density regions. In low density filaments that cross voids, as well as in the outer low density regions of high density systems, the mean density decreases and thus the evolution is slow, and in these regions haloes themselves are also poor, less massive and have small velocities.
We studied the properties of dark matter haloes in different environments. Our main results are as follows.
Acknowledgements
We thank Mirt Gramann for stimulating discussions. The present study was supported by the Estonian Science Foundation grant 4695 and by the Estonian Research and Development Council grant TO 0060058S98. P.H. was supported by the Jenny and Antti Wihuri foundation. We thank the referee, Dr. S. Colombi, for a very kind report.
Environmental Enhancement of DM Halos
We show the spatial distribution and movement of DM halos (XY coordinates, 50 Mpc slices in Z direction):
1. Slice Z = 0-50 Mpc
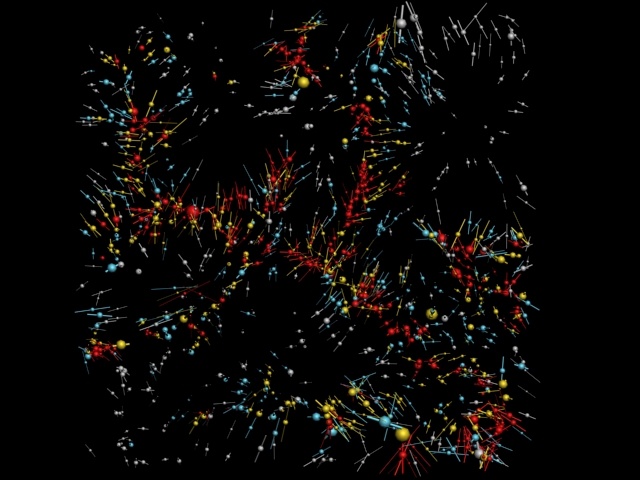 mpeg movie (2.26MB)
2. Slice Z = 50-100 Mpc
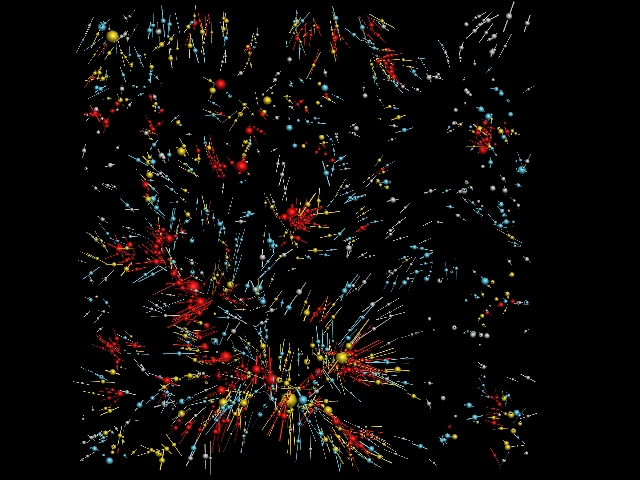 mpeg movie (2.26MB)
3. Slice Z = 100-150 Mpc
 mpeg movie (2.26MB)
4. Slice Z = 150-200 Mpc
 mpeg movie (2.26MB)
Here red spheres represent halos in the highest density environment
(H23.1), yellow, blue and gray spheres - in environment of decreasing
density (H23.2, H23.3, and H23.4).
The sizes of spheres are proportional to their mass.
Velocity vectors show the movement of halos.
In animations, present moment is at 180th frame.
We present a catalogue of DM halos.
File:H23_cat.dat
Description:
Col. 1: Number of particles in a halo;
Col. 2:
 in units of h-1 Mpc;
Col. 3: log(
 )
in units of solar masses;
)
in units of solar masses;
Col. 4: velocity;
Col. 5: rms velocity;
Col. 6 - 8: X, Y, Z coordinates;
Col. 9: eccentricity.