 |
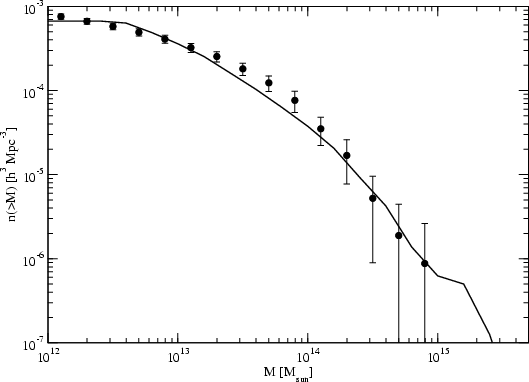
Figure 1: The observed mass function and the simulated mass function for haloes; the filled circles show the LCLG result and the solid line describes our simulations. |
| Open with DEXTER | |
In the text
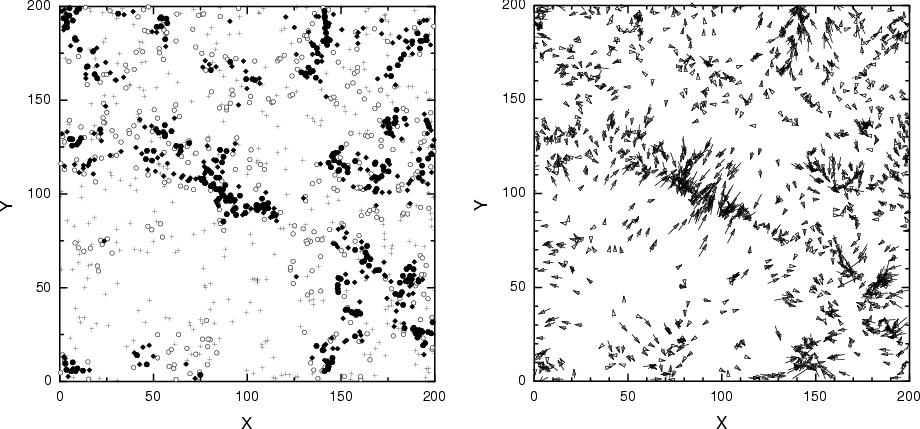 |
Figure 2: The spatial distribution of haloes in regions of different density in a slice of thickness of 50 h-1Mpc (in the Z-direction); the Z interval is 150-200 h-1Mpc. The left panel shows the spatial distribution of haloes, the right panel shows the velocity vectors of haloes. Filled large circles denote haloes in the highest density environment (sample H23.1 in Table 1), filled small diamonds stand for the sample H23.2, open circles for the sample H23.3, and crosses denote haloes in the lowest density environment, sample H23.4. |
| Open with DEXTER | |
In the text
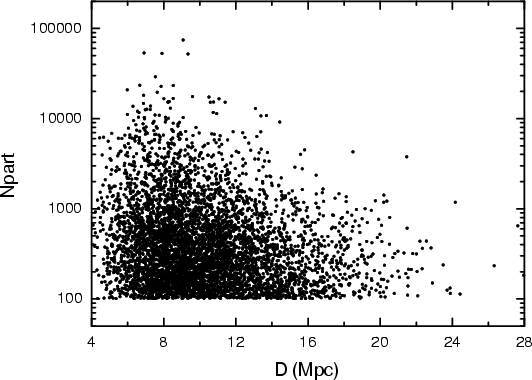 |
Figure 3: The number of particles in haloes versus the distance of the 5th nearest neighbour of the halo. |
| Open with DEXTER | |
In the text
![\begin{figure}
\par\mbox{\includegraphics[width=7.2cm,clip]{2385fig4a.eps}\hspac...
...space{2mm}
\includegraphics[width=7.2cm,clip]{2385fig4d.eps} }
\par\end{figure}](/articles/aa/full/2005/22/aa2385-04/img28.gif) |
Figure 4: The cumulative distributions of various parameters of haloes in different environments. Upper left panel: cumulative richness. Upper right panel: the mass functions. Lower left panel: the cumulative virial radius. Lower right panel: the cumulative velocity. Solid line - the supercluster region H23.1, dotted and dashed lines - the filament regions H23.2 and H23.3, and dot-dashed line - the void region H23.4. |
| Open with DEXTER | |
In the text
![\begin{figure}
\par\mbox{\includegraphics[width=7.3cm,clip]{2385fig5a.eps}\hspace{3mm}
\includegraphics[width=7.3cm,clip]{2385fig5b.eps} }
\end{figure}](/articles/aa/full/2005/22/aa2385-04/img29.gif) |
Figure 5: Left panel: the cumulative distributions of eccentricities for simulated haloes in different environments. Solid line - H23.1, dotted line - H23.2, dashed line - H23.3, and dot - dashed line - H23.4. Right panel: The eccentricity of haloes versus the richness of haloes, for all environments. |
| Open with DEXTER | |
In the text
![\begin{figure}
\par\mbox{\includegraphics[width=7.3cm,clip]{2385fig6a.eps}\hspac...
...s}\hspace{2mm}
\includegraphics[width=7.3cm,clip]{2385fig6d.eps} }
\end{figure}](/articles/aa/full/2005/22/aa2385-04/img31.gif) |
Figure 6: The cumulative distributions of various parameters for low mass haloes in the vicinity of the most massive haloes. Upper left panel: cumulative richness. Upper right panel: the mass functions. Lower left panel: the cumulative rms velocity. Lower right panel: the cumulative peculiar velocity. Solid line - close neighbours, the sample CN, dashed line - distant neighbours, the sample DN. |
| Open with DEXTER | |
In the text
![\begin{figure}
\par\mbox{\includegraphics[width=7.3cm,clip]{2385fig7a.eps}\hspace{2mm}
\includegraphics[width=7.3cm,clip]{2385fig7b.eps} }
\end{figure}](/articles/aa/full/2005/22/aa2385-04/img32.gif) |
Figure 7: Left: peculiar velocities (in km s-1) of low mass haloes around high mass haloes versus the mass of the high mass halo. Right: the rms velocities (in km s-1) of low mass haloes around high mass haloes versus the distance of the low mass halo to the high mass halo. |
| Open with DEXTER | |
In the text