A&A 434, 25-34 (2005)
DOI: 10.1051/0004-6361:20041567
The transient hard X-ray tail of GX 17+2: New BeppoSAX results
R. Farinelli1 - F. Frontera1,2 - A. A. Zdziarski3 - L. Stella4 - S. N. Zhang5,6 - M. van der Klis7 - N. Masetti2 - L. Amati2
1 - Dipartimento di Fisica, Università di Ferrara, via Paradiso
12, 44100 Ferrara, Italy
2 -
Istituto di Astrofisica Spaziale e Fisica Cosmica, Sezione di Bologna, CNR,
via Gobetti 101, 40129 Bologna, Italy
3 -
N. Copernicus Astronomical Center, Bartycka 18, 00-716 Warsaw, Poland
4 -
Osservatorio Astronomico di Roma, via Frascati 33, 00040 Monteporzio Catone, Italy
5 -
Physics Department, University of Alabama in Huntsville, AL 35899 Huntsville, USA
6 -
Space Sciences Laboratory, NASA Marshall Space Flight Center, SD50, AL 35812 Huntsville, USA
7 -
Astronomical Institute "Anton Pannekoek'', University of Amsterdam, Kruislaan 403, 1098 SJ Amsterdam, The Netherlands
Received 30 June 2004 / Accepted 17 December 2004
Abstract
We report on results of two BeppoSAX observations of the Z
source GX 17+2. In both cases the source is in the horizontal branch
of the colour-intensity diagram.
The persistent continuum can be fit by two-component
models consisting of a blackbody plus a Comptonization spectrum.
With one of these models, two solutions for the blackbody temperature of
both the observed and seed photons for Comptonization are equally accepted
by the data. In the first observation, when the source is on the left part of the horizontal branch,
we observe a hard tail extending up to 120 keV, while
in the second observation, when the source moves towards right in the same branch,
the tail is no longer detected.
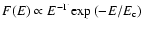
The hard ( 30 keV) X-ray emission can be modeled either by a simple power-law with
photon index
30 keV) X-ray emission can be modeled either by a simple power-law with
photon index
 ,
or assuming Comptonization of
,
or assuming Comptonization of  1 keV soft photons
off a hybrid thermal plus non-thermal electron plasma.
The spectral index of the non-thermal injected electrons is
1 keV soft photons
off a hybrid thermal plus non-thermal electron plasma.
The spectral index of the non-thermal injected electrons is
 .
The observation of hard X-ray emission only in the left part of the horizontal branch could be indicative of the presence of a threshold in the
accretion rate above which the hard tail disappears.
An emission line at 6.7 keV with equivalent width
.
The observation of hard X-ray emission only in the left part of the horizontal branch could be indicative of the presence of a threshold in the
accretion rate above which the hard tail disappears.
An emission line at 6.7 keV with equivalent width  eV is also
found in both observations.
We discuss these results and their physical implications.
eV is also
found in both observations.
We discuss these results and their physical implications.
Key words: stars: individual: GX 17+2 - stars: neutron - X-rays: binaries - accretion, accretion disks
1 Introduction
Z sources form the brightest class of galactic Low Mass X-ray Binaries
(LMXBs), with X-ray luminosities typically in the range
0.5-1 times the Eddington luminosity (where
 erg s-1).
Their name arises from the pattern they trace in the colour-colour
or hardness-intensity diagram (CD and HID, respectively) on typical time scales of days. The three regions which characterize the
Z-track, from the top, are the horizontal branch (HB), the normal branch (NB)
and the flaring
branch (FB).
Multifrequency observations of Sco X-1 (Vrtilek et al. 1991a; Hertz et al. 1992; Augusteijn et al. 1992)
and Cyg X-2 (van Paradaijs et al. 1990; Vrtilek et al. 1990; Hasinger et al. 1990) have shown that the accretion rate
erg s-1).
Their name arises from the pattern they trace in the colour-colour
or hardness-intensity diagram (CD and HID, respectively) on typical time scales of days. The three regions which characterize the
Z-track, from the top, are the horizontal branch (HB), the normal branch (NB)
and the flaring
branch (FB).
Multifrequency observations of Sco X-1 (Vrtilek et al. 1991a; Hertz et al. 1992; Augusteijn et al. 1992)
and Cyg X-2 (van Paradaijs et al. 1990; Vrtilek et al. 1990; Hasinger et al. 1990) have shown that the accretion rate  increasing as the sources move in the direction
 is consistent with UV observations and some QPO models.
Several two-component models have been proposed to fit the low energy (
is consistent with UV observations and some QPO models.
Several two-component models have been proposed to fit the low energy ( 20 keV)
X-ray spectra of Z sources, such as a simple or Comptonized blackbody ( BB)
plus a multicolour disk blackbody ( DBB, the "Eastern Model'', Mitsuda et al. 1984, 1989), a BB plus an unsaturated Comptonization spectrum (
20 keV)
X-ray spectra of Z sources, such as a simple or Comptonized blackbody ( BB)
plus a multicolour disk blackbody ( DBB, the "Eastern Model'', Mitsuda et al. 1984, 1989), a BB plus an unsaturated Comptonization spectrum (
 ,
the
"Western Model'', White et al. 1986, 1988) and, more recently,
a DBB plus the Comptonization model worked out by Titarchuk (1994;
COMPTT in XSPEC, Piraino et al. 2002; Di Salvo et al. 2002).
In recent years, transient hard X-ray tails extending up to
100 keV have been discovered from the classical Z sources (GX 5-1, Asai et al. 1994;
Cyg X-2, Frontera et al. 1998; Di Salvo et al. 2002; GX 17+2, Di Salvo et al. 2000, hereafter DS2000; Sco X-1, D'Amico et al. 2001; GX 349+2, Di Salvo
et al. 2001) and from the peculiar Z source Cir X-1 (Iaria et al. 2001). All these
hard tails have been fit with power-laws ( PL,
,
the
"Western Model'', White et al. 1986, 1988) and, more recently,
a DBB plus the Comptonization model worked out by Titarchuk (1994;
COMPTT in XSPEC, Piraino et al. 2002; Di Salvo et al. 2002).
In recent years, transient hard X-ray tails extending up to
100 keV have been discovered from the classical Z sources (GX 5-1, Asai et al. 1994;
Cyg X-2, Frontera et al. 1998; Di Salvo et al. 2002; GX 17+2, Di Salvo et al. 2000, hereafter DS2000; Sco X-1, D'Amico et al. 2001; GX 349+2, Di Salvo
et al. 2001) and from the peculiar Z source Cir X-1 (Iaria et al. 2001). All these
hard tails have been fit with power-laws ( PL,
 )
with photon index
)
with photon index  ranging from -1 (Sco X-1, when the source was in the FB)
to 3.3 (Cir X-1).
The time behaviour of the hard tail is complex and still not well understood.
DS2000 observed a strong hard tail in GX 17+2 when the
source was on the left part of the HB; as the source moved on the right across the branch,
an independent fit of the photon index and PL normalization was not possible, and fixing the photon index at 2.7 yielded
an intensity of the PL that lowered (chance probability of F-test 10-4) until
it disappeared at the HB-NB apex.
In the case of Cyg X-2 (Di Salvo et al. 2002) the hard tail was observed when
the source was in the HB, while in a later observation, when the source was
in the NB, no evidence of hard X-ray emission was found.
The hard tail of GX 5-1 (Asai et al. 1994) was detected when the source was in the NB, and
decreased as the source moved to the FB.
If
actually increases from HB to FB, these results could be indicative of the presence of an anti-correlation between hard X-ray emission and accretion rate .
However, the results of D'Amico et al. (2001) contrast with this scenario,
as in Sco X-1 the hard tail was observed in all branches without any apparent correlation with
the source position on the CD.
ranging from -1 (Sco X-1, when the source was in the FB)
to 3.3 (Cir X-1).
The time behaviour of the hard tail is complex and still not well understood.
DS2000 observed a strong hard tail in GX 17+2 when the
source was on the left part of the HB; as the source moved on the right across the branch,
an independent fit of the photon index and PL normalization was not possible, and fixing the photon index at 2.7 yielded
an intensity of the PL that lowered (chance probability of F-test 10-4) until
it disappeared at the HB-NB apex.
In the case of Cyg X-2 (Di Salvo et al. 2002) the hard tail was observed when
the source was in the HB, while in a later observation, when the source was
in the NB, no evidence of hard X-ray emission was found.
The hard tail of GX 5-1 (Asai et al. 1994) was detected when the source was in the NB, and
decreased as the source moved to the FB.
If
actually increases from HB to FB, these results could be indicative of the presence of an anti-correlation between hard X-ray emission and accretion rate .
However, the results of D'Amico et al. (2001) contrast with this scenario,
as in Sco X-1 the hard tail was observed in all branches without any apparent correlation with
the source position on the CD.
Table 1:
Log of the two observations of GX 17+2 with the on-source
exposure time for each NFI.
1.1 GX 17+2
GX 17+2 is one of strongest Galactic X-ray sources, and was detected
in the sixties (e.g., Friedman et al. 1967).
Simultaneous X-ray and radio observations, performed by White et al. (1978),
did not show the presence of significant radio emission, but revealed correlated
X-ray intensity and spectral variations similar to those already observed from
Sco X-1.
Observation of the source with the Gas Scintillation Proportional
Counter (2-20 keV) on-board EXOSAT (White et al. 1986) provided an accurate
determination of the source continuum spectrum, which was fit in the context of the
Western model with best-fit parameters
 keV, radius of the BB
emitting sphere
keV, radius of the BB
emitting sphere
 km,
km,
 and
and
 keV. Also an emission line at 6.5 keV
with equivalent width (EW) of 110 eV was detected.
The data analysis of the same observation, but with
the Medium Energy Proportional Counter Array, showed that
the 1-30 keV source spectrum could be fit with a BB
(
keV. Also an emission line at 6.5 keV
with equivalent width (EW) of 110 eV was detected.
The data analysis of the same observation, but with
the Medium Energy Proportional Counter Array, showed that
the 1-30 keV source spectrum could be fit with a BB
(
 keV) plus the Comptonization model proposed by Sunyaev &
Titarchuk (1980), with electron temperature
keV) plus the Comptonization model proposed by Sunyaev &
Titarchuk (1980), with electron temperature
 keV and optical
depth of the electron cloud of
keV and optical
depth of the electron cloud of
 (White et al. 1988).
The column density along the source direction was determined by Vrtilek et al. (1991b) with Einstein (0.2-20 keV), who found a value of
(White et al. 1988).
The column density along the source direction was determined by Vrtilek et al. (1991b) with Einstein (0.2-20 keV), who found a value of
 cm-2, assuming a simple BB (
 keV)
as best-fit model.
Hoshi & Asaoka (1993) observed the source with Ginga in both the HB and
the NB. By fitting the 1-20 keV X-ray spectrum with the first version of the Eastern model
( BB + DBB), these authors found that the inner disk temperature and the projected radius
of the DBB did not change significantly from the NB to the
HB, while the BB temperature gradually increased
from to 2.1 keV to 2.7 keV.
DS2000 analyzed the 0.1-100 keV X-ray spectrum of GX 17+2 with BeppoSAX, discovering a transient hard X-ray tail in addition to the persistent continuum.
The latter was well described by a BB plus COMPTT model, with best-fit parameters
keV)
as best-fit model.
Hoshi & Asaoka (1993) observed the source with Ginga in both the HB and
the NB. By fitting the 1-20 keV X-ray spectrum with the first version of the Eastern model
( BB + DBB), these authors found that the inner disk temperature and the projected radius
of the DBB did not change significantly from the NB to the
HB, while the BB temperature gradually increased
from to 2.1 keV to 2.7 keV.
DS2000 analyzed the 0.1-100 keV X-ray spectrum of GX 17+2 with BeppoSAX, discovering a transient hard X-ray tail in addition to the persistent continuum.
The latter was well described by a BB plus COMPTT model, with best-fit parameters
 keV,
keV,
 km, temperature of the seed photons
to be Comptonized
km, temperature of the seed photons
to be Comptonized
 keV, electron temperature
 3 keV and
optical depth of the Comptonizing cloud
3 keV and
optical depth of the Comptonizing cloud
 ,
assuming a spherical geometry.
Additionally, they
found evidence for an emission line with energy centroid
,
assuming a spherical geometry.
Additionally, they
found evidence for an emission line with energy centroid
 keV and
 eV, and an absorption edge with
 keV
and optical depth
keV
and optical depth
 .
Type I X-ray bursts from GX 17+2 were observed with the Einstein
(Kahn & Grindlay 1984), HAKUCHO (Tawara et al. 1984)
and EXOSAT (Sztajno et al. 1986) satellites.
.
Type I X-ray bursts from GX 17+2 were observed with the Einstein
(Kahn & Grindlay 1984), HAKUCHO (Tawara et al. 1984)
and EXOSAT (Sztajno et al. 1986) satellites.
Despite the X-ray brightness, the optical counterpart of GX 17+2 has not yet
been unambiguously identified. The difficulties arise mainly because of the position
of the source near the Galactic center (
 ),
where the chance of superposition to unrelated field objects is very high.
),
where the chance of superposition to unrelated field objects is very high.
In this paper we report on the results obtained from two BeppoSAX observations
of GX 17+2, performed before the October 1999 observation reported by DS2000.
In Sect. 2 we describe the observations and data analysis,
in Sect. 3 we present the results of the
timing and spectral analysis, in Sect. 4 we discuss
the results and in Sect. 5 we draw our conclusions.
2 Observations and data analysis
We observed the source twice, on 1997 April 3 and 21,
with the Narrow Field Instruments (NFIs) on board BeppoSAX (Boella et al. 1997a).
The NFIs include a Low-Energy Concentrator Spectrometer (LECS,
0.1-10 keV; Parmar et al. 1997), three Medium-Energy Concentrator
Spectrometers (MECS, 1.5-10 keV; Boella et al. 1997b), a High-Pressure
Gas Scintillation Proportional Counter (HPGSPC, 4-120 keV; Manzo et al.
1997), and a Phoswich Detection System (PDS, 15-300 keV; Frontera et al. 1997). Both observations were performed with all three MECS units
(MECS unit 1 failed on 1997 May 6).
Table 1 reports the observations log along with the on-source
exposure times of each NFI and the mean 1.8-10 keV and 13-200 keV count rate measured by
all the three MECS units and by the four PDS units, respectively.
During all pointings the NFIs worked nominally and the source was
detected by all of them. Good data were selected from intervals when the NFIs
elevation angle was above the Earth limb by at least  and, for the LECS,
during the dark earth.
The SAXDAS 2.0.0 data analysis package was used for
processing the LECS, MECS and HPGSPC data, while the PDS data reduction was
performed using the XAS package v2.1 (Chiappetti & Dal Fiume 1997).
The LECS and MECS spectra were extracted from a region of 4
and, for the LECS,
during the dark earth.
The SAXDAS 2.0.0 data analysis package was used for
processing the LECS, MECS and HPGSPC data, while the PDS data reduction was
performed using the XAS package v2.1 (Chiappetti & Dal Fiume 1997).
The LECS and MECS spectra were extracted from a region of 4 radius
centered on the source position. The background spectrum for the LECS and the MECS
was determined using the standard blank field spectra as reported
by Fiore et al. (1999), while for the HPGSPC and the PDS the background was
estimated with the rocking collimator technique.
The spectra of all NFIs were rebinned to reduce the oversampling in
the energy resolution and to have a minimum of 20 counts in each bin, in order to reliably use the
radius
centered on the source position. The background spectrum for the LECS and the MECS
was determined using the standard blank field spectra as reported
by Fiore et al. (1999), while for the HPGSPC and the PDS the background was
estimated with the rocking collimator technique.
The spectra of all NFIs were rebinned to reduce the oversampling in
the energy resolution and to have a minimum of 20 counts in each bin, in order to reliably use the
 statistics for spectral fitting.
For each instrument we performed the spectral and temporal analysis in the
energy range where the response function is well determined; on the basis of
this extension, the energy range is 0.4-4.0 keV for LECS, 1.8-10 keV for MECS and 8-30 keV for HPGSPC, while for PDS the range is 13-120 keV in the first observation and
13-40 keV in the second one as the source was not detected beyond 40 keV.
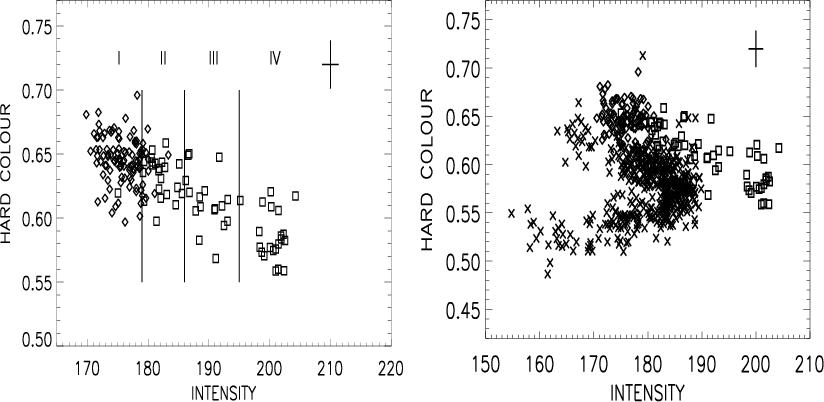
We performed spectral analysis over four different regions, named I, II, III and IV,
according to the 1.8-10 keV MECS count rate being 180 s-1, between 180 and 185 s-1, between 185 and 195 s-1 and 195 s-1 (see Fig. 1).
We note that region I is entirely covered by the points of the first
observation while the other regions are covered by the second observation.
Only few points of the second observation fall in region I, so we
could not extract statistically significant spectral information
in this region during the second observation. For the latter we then extracted both
the average spectrum and the separated spectra for regions II, III and IV.
statistics for spectral fitting.
For each instrument we performed the spectral and temporal analysis in the
energy range where the response function is well determined; on the basis of
this extension, the energy range is 0.4-4.0 keV for LECS, 1.8-10 keV for MECS and 8-30 keV for HPGSPC, while for PDS the range is 13-120 keV in the first observation and
13-40 keV in the second one as the source was not detected beyond 40 keV.
We performed spectral analysis over four different regions, named I, II, III and IV,
according to the 1.8-10 keV MECS count rate being 180 s-1, between 180 and 185 s-1, between 185 and 195 s-1 and 195 s-1 (see Fig. 1).
We note that region I is entirely covered by the points of the first
observation while the other regions are covered by the second observation.
Only few points of the second observation fall in region I, so we
could not extract statistically significant spectral information
in this region during the second observation. For the latter we then extracted both
the average spectrum and the separated spectra for regions II, III and IV.
We used the XSPEC v11.2.0 package to fit the multi-instrument energy spectra.
In the broad-band fits, normalization factors were applied to LECS, HPGSPC
and PDS spectra following the cross-calibration tests between them and the MECS,
constraining them within the allowed ranges (Fiore et al. 1999).
Interstellar photoelectric absorption, modeled using the cross sections
implemented in XSPEC and with solar abundances given by Anders & Ebihara (1982),
was included in all spectral models used.
Uncertainties in the parameters values
obtained from the spectral fits are single
parameter errors at 90% confidence level, while upper limits
are reported at 2 level.
For the evaluation of the source luminosity we have assumed a distance
of 7.5 kpc (Penninx et al. 1988)
level.
For the evaluation of the source luminosity we have assumed a distance
of 7.5 kpc (Penninx et al. 1988)
![\begin{figure}
\par\includegraphics[height=8.6cm,width=7.14cm,angle=-90,clip]{15...
...udegraphics[height=8.6cm,width=7.14cm,angle=-90,clip]{1567_fig2.ps}
\end{figure}](/articles/aa/full/2005/16/aa1567/Timg44.gif) |
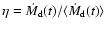
Figure 1:
MECS 1.8-10 keV light curves of the first ( upper panel) and
second ( lower panel) observation of GX 17+2. The bin size in both cases
is 100 s. Time is given in seconds from the beginning of each observation (see Table 1). |
| Open with DEXTER |
3 Results
3.1 Temporal properties
The source 1.8-10 keV light curve of the two observations is shown in
Fig. 1. A flux variability on time scales of hours
is apparent and is confirmed by the fit with a constant function, which
gives /
 .
Unfortunately, the presence of several gaps in the light curve prevents us
to investigate whether the source shows periodic flux modulations.
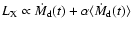
The HID of the two observations, obtained defining as intensity the 1.8-10 keV MECS
count rate
and as hard colour the count-rate ratio in the 6.5-10 keV and
5-6.5 keV energy bands, respectively, is shown in Fig. 2.
As it can be seen, the data points of the first observation are all clustered in
the left side of the diagram, while those of the second observation,
reflecting the source intensity decrease (from 200 s-1 to 180 s-1,
see Fig. 1, lower panel), trace an extended path (regions II, III and IV) that,
on the left side, smoothly merges with the data points of the first observation.
However from the shown HID, it is difficult to
establish which branch of the Z-track our data correspond to.
To solve this issue, we plot in the right panel of Fig. 2 both our
data points and those obtained with BeppoSAX by DS2000, when the source clearly traced
the HB and NB. As DS2000 adopted different energy ranges to produce the HID,
we used the MECS event files of their observations from the BeppoSAX public data archive to derive
a new HID in the same energy ranges adopted by us. From Fig. 2 it is possible to see that
GX 17+2, during our observations, traced almost the entire HB albeit in a slightly shifted position
with respect to that observed by DS2000. Secular shifts of the Z pattern in the HID of GX 17+2 have been
previously observed to occur on time scales of several months by RXTE (Homan et al. 2002) and EXOSAT (Kuulkers et al. 1997). On the others hand, both RXTE and EXOSAT observations revealed strong
stability (within
.
Unfortunately, the presence of several gaps in the light curve prevents us
to investigate whether the source shows periodic flux modulations.
The HID of the two observations, obtained defining as intensity the 1.8-10 keV MECS
count rate
and as hard colour the count-rate ratio in the 6.5-10 keV and
5-6.5 keV energy bands, respectively, is shown in Fig. 2.
As it can be seen, the data points of the first observation are all clustered in
the left side of the diagram, while those of the second observation,
reflecting the source intensity decrease (from 200 s-1 to 180 s-1,
see Fig. 1, lower panel), trace an extended path (regions II, III and IV) that,
on the left side, smoothly merges with the data points of the first observation.
However from the shown HID, it is difficult to
establish which branch of the Z-track our data correspond to.
To solve this issue, we plot in the right panel of Fig. 2 both our
data points and those obtained with BeppoSAX by DS2000, when the source clearly traced
the HB and NB. As DS2000 adopted different energy ranges to produce the HID,
we used the MECS event files of their observations from the BeppoSAX public data archive to derive
a new HID in the same energy ranges adopted by us. From Fig. 2 it is possible to see that
GX 17+2, during our observations, traced almost the entire HB albeit in a slightly shifted position
with respect to that observed by DS2000. Secular shifts of the Z pattern in the HID of GX 17+2 have been
previously observed to occur on time scales of several months by RXTE (Homan et al. 2002) and EXOSAT (Kuulkers et al. 1997). On the others hand, both RXTE and EXOSAT observations revealed strong
stability (within  )
of the hard colour, and this confirms the HB nature of the source during
our observations.
)
of the hard colour, and this confirms the HB nature of the source during
our observations.
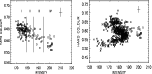 |
Figure 2:
Left panel: HID of the two BeppoSAX observations of GX 17+2.
Diamonds: first observation. Open squares: second observation.
The four count-rate regions are also shown. Each point corresponds to a bin size of 100 s.
Right panel: source HID of both
our observations (same symbols as in the left panel) and that performed by DS2000
( crosses). The bin size of the 1997 October data points is 400 s.
A typical error bar is shown on the top right of each panel. |
| Open with DEXTER |
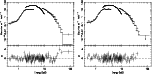 |
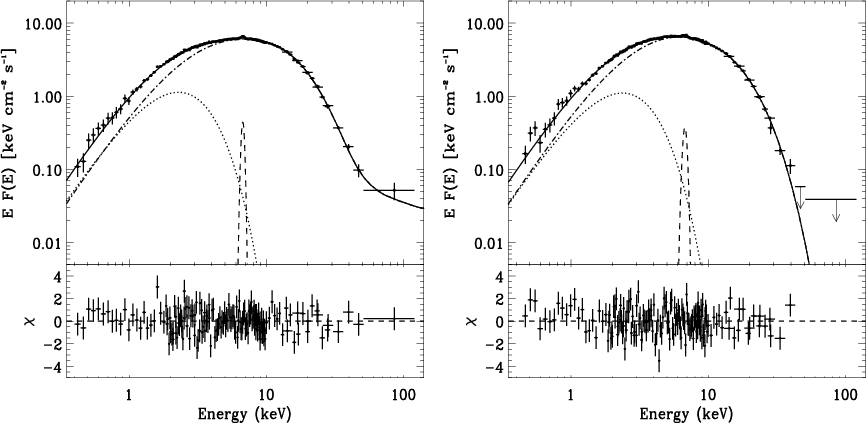
Figure 3:
Count-rate spectra of the first observation
( left panel) and of the second observation
( right panel) of GX 17+2 and best-fit folded model
WABS( BB + COMPTT + Gaussian) with
 .
In the first observation, an absorption edge was also included.
Below each panel are shown the residuals to the model in units of .
The last two PDS points of the second observation have .
In the first observation, an absorption edge was also included.
Below each panel are shown the residuals to the model in units of .
The last two PDS points of the second observation have
 ,
so they were not included in the fit and are reported as 2
upper
limits.
Similar results are obtained for the same model but with ,
so they were not included in the fit and are reported as 2
upper
limits.
Similar results are obtained for the same model but with
 . . |
| Open with DEXTER |
We also investigated the source erratic time variability in the 1.8-10 keV energy
band (MECS data), by deriving the power spectral density (PSD) in the
 Hz frequency range, obtained by averaging data
intervals of 131 072 points with a binning time of 10-2 s,
for the first and second observation respectively.
Unfortunately, because of the low collecting area of the telescopes, the statistical quality
of the derived PSD did not allow us to resolve the broad-band noise components typical
of Z sources or to detect QPOs observed with other satellites (EXOSAT, Hasinger & van der Klis 1990; RXTE, Homan et al. 2002).
We thus only derived the integrated root mean square
fractional variation of the 1.8-10 keV flux which is
Hz frequency range, obtained by averaging data
intervals of 131 072 points with a binning time of 10-2 s,
for the first and second observation respectively.
Unfortunately, because of the low collecting area of the telescopes, the statistical quality
of the derived PSD did not allow us to resolve the broad-band noise components typical
of Z sources or to detect QPOs observed with other satellites (EXOSAT, Hasinger & van der Klis 1990; RXTE, Homan et al. 2002).
We thus only derived the integrated root mean square
fractional variation of the 1.8-10 keV flux which is
 in the first observation and
 in the second one.
Table 2:
Best-fit parameters of the multi-component model WABS( BB + COMPTT + Gaussian + K-edge + PL) for the first and second observation of GX 17+2. The two solutions of the model are reported.
The F-test gives the probability of chance improvement of the
for the addition of the PL. The ratios
 and
and
 are computed in the 0.4-200 keV energy range.
3.2 Spectral properties
Following the results obtained on GX 17+2 by DS2000, we first attempted
to fit the source spectra with the BB + COMPTT continuum model plus a fluorescence
Fe line and an absorption Fe K-edge. The best-fit results are shown in
Fig. 3, where the time-averaged count-rate spectra of the
observations 1 and 2 are shown along with the residuals to
this model.
As can be seen, for the second observation (see Fig. 3, right panel) the model
describes quite well the data, with no apparent systematic residuals,
even though the
is not satisfactory
(
 ). This could be due to some spectral
evolution of the source with time (see Sect. 3.3.2). In addition, no significant K-edge is required by the data (see Table 2).
Unlike the second observation, the above model does not provide a good
description of the data of the first observation, with a
). This could be due to some spectral
evolution of the source with time (see Sect. 3.3.2). In addition, no significant K-edge is required by the data (see Table 2).
Unlike the second observation, the above model does not provide a good
description of the data of the first observation, with a
 ,
mainly due to the residuals to the best-fit model above 30 keV (see Fig. 3, left panel). It is sufficient to add, as
also done by DS2000, a PL component to the above spectral model to get a
very good fit (
,
mainly due to the residuals to the best-fit model above 30 keV (see Fig. 3, left panel). It is sufficient to add, as
also done by DS2000, a PL component to the above spectral model to get a
very good fit (
 ). The best-fit results are
shown in Table 2. A feature of the data obtained from both observations
when they are fit with the above model (with or without the PL) is that two
equally acceptable solutions for the values of the BB temperature
). The best-fit results are
shown in Table 2. A feature of the data obtained from both observations
when they are fit with the above model (with or without the PL) is that two
equally acceptable solutions for the values of the BB temperature
 and temperature of the seed photons
 are found (see Table 2): one with
and the other with
,
while the other parameter values remain substantially unchanged within errors.
are found (see Table 2): one with
and the other with
,
while the other parameter values remain substantially unchanged within errors.
Finally, to test the physical hypothesis of the three-layered atmospheric
structure in accretion disks suggested by Zhang et al. (2000)
for the black hole candidates (BHC) GRO J1655-40 and GRS 1915+105,
in the first observation we replaced the PL component with a
further COMPTT model with higher electron temperature, which we label
as
 .
Approximating the seed photons temperature of this hotter electrons to the
temperature of the electrons of the underlying warm layer
(an assumption justified by the fact that the Compton parameter y of the warm electrons is 3, so that their emerging spectrum
is not far from a Wien-like), namely keeping
.
Approximating the seed photons temperature of this hotter electrons to the
temperature of the electrons of the underlying warm layer
(an assumption justified by the fact that the Compton parameter y of the warm electrons is 3, so that their emerging spectrum
is not far from a Wien-like), namely keeping
 ,
does not give any stable solution.
A good fit is obtained by keeping free all the model parameters
(/
,
does not give any stable solution.
A good fit is obtained by keeping free all the model parameters
(/
 /140), but in this case, unlike the results
by Zhang et al. (2000), the seed photons temperature of the hotter
COMPTT component (
/140), but in this case, unlike the results
by Zhang et al. (2000), the seed photons temperature of the hotter
COMPTT component (
 keV, with a
corresponding
keV, with a
corresponding
 keV and
 )
is quite different from the temperature (8 keV)
of the warm electrons.
)
is quite different from the temperature (8 keV)
of the warm electrons.
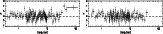 |
Figure 4:
Residuals in units of
to the model WABS( BB + EQPAIR + Gaussian), assuming purely thermal Comptonization, for the first ( left panel) and for second ( right panel) observation of GX 17+2. |
| Open with DEXTER |
3.3 A physical model for the hard X-ray tail
In order to investigate the physical origin of the hard X-ray tail
detected during the first observation of GX 17+2, we used the Comptonization model
worked out by Coppi (1999, EQPAIR in XSPEC), which has the advantage of being
general and can be used to fit the source spectra of both observations.
In this model, non-thermal electrons with energy spectrum
 (where
  is the Lorentz factor) are injected in
the plasma cloud at a rate
.
These electrons lose energy because of Compton, Coulomb and
bremsstrahlung processes and thus establish a steady-state distribution.
At high energies (for
is the Lorentz factor) are injected in
the plasma cloud at a rate
.
These electrons lose energy because of Compton, Coulomb and
bremsstrahlung processes and thus establish a steady-state distribution.
At high energies (for
 up to a certain value
of
up to a certain value
of
 )
the distribution is non-thermal (power-law like), but
at low energies it joins the Maxwellian distribution and
the final result of this process is a hybrid thermal plus non-thermal
plasma.
The temperature of the thermal distribution,
)
the distribution is non-thermal (power-law like), but
at low energies it joins the Maxwellian distribution and
the final result of this process is a hybrid thermal plus non-thermal
plasma.
The temperature of the thermal distribution,
 ,
is self-consistently computed by means
of energy balance and is not a free parameter of the model.
The plasma properties are characterized by the powers L supplied
to the different components.
A compactness parameter is introduced and defined as:
,
is self-consistently computed by means
of energy balance and is not a free parameter of the model.
The plasma properties are characterized by the powers L supplied
to the different components.
A compactness parameter is introduced and defined as:

where R is the characteristic size of the region and
 is the Thomson
cross-section for scattering.
The compactness of the input soft photons is parametrized
by
is the Thomson
cross-section for scattering.
The compactness of the input soft photons is parametrized
by
 .
The power supplied to the Comptonizing electrons is parametrized as
.
The power supplied to the Comptonizing electrons is parametrized as
 =
=
 +
+
 ,
where
is the power supplied to heat
thermal particles, while
is the power going into accelerating
non-thermal particles. If
= 0, then one has a purely
thermal (Maxwellian) distribution. EQPAIR can also test the presence of Compton
reflection of the primary photon spectrum from a neutral or a ionized medium
(Magdziarz & Zdziarski 1995), allowing for different metal abundances
with respect to the solar ones.
,
where
is the power supplied to heat
thermal particles, while
is the power going into accelerating
non-thermal particles. If
= 0, then one has a purely
thermal (Maxwellian) distribution. EQPAIR can also test the presence of Compton
reflection of the primary photon spectrum from a neutral or a ionized medium
(Magdziarz & Zdziarski 1995), allowing for different metal abundances
with respect to the solar ones.
Table 3:
Best-fit parameters of the multi-component model WABS( BB + EQPAIR + Gaussian) for the first and second observation of GX 17+2.
The F-test gives the probability of chance improvement of the
switching from thermal to hybrid Comptonization. The compactness parameters
,
and
are defined in Sect. 3.3. The ratio
is computed in the energy range 0.4-200 keV.
 |
Figure 5:
Unabsorbed EF(E) spectrum of the first ( left panel) and of the second ( right panel)
observation of GX 17+2 along with the best-fit model WABS( BB + EQPAIR + Gaussian).
A hybrid spectrum of the Comptonizing electrons is assumed. The 2
upper limit
of the last two PDS points of the second observation is also reported.
Below each panel, the residuals between the data and the model
in units of
are shown.
Different line styles represent the single components. Dotted: BB.
Dotted-dashed: EQPAIR. Dashed: Gaussian emission line. |
| Open with DEXTER |
We first assumed that all the power goes in heating the thermal particles
(
/
= 0, purely thermal Comptonization) with
a simple BB spectrum of the seed photons.
We added to EQPAIR also a direct BB component plus a Fe K fluorescence line in
the source model, as discussed in Sect. 3.2.
This model well describes the data below 30 keV but, as in the case
of COMPTT, a systematic excess is again observed in the residuals
above this threshold (see Fig. 4, left panel).
We thus left free to vary the
parameter: since the statistics of the data do not allow us to simultaneously constrain
 ,
and p in the fits,
was frozen at value of 12 (the
is poorly sensitive to
in the range from 2 to 50). The chosen value of
takes into account the energy range in which the excess over thermal Comptonization is located and the temperature of the seed photons found from the fit.
As can be seen from Fig. 5 (left panel), the agreement between
the model and the data is excellent.
The probability given by the F-test that the
reduction obtained from the inclusion of a non-thermal component in the Comptonizing cloud is due to chance is very low
(see Table 3).
The presence of a Compton reflection component, assuming solar abundances and a low inclination angle
,
and p in the fits,
was frozen at value of 12 (the
is poorly sensitive to
in the range from 2 to 50). The chosen value of
takes into account the energy range in which the excess over thermal Comptonization is located and the temperature of the seed photons found from the fit.
As can be seen from Fig. 5 (left panel), the agreement between
the model and the data is excellent.
The probability given by the F-test that the
reduction obtained from the inclusion of a non-thermal component in the Comptonizing cloud is due to chance is very low
(see Table 3).
The presence of a Compton reflection component, assuming solar abundances and a low inclination angle
 (GX 17+2 is a Sco-like source, Kuulkers & van der Klis 1996),
is only marginally detected (
(GX 17+2 is a Sco-like source, Kuulkers & van der Klis 1996),
is only marginally detected ( 7, probability of chance improvement of 3%) with
best-fit value of the covering factor
7, probability of chance improvement of 3%) with
best-fit value of the covering factor
 .
The ionization parameter value we find is
.
The ionization parameter value we find is
 erg cm s-1.
An important issue to point out is that, unlike COMPTT, with EQPAIR there is not
a double solution as concerns the direct BB and seed photons
temperature values.
erg cm s-1.
An important issue to point out is that, unlike COMPTT, with EQPAIR there is not
a double solution as concerns the direct BB and seed photons
temperature values.
Replacing the direct BB component with a DBB, we still obtain
an acceptable, albeit a bit worse, result (/
 ).
If, on the other hand, we assume a DBB seed photon spectrum
in EQPAIR plus a direct BB model, the fit is even worse (/
).
If, on the other hand, we assume a DBB seed photon spectrum
in EQPAIR plus a direct BB model, the fit is even worse (/
 ).
).
3.3.2 Second observation
As reported in Sect. 3.2, during the second observation
there was slight evidence of a spectral evolution of the source,
suggested by the somewhat worse fit of the COMPTT model to the data,
in spite of the fact that no systematic
residuals to the best-fit model are apparent
(see Fig. 3, right panel).
This result is confirmed also by using the EQPAIR model, assuming
purely thermal Comptonization, to fit the
whole observation (/
 ,
see Fig. 4, right panel).
In this case we also find that the soft compactness
is unconstrained so, during the fit,
we fixed it at the best-fit value of the first observation.
In order to put an upper limit on the power supplied in accelerating
non-thermal electrons, we allowed the
/
parameter to
vary, by keeping
and p frozen at the best-fit values
of the first observation. The results are reported in Table 3.
As it can be seen, the power going in accelerating non-thermal electrons is
consistent with zero and its 2
upper limit is lower than the value
of the first observation. It is worth pointing out that this
upper limit value on
/
is obtained even including in the fit the last two PDS points
(see Fig. 3, right panel), in order to have the same energy coverage of the first observation.
The 2
upper limit on the 40-120 keV source flux, assuming as best-fit model
the one reported in Table 3, is
,
see Fig. 4, right panel).
In this case we also find that the soft compactness
is unconstrained so, during the fit,
we fixed it at the best-fit value of the first observation.
In order to put an upper limit on the power supplied in accelerating
non-thermal electrons, we allowed the
/
parameter to
vary, by keeping
and p frozen at the best-fit values
of the first observation. The results are reported in Table 3.
As it can be seen, the power going in accelerating non-thermal electrons is
consistent with zero and its 2
upper limit is lower than the value
of the first observation. It is worth pointing out that this
upper limit value on
/
is obtained even including in the fit the last two PDS points
(see Fig. 3, right panel), in order to have the same energy coverage of the first observation.
The 2
upper limit on the 40-120 keV source flux, assuming as best-fit model
the one reported in Table 3, is
 erg cm-2 s-1(see Fig. 5, right panel) a value below that found in the first observation
(
erg cm-2 s-1(see Fig. 5, right panel) a value below that found in the first observation
(
 erg cm-2 s-1).
We subsequently performed spectral analysis separately for the three regions of the HID
labeled in Fig. 2; the results are reported in Table 4.
erg cm-2 s-1).
We subsequently performed spectral analysis separately for the three regions of the HID
labeled in Fig. 2; the results are reported in Table 4.
Table 4:
Same as in Table 3 but for regions II, III and IV of the second observation as reported in Fig. 2 and assuming thermal Comptonization.
4 Discussion
Some relevant results have been derived from our observations of GX 17+2
with BeppoSAX.
The persistent continuum X-ray emission of
GX 17+2 can be described by several
two-component models. When we adopt the COMPTT model
plus a BB, we find that two solutions are possible, which are
reminiscent of the well known Eastern
(Mitsuda et al. 1984, 1989)
and Western (White et al. 1986, 1988) models.
Indeed, looking at the results of Table 2, for solution 1, we can interpret the 0.6 keV BB as the direct emission from the accretion disk, with Comptonization mainly occurring
in the hotter boundary layer (
 keV, Eastern Model scenario).
But the same spectrum can be described (solution 2) by a 1.5 keV BB plus a Comptonization region of cooler photons (
keV, Eastern Model scenario).
But the same spectrum can be described (solution 2) by a 1.5 keV BB plus a Comptonization region of cooler photons (
 keV). In this case
the direct BB emission can be interpreted as coming from the boundary layer,
while Comptonization takes place in the disk (Western model scenario).
From a statistical point of view, we do not find strong reasons for favouring
one solution over the other; however, the former solution is the only one
we find when COMPTT is replaced by EQPAIR.
keV). In this case
the direct BB emission can be interpreted as coming from the boundary layer,
while Comptonization takes place in the disk (Western model scenario).
From a statistical point of view, we do not find strong reasons for favouring
one solution over the other; however, the former solution is the only one
we find when COMPTT is replaced by EQPAIR.
The soft compactness estimated by EQPAIR (see Table 3) is
much higher than that reported in the case of BHCs (e.g., Frontera et al. 2001;
Gierlinski & Done 2003); this is however not surprising given that in neutron star systems,
unlike BHCs, the source environment in the inner disk region
has an additional source of soft luminosity coming from the neutron star.
Apart from this crucial difference, related to the nature of the compact
object, there are some physical characteristics which link in some
way GX 17+2 to BHCs.
First, the spectral index of the non-thermal injected electrons (
)
is consistent, within
errors, with that found, e.g., in Cyg X-1
(Gierlinski et al. 1999; Frontera et al. 2001)
and GRS 1915+105 (Zdziarski et al. 2001).
Moreover, the spectral shape of the source in the EF(E) diagram
(see Fig. 5) strongly resembles
that of BHCs in the so-called ultrasoft state, when
 (e.g., GX 339-4, GRS 1915+105, XTE J1550-564,
see the review by Zdziarski & Gierlinski 2004), where the peak of the energy
emission occurs below 10 keV.
The similarity with GRS 1915+105, in particular, results even more
intriguing looking at the X-ray spectral parameters found
by Zdziarski et al. (2001) by fitting the source RXTE/OSSE 3-600 keV
X-ray spectrum with EQPAIR: the authors indeed found
(e.g., GX 339-4, GRS 1915+105, XTE J1550-564,
see the review by Zdziarski & Gierlinski 2004), where the peak of the energy
emission occurs below 10 keV.
The similarity with GRS 1915+105, in particular, results even more
intriguing looking at the X-ray spectral parameters found
by Zdziarski et al. (2001) by fitting the source RXTE/OSSE 3-600 keV
X-ray spectrum with EQPAIR: the authors indeed found
 keV,
keV,
 ,
,
 keV and
/
0.1. Only the ratio
/
was lower
(0.3) than that found in GX 17+2 by us.
As Z sources stably accrete at near-Eddington rate, these similarities
lead to suggest that Comptonization/acceleration
processes in X-ray binary systems in this phase do not strongly depend on
the presence or not of a solid surface at the inner boundary
of the accretion disk.
keV and
/
0.1. Only the ratio
/
was lower
(0.3) than that found in GX 17+2 by us.
As Z sources stably accrete at near-Eddington rate, these similarities
lead to suggest that Comptonization/acceleration
processes in X-ray binary systems in this phase do not strongly depend on
the presence or not of a solid surface at the inner boundary
of the accretion disk.
An important result of our study concerns the transient high-energy X-ray
tail. We confirm its presence when the source is in the upper left HB
of the Z diagram, as already observed by DS2000.
But, unlike DS2000, who found that the hard X-ray excess
gradually decreased as the source moved towards right in the HB,
completely disappearing when the source achieved the NB,
we find that this disappearance occurs when the source is still
in the HB, in particular during its transition
from region I to region II of the HID (Fig. 2).
The hard X-ray excess is described by a PL with
the same photon index found by DS2000
(
,
see Table 2).
In order to gain some insight on the physical origin of the
hard X-ray component, we replaced the COMPTT model with the
Comptonization model EQPAIR of Coppi (1999).
In this model, in addition to a thermal population of electrons,
a non-thermal electron tail can be included.
Assuming a purely Maxwellian distribution of the electron energies, the hard
X-ray excess is still apparent above the BB plus EQPAIR model
(see Fig. 4).
Only assuming a thermal plus non-thermal plasma the EQPAIR model gives
a good description of the high-energy excess.
To our knowledge, this is the first time that the transient hard X-ray tail of
a Z source (see Sect. 1) is described in
terms of hybrid Comptonization.
An important question is whether the two electron populations (thermal and
non-thermal) are physically connected. Unfortunately the present data do not
allow to answer this question. We consider two cases separately.
If the two electron populations are not physically related, a likely origin
of the non-thermal electrons is a relativistic jet escaping the system.
In recent years, relativistic jets have revealed to be a quite common property of LMXBs, providing a link between these systems and AGNs (for a review see, e.g., Fender 2002).
In this thermal plus non-thermal scenario, the Comptonized spectrum
is produced by a thermal corona (likely located above the inner disk close
to the boundary layer) plus a relativistic non-thermal electron jet,
with the soft seed photons mainly coming from the inner disk.
The energy of the seed photons (1 keV, see Table 3)
is indeed consistent with the value expected for the inner disk temperature
of LMXBs hosting a neutron star (see, e.g., the review by Barret 2001).
Thus we could tentatively identify the decrease of the power
supplied to non-thermal electrons (
/
drops from 0.1
to less than 0.04 from the first to the second observation),
as a switching-off of the mechanism producing the jet.
On the other hand, if the two electron populations are physically related, a possible
origin of the non-thermal component is in processes of magnetohydrodynamic
turbulence occurring in the corona (e.g., magnetic reconnection), in analogy
with what observed in the solar corona (Crosby et al. 1998;
see also the review by Coppi 1999). In this case particle acceleration cannot be 100% efficient
in the production of non-thermal high-energy particles
(e.g., Zdziarski et al. 1993).
This can occur only above a certain momentum
threshold when the acceleration time scale for a particle becomes significantly
shorter than its corresponding thermalization (or energy-exchange) time scale.
Below this threshold particles are tightly coupled and their acceleration
goes mainly in a bulk heating of the thermal plasma component.
We have also explored the physical scenario proposed by Zhang et al. (2000) for GRO J1655-40 and
GRS 1915+105, in which a much hotter, optically thin thermal corona is located
above a warm layer with lower temperature and high opacity.
This scenario seems not suitable for GX 17+2. In fact, in this hypothesis, one would
expect that the seed photons of the hotter layer are those coming from
the underlying one, and thus should have a temperature similar
to that of the colder electrons (
 keV).
This is indeed what Zhang et al. (2000) found with ASCA/RXTE data
in the case of GRO J1655-40 and GRS 1915+105.
However, in our case
keV).
This is indeed what Zhang et al. (2000) found with ASCA/RXTE data
in the case of GRO J1655-40 and GRS 1915+105.
However, in our case
 significantly differs from
 (1.3 keV
and 8 keV, respectively), thus ruling out the
three-layered accretion hypothesis.
(1.3 keV
and 8 keV, respectively), thus ruling out the
three-layered accretion hypothesis.
In addition to the origin of the hard X-ray emission, its correlation
with the position of Z sources in the CD/HID is still
unclear.
As discussed in Sect. 1, the results obtained
from GX 17+2, Cyg X-2 and GX 5-1 (but not, however, from Sco X-1), could suggest the possibility of an anti-correlation between presence of hard X-ray emission and accretion rate
in Z sources, in a similar fashion to what observed both in atoll sources and BHCs, where the hard spectra are
usually observed during the low inferred
states (e.g., Barret & Olive 2002; McClintock & Remillard 2004).
Our results on GX 17+2 do not contrast with this possibility but,
when compared with those found by DS2000, they point to the presence
of a threshold, that we thus tentatively identify with a threshold in ,
above which the hard tail disappears.
A definite answer to this suggestion could come from very sensitive monitoring of the source at
high energies in region I of Fig. 2 during the second observation, but this was not possible because of the too few points falling in that region.
An important issue is what we mean by :
it appears evident that this
is not the one that drives the X-ray luminosity, since the latter does not change along the track (see Tables 3 and 4).
Thus, if some
increases along the Z-track, it is not correlated with the X-ray luminosity: an intriguing way out to this problem was proposed by van der Klis (2001) to explain the "parallel tracks'' phenomenon. He suggested that what does change along the track is not the prompt disk accretion rate
 but rather the ratio
 ,
where
,
where
 is the long-term
average.
The luminosity is supposed to be related to the sum of
plus
(
is the long-term
average.
The luminosity is supposed to be related to the sum of
plus
(
 )
while the curve length S across the track is a measure of
)
while the curve length S across the track is a measure of  .
The threshold above which we see the disappearance of the hard tail could thus be a threshold in
.
The threshold above which we see the disappearance of the hard tail could thus be a threshold in
 .
It is quite difficult to establish whether this hypothesis is correct.
In the positive, one has to explain what produces the hard tail: the physical process should be strongly dependent on what happens in the disk.
When the hard X-ray component is no longer detected (regions II, III and IV of the HID), we observe a slight decrease of the temperature of the scattering cloud,
as the source moves from the left to the right in the HB.
In the van der Klis (2001) model, this is related to the
variation of :
a higher prompt disk accretion rate is expected to push
the inner radius towards the neutron star with a consequent larger production of seed and hotter photons for the corona, which is thus more efficiently Compton-cooled
(
decreases from regions II to IV, see Table 4).
We confirm the presence of the Fe K emission line at 6.7 keV,
while the edge detection (first reported by DS2000) is not
so evident and should be treated carefully.
Indeed we find that the EQPAIR model well fits the
data (see Table 3) and neither Compton-reflection
nor absorption edge are required, showing that the presence
of such components in the spectra are
very sensitive to the continuum model adopted.
One should be careful in claiming the presence of these components
in the case of GX 17+2.
.
It is quite difficult to establish whether this hypothesis is correct.
In the positive, one has to explain what produces the hard tail: the physical process should be strongly dependent on what happens in the disk.
When the hard X-ray component is no longer detected (regions II, III and IV of the HID), we observe a slight decrease of the temperature of the scattering cloud,
as the source moves from the left to the right in the HB.
In the van der Klis (2001) model, this is related to the
variation of :
a higher prompt disk accretion rate is expected to push
the inner radius towards the neutron star with a consequent larger production of seed and hotter photons for the corona, which is thus more efficiently Compton-cooled
(
decreases from regions II to IV, see Table 4).
We confirm the presence of the Fe K emission line at 6.7 keV,
while the edge detection (first reported by DS2000) is not
so evident and should be treated carefully.
Indeed we find that the EQPAIR model well fits the
data (see Table 3) and neither Compton-reflection
nor absorption edge are required, showing that the presence
of such components in the spectra are
very sensitive to the continuum model adopted.
One should be careful in claiming the presence of these components
in the case of GX 17+2.
5 Conclusions
We have investigated two BeppoSAX observations of the Z source GX 17+2
performed on 1997 April 3 and 21.
The persistent continuum X-ray emission can be described by two-component
models, which support the well known accretion scenarios suggested by the Western and
Eastern model.
However, in the first observation, when the source was in the upper left HB of
the HID diagram, we observed a hard X-ray tail (up to 120 keV),
which disappeared in the second observation performed two weeks later, when the source moved to the
right in the HB. Our results confirm those obtained
by DS2000, but provide a stronger evidence for the presence of a threshold in the
accretion rate
in the HB, above which the intensity of the
hard tail is below the instrument sensitivity or disappears.
Given that the X-ray luminosity is not correlated with the position of
the source in the HID,
is not the one we ascribe to X-ray luminosity
but has a somewhat different meaning. We propose as working hypothesis
the model by van der Klis (2001), in which the X-ray luminosity is
proportional to the prompt disk accretion rate plus its own long-term
average, while motion along the Z track depends on the ratio of these
two quantities.
To testify whether this hypothesis is correct, more observational
and theoretical work is required.
The hard X-ray excess observed in the first observation can be described
by Comptonization of soft seed photons (
keV)
off non-thermal electrons injected with spectral index
.
In addition, a thermal component described by a BB with
keV
is observed. An emission line at 6.7 keV is found in both observations.
The origin of the non-thermal electrons cannot be established
on the basis of the BeppoSAX data alone.
We have two equally acceptable
options: electrons from jets or electrons produced in magnetohydrodynamic turbulence
processes occurring in the corona. Only the determination of the source
spectrum at higher energies (200 keV) can provide more constraints on
the origin of the high-energy excess. A step forward could be done
by INTEGRAL through a long monitoring observation
of the source.
Also high-energy resolution observations below 10 keV, performed
with Chandra or XMM-Newton, could be very helpful
in clarifying the origin of the Fe emission line and to
determine unambiguously the presence/absence of
an absorption edge.
On the other hand, simultaneous X-ray/radio observations
would test the possibility of a
correlation between hard X-ray and radio emission in this source, with
presence or not of relativistic expanding lobes.
Acknowledgements
This research is supported by the Italian Space Agency (ASI) and
Ministry of University and Scientific Research of Italy (PRIN N. 2002027145).
A.A.Z. has been supported by KBN grants PBZ-KBN-054/P03/2001 and 1P03D01827.
- Anders, E.,
& Ebihara, M. 1989, Geochim. Cosmochim. Acta, 46, 2363 [NASA ADS]
- Asai, K., Dotani,
T., Mitsuda, K., et al. 1994, PASJ, 46, 479 [NASA ADS] (In the text)
-
Augusteijn, T., Karatasos, K., Papadakis, M., et al. 1992, A&A,
265, 177 [NASA ADS] (In the text)
- Barret, D.
2001, Adv. Space Res., 28, 307 [NASA ADS] [CrossRef] (In the text)
- Barret, D.,
& Olive, J. 2002, AJ, 576, 391 [NASA ADS] [CrossRef] (In the text)
- Boella, G.,
Butler, R. C., Perola, G. C., et al. 1997a, A&AS, 122, 299 [NASA ADS] (In the text)
- Boella, G.,
Chiappetti, L., Conti, G., et al. 1997b, A&AS, 122, 327 [NASA ADS] (In the text)
-
Chiappetti, L., & Dal Fiume, D. 1997, in Proceedings of the
Fifth International Workshop on Data Analysis in Astronomy System,
ed. V. di Gesù, M. J. B. Duff, A. Heck, M. C. Maccarone, L.
Scarsi, & H. U. Zimmerman (World Scientific Press), 101
(In the text)
- Coppi, P. S.
1999, in High Energy Processes in Accreting Black Holes, ed. J.
Poutanen, & R. Svensson, ASP Conf. Ser., 161, 375
(In the text)
- Crosby, N.,
Vilmer, N., Lund, N., & Sunyaev, R. 1998, A&A, 334,
299 [NASA ADS] (In the text)
- D'Amico, F.,
Heindl, W. A., Rothschild, R. E., & Gruber, D. E. 2001, ApJ,
547, L147 [NASA ADS] [CrossRef] (In the text)
- Di Salvo, T.,
Stella, L., Robba, N. R., et al. 2000, ApJ, 544, L119 [NASA ADS] [CrossRef] (DS2000)
(In the text)
- Di Salvo, T.,
Robba, N. R., Iaria, R., et al. 2001, ApJ, 554, 49 [NASA ADS] [CrossRef] (In the text)
- Di Salvo, T.,
Farinelli, R., Burderi, L., et al. 2002, A&A, 386, 535 [EDP Sciences] [NASA ADS] [CrossRef] (In the text)
- Di Salvo, T.,
& Stella, L. 2002 [arXiv:astro-ph/0207219]
- Fender, R.
2002, in Relativistic outflows in Astrophysics, ed. A. W. Guthmann,
M. Georganopoulos, A. Marcowith, & K. Manolakou, Lecture Notes
in Physics, 589, 101 [arXiv:astro-ph/0109502]
(In the text)
- Fiore, F.,
Guainazzi, M., & Grandi, P. 1999, Technical Report 1.2,
BeppoSAX scientific data center, available online at
ftp://ftp.asdc.asi.it/pub/sax/doc/software_docs/saxabc_v1.2.ps
(In the text)
- Friedman,
H., Byram, E. T., & Chubb, T. A. 1967, Science, 156, 374 [NASA ADS] (In the text)
- Frontera,
F., Costa, E., Dal Fiume, D., et al. 1997, A&AS, 122, 357 [NASA ADS] (In the text)
- Frontera,
F., Dal Fiume, D., Malaguti, G., et al. 1998, The Active X-ray Sky,
ed. L. Scarsi, H. Bradt, P. Giommi, & F. Fiore, Nuclear
Physics, Proc. Suppl. 69/1-3, 286
(In the text)
- Frontera,
F., Palazzi, E., Zdziarski, A. A., et al. 2001, ApJ, 546, 1027 [NASA ADS] [CrossRef] (In the text)
- Gierlinski, M., Zdziarski,
A. A., Poutanen, J., et al. 1999, MNRAS, 309, 496 [NASA ADS] [CrossRef]
- Gierlinski, M., &
Done, C. 2003, MNRAS, 342, 1083 [NASA ADS] [CrossRef]
- Hasinger,
G., van der Klis, M., Ebisawa, K., Dotani, T., & Mitsuda, K.
1990, A&A, 235, 131 [NASA ADS] (In the text)
- Hertz, P.,
Vaughan, B., Wood, K. S., et al. 1992, ApJ, 396, 201 [NASA ADS] [CrossRef] (In the text)
- Homan, J., van
der Klis, M., Jonker, P. G., et al. 2002, ApJ, 568, 878 [NASA ADS] [CrossRef] (In the text)
- Hoshi, R., &
Asaoka, I. 1993, PASJ, 45, 567 [NASA ADS] (In the text)
- Iaria, R.,
Burderi, L., Di Salvo, T., La Barbera, A., & Robba, N. R. 2001,
ApJ, 547, 412 [NASA ADS] [CrossRef] (In the text)
- Kahn, S. M., &
Grindlay, J. E. 1984, ApJ, 281, 826 [NASA ADS] [CrossRef] (In the text)
- Kuulkers,
E., & van der Klis, M. 1996, A&A, 314, 567 [NASA ADS] (In the text)
-
Magdziarz, P., & Zdziarski, A. A. 1995, MNRAS, 273, 837 [NASA ADS] (In the text)
- Manzo, G.,
Giarrusso, S., Santangelo, A., et al. 1997, A&AS, 122, 341 [NASA ADS] (In the text)
-
McClintock, J. E., & Remillard, R. A. 2004, in Compact Stellar
X-ray Sources, Chap. 4 , in press, ed. W. H. G. Lewin, & M. van
der Klis (Cambridge University Press)
[arXiv:astro-ph/0306213]
(In the text)
- Mitsuda, K.,
Inoue, H., Koyama, K., et al. 1984, PASJ, 36, 741 [NASA ADS] (In the text)
- Mitsuda, K.,
Inoue, H., Nakamura, N., & Tanaka, Y. 1989, PASJ, 41, 97 [NASA ADS] (In the text)
- Parmar, A. N.,
Martin, D. D. E., Bavdaz, M., et al. 1997, A&AS, 122, 309 [NASA ADS] (In the text)
- Penninx, W.,
Lewin, W. H. G., Zijlstra, A. A., Mitsuda, K., & van Paradijs,
J. 1988, Nature, 336, 146 [NASA ADS] [CrossRef] (In the text)
- Piraino, S.,
Santanelo, A., & Kaaret, P. 2002, ApJ, 567, 1091 [NASA ADS] [CrossRef] (In the text)
- Sunyaev, R.
A., & Titarchuk, L. 1980, A&A, 86, 121 [NASA ADS] (In the text)
- Sztajno, M.,
van Paradijs, J., & Lewin, W. H. G. 1986, MNRAS, 222, 499 [NASA ADS] (In the text)
- Tawara, Y.,
Tatsumi, H., & Tsuneo, K. 1984, PASJ, 36, 861 [NASA ADS] (In the text)
-
Titarchuk, L. G. 1994, ApJ, 434, 570 [NASA ADS] [CrossRef] (In the text)
- van der Klis, M.
2001, ApJ, 561, 943 [NASA ADS] [CrossRef] (In the text)
- van
Paradijs, J., Allington-Smith, J., Callanan, P., et al. 1990,
A&A, 235, 156 [NASA ADS]
- Vrtilek, S.
D., Raymond, J. C., Garcia, M. R., et al. 1990, A&A, 235,
162 [NASA ADS] (In the text)
- Vrtilek, S.
D., Penninx, W., Raymond, J. C., et al. 1991a, ApJ, 376, 278 [NASA ADS] [CrossRef] (In the text)
- Vrtilek, S.
D., McClintock, J. E., & Seward, F. D. 1991b, ApJS, 76,
1127 [NASA ADS] [CrossRef] (In the text)
- White, N. E.,
Mason, K. O., & Sanford, P. W. 1978, ApJ, 220, 600 [NASA ADS] [CrossRef] (In the text)
- White, N. E.,
Peacock, A., Hasinger, G., et al. 1986, MNRAS, 218, 129 [NASA ADS] (In the text)
- White, N. E.,
Stella, L., & Parmar, A. N. 1988, ApJ, 324, 363 [NASA ADS] [CrossRef] (In the text)
-
Zdziarski, A. A., Lightman, A. P., & Maciolek-Niedzwiecki,
A. 1993, ApJ, 414, L93 [NASA ADS] [CrossRef] (In the text)
-
Zdziarski, A. A., Grove, J. E., Poutanen, J., Rao, A. R., &
Vadawale, S. V. 2001, ApJ, 554, L45 [NASA ADS] [CrossRef] (In the text)
-
Zdziarski, A. A., & Gierlinski, M. 2004, Progr. Theor. Phys.
Suppl., 155, 99 [NASA ADS] (In the text)
Copyright ESO 2005
![\begin{figure}
\par\includegraphics[height=8.6cm,width=7.14cm,angle=-90,clip]{15...
...udegraphics[height=8.6cm,width=7.14cm,angle=-90,clip]{1567_fig2.ps}
\end{figure}](/articles/aa/full/2005/16/aa1567/img44.gif)