![\begin{figure}
\par\begin{tabular}{cc}
\par ORIGINAL & BASE LINE CORRECTED \\
&...
...width=7.9cm,height=5.7cm,clip]{1605fg1f.ps}\\
\par\end{tabular}\par\end{figure}](/articles/aa/full/2005/15/aa1605/Timg6.gif) |
Figure 1: Spectra of the W7116B particles studied before HF dissolution. The left column shows the original spectra with the corresponding baseline, the right column shows the same spectra after baseline subtraction. |
| Open with DEXTER | |
In the text
![\begin{figure}
\par\begin{tabular}{cc}
\par ORIGINAL & BASE LINE CORRECTED \\
&...
...idth=7.80cm,height=5.5cm,clip]{1605fg2h.ps}\\
\par\end{tabular}\par\end{figure}](/articles/aa/full/2005/15/aa1605/Timg7.gif) |
Figure 2: Spectra of the NASA particles studied before HF dissolution. The left column shows the original spectra with the corresponding baseline, the right column shows the same spectra after baseline subtraction. |
| Open with DEXTER | |
In the text
![\begin{figure}
\par\resizebox{8.8cm}{!}{\includegraphics[clip]{1605fig3.eps}}\par
\par\end{figure}](/articles/aa/full/2005/15/aa1605/Timg11.gif) |
Figure 3: The aliphatic peaks of the region 3000-2800 cm-1, for the seven IDPs before (dashed line) and after (solid line) HF treatment. Some spectra have been multiplicated by a factor (indicated in the right side) for intercomparison. |
| Open with DEXTER | |
In the text
![\begin{figure}
\par\begin{tabular}{cc}
\par ORIGINAL & BASE LINE CORRECTED \\
&...
...8.5cm,,height=5.8cm,clip]{1605fg4f.ps}\\
\par\end{tabular}\par
\par\end{figure}](/articles/aa/full/2005/15/aa1605/Timg38.gif) |
Figure 4: Spectra of the W7116B particles studied after HF dissolution. The left column shows the original spectra with the corresponding baseline, the right column shows the same spectra after baseline subtraction. Please note the difference in scale with respect to the spectra obtained before HF (Fig. 1). |
| Open with DEXTER | |
In the text
![\begin{figure}
\par\begin{tabular}{cc}
\par ORIGINAL & BASE LINE CORRECTED \\
\...
...width=7.8cm,height=5.5cm]{1605fg5h.ps}\\
\par\end{tabular}\par
\par\end{figure}](/articles/aa/full/2005/15/aa1605/Timg39.gif) |
Figure 5: Spectra of the NASA particles studied after HF dissolution. The left column shows the original spectra with the corresponding baseline, the right column shows the same spectra after baseline subtraction Please note the difference in scale with respect to the spectra obtained before HF (Fig. 2). |
| Open with DEXTER | |
In the text
 |
Figure 6: Spectra of the standards 2-hexadodecanone, stearic, succinic and adipic acids before (solid line) and after (dashed line) HF treatment. |
| Open with DEXTER | |
In the text
 |
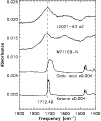
Figure 7: Spectral region near 1700 cm-1 for the standards 2-hexadodecanone and stearic acid and their comparison with W7116B-N and L2021-K3 post HF particles. |
| Open with DEXTER | |
In the text
![\begin{figure}
\par\resizebox{8.5cm}{!}{\includegraphics[clip]{1605fig8.ps}}
\par\end{figure}](/articles/aa/full/2005/15/aa1605/Timg91.gif) |
Figure 8: Spectra of the materials used as blanks during this work: hexane; KRS-5; olivine; silicone oil; W7116-200; W7116B-K. For the latter two only the spectra after HF dissolution are shown. |
| Open with DEXTER | |
In the text
![\begin{figure}
\par\resizebox{8.8cm}{!}{\includegraphics[clip]{1605fig9.ps}}
\par\end{figure}](/articles/aa/full/2005/15/aa1605/Timg94.gif) |
Figure 9: Comparison of the spectrum of the particles W7116B-Y (hydrated) before HF, L2021-K2 (cluster, hydrated) after HF and W7116B-U (anhydrous) after HF to the IRS 7 source (Galactic Center). Only the 2800-3100 cm-1 region is shown. The Galactic Center source spectrum has been obtained from the Infrared Space Observatory (ISO) Data Center. |
| Open with DEXTER | |
In the text