A&A 433, 827-840 (2005)
DOI: 10.1051/0004-6361:20034425
J.-P. Macquart
Kapteyn Astronomical Institute, University of Groningen, The Netherlands
Received 1 October 2003 / Accepted 7 December 2004
Abstract
Spectral features absorbed against some radio quasars exhibit ![]() 50 mJy variations, with the lines varying both relative to the continuum and, when several lines are present, even relative to one another. We point out that such variability can be expected as a consequence of refractive scintillation caused by the interstellar medium of our Galaxy. Scintillation can cause independent variations between closely-spaced spectral lines, and can even alter the line profile. The background source need not be compact to exhibit spectral variability. The variability can be used to infer the parsec to sub-parsec scale structure of the intervening absorbing material. We discuss the importance of scintillation relative to other possible origins of spectral variability. The present theory is applied to account for the variations observed in the HI-absorbed quasar PKS 1127-145.
50 mJy variations, with the lines varying both relative to the continuum and, when several lines are present, even relative to one another. We point out that such variability can be expected as a consequence of refractive scintillation caused by the interstellar medium of our Galaxy. Scintillation can cause independent variations between closely-spaced spectral lines, and can even alter the line profile. The background source need not be compact to exhibit spectral variability. The variability can be used to infer the parsec to sub-parsec scale structure of the intervening absorbing material. We discuss the importance of scintillation relative to other possible origins of spectral variability. The present theory is applied to account for the variations observed in the HI-absorbed quasar PKS 1127-145.
Key words: radio lines: galaxies - Galaxy: structure - scattering - techniques: high angular resolution
The variations could be due to inhomogeneities in the absorbing source coupled with changes in the line of sight to the background quasar or effects due to interstellar scintillation. Spectral variability due to changes in the line of sight occurs if the background source moves at high angular speed with respect to the absorbing system. The time scale of spectral variations is determined by the angular speed of the background source relative to the angular scale of fluctuations in the intervening absorbing system.
The interpretation of the variability in terms of interstellar scintillation is more troublesome. No changes in the absorption strength relative to the continuum are expected from the simplest scintillation model, in which radiation from a point-like source is absorbed by foreground material. The next simplest model consists of a background source composed of several components compact enough to scintillate, with different spectral features associated with each source component. Variations in spectral features relative to the continuum are expected in this model, but appear unable to quantitatively account for the actual variations observed in these sources. For PKS 1127-145, Kanekar & Chengalur (2001) rule out a source model consisting of one point-like variable component and one component of constant flux density; the model predicts that when the source exhibits the same continuum flux density it would also exhibit the same absorption spectrum, which is not observed. Moreover, a source model composed of unrealistically many compact background components is required to account for the large number (>4) of independently varying spectral features that are actually observed. An alternate scintillation model proposed to explain HI variability in pulsars (Gwinn 2001) can also be ruled out, as it requires the source to exhibit (diffractive) scintillation in the absorbing medium, which is not observed here.
However, existing models do not take into account effects related to the finite angular diameter of the background source. The variability characteristics of the scintillation depend in detail on the source image structure. This is important because, even for the most compact quasars, the presence of any sub-structure in the absorbing medium influences the apparent image of the absorbed source. Thus the source image that scintillation responds to differs between the continuum and any spectral feature. The implication of this simple point has not been appreciated in the discussion of spectral variability, and it has a profound influence on the variability of spectral features due to interstellar scintillation.
In this paper we compute the effect of scintillation on absorption spectra, taking into account the effect of inhomogeneous structure imposed by the absorbing material across an extended background source.
The theory detailing the response of scintillation to image structure is presented in Sect. 2. In Sect. 3 the theory is applied to compute the variability properties of some commonly encountered distributions of absorbing material. The simplest model of absorption against a compact background source is used to account for the variations observed in PKS 1127-145 in Sect. 4. The implications of scintillation for the interpretation of absorption spectra are discussed in Sect. 5, and the conclusions are presented in Sect. 6. Throughout the text, we focus on systems observed in absorption. However, the theory applies to equally to spectral lines observed in emission without a background source and we indicate how the results should be interpreted for such systems.
| |
Figure 1: The geometry of the absorbing system. |
| Open with DEXTER | |
![\begin{figure}
\par\includegraphics[width=4cm,clip]{0425f2a.eps}\hspace*{4mm}
\i...
...f2b.eps}\hspace*{4mm}
\includegraphics[width=4cm,clip]{0425f2c.eps}
\end{figure}](/articles/aa/full/2005/15/aa0425-03/img7.gif) |
Figure 2:
The variability due to the continuum image of a source a) is different relative to the image of the source at two spectral lines at frequencies, say, b)
|
| Open with DEXTER | |
Consider the radiation from a background radio source whose spectrum is altered by absorption lines due to a foreground system, as shown in Fig. 1. As it enters our Galaxy, scattering by the diffuse ionized component of the interstellar medium (ISM) induces variability, or interstellar scintillation, in the intensity of the radiation. The properties of the variability depend sensitively on the angular brightness distribution toward the background source, which is influenced by the angular distribution of the absorbing material (see Fig. 2). In this section we describe how a given distribution of absorbing material determines the characteristics of the spectral variability due to scintillation.
We restrict the discussion to the effects of scattering in our Galaxy. Scintillation in the ionized medium of the absorption system may, in principle, also induce spectral variability. However, because the distance between the scattering and absorbing medium in this case is small, the apparent size of the HI absorbing structure is too large for it to be subject to the effects of scintillation.
For present purposes it is convenient to idealise the interstellar scattering material as being confined to a thin phase screen located at a distance L from the observer. This assumption is commonly used in astrophysical situations (Prokhorov et al. 1975; Rumsey 1975; Mercier 1962; Salpeter 1967), and a treatment incorporating the extended nature of the scattering medium introduces no additional effects relevant to the present discussion.
It is necessary to characterise the phase fluctuations responsible for the scattering. Observations along many lines of the sight through the Galactic interstellar medium indicate that the power spectrum of density fluctuations in the ISM often follows a power law with index ![]() close to the Kolmogorov value of
close to the Kolmogorov value of
![]() (e.g. Armstrong et al. 1995). The amplitude of the spectrum depends on the particular line of sight through the Galaxy, and is given by the scattering measure
(e.g. Armstrong et al. 1995). The amplitude of the spectrum depends on the particular line of sight through the Galaxy, and is given by the scattering measure
![]() ,
where CN2(z) denotes the level of turbulence as a function of distance along the ray path (see, e.g. Rickett 1977). The information on phase fluctuations in the thin screen approximation is succinctly embodied in the phase structure function,
,
where CN2(z) denotes the level of turbulence as a function of distance along the ray path (see, e.g. Rickett 1977). The information on phase fluctuations in the thin screen approximation is succinctly embodied in the phase structure function,
![]() ,
which takes the form
,
which takes the form
![]() for
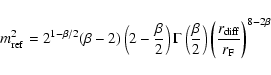
for ![]() provided that r exceeds the inner scale of the power law (Coles et al. 1987). The diffractive length,
provided that r exceeds the inner scale of the power law (Coles et al. 1987). The diffractive length,
![]() ,
is the scale at which the root mean square phase difference across the phase screen is unity, and it is defined formally in terms of the scattering measure as
,
is the scale at which the root mean square phase difference across the phase screen is unity, and it is defined formally in terms of the scattering measure as
![\begin{displaymath}r_{\rm diff} = \left[ \frac{2^{\beta-2} (\beta-2)}{8 \pi^2 r_...
...\left(1-\frac{\beta-2}{2} \right) } \right]^{1/(\beta-2)}\cdot
\end{displaymath}](/articles/aa/full/2005/15/aa0425-03/img14.gif) |
(1) |
 |
(3) |
Observations of pulsars and intra-day variable radio sources located off the Galactic plane indicate that objects viewed through the ISM at frequencies below ![]() 4 GHz are in the regime of strong scattering (Taylor & Cordes 1993; Walker 1998; Kedziora-Chudczer et al. 1997; Dennett-Thorpe & de Bruyn 2000). Thus observations of HI absorption lines, for instance, are always in the regime of strong scattering. The refractive scintillation that occurs in strong scattering is a broadband phenomenon, which is to say that a point source exhibits similar intensity variations over a bandwidth comparable to the observing frequency (i.e. over a range
4 GHz are in the regime of strong scattering (Taylor & Cordes 1993; Walker 1998; Kedziora-Chudczer et al. 1997; Dennett-Thorpe & de Bruyn 2000). Thus observations of HI absorption lines, for instance, are always in the regime of strong scattering. The refractive scintillation that occurs in strong scattering is a broadband phenomenon, which is to say that a point source exhibits similar intensity variations over a bandwidth comparable to the observing frequency (i.e. over a range
![]() ).
).
Ultra-compact sources can also exhibit another manifestation of strong scattering, called diffractive scintillation. The contribution of diffractive scintillation is omitted from the present discussion. This narrowband phenomenon contributes at high wavenumbers
![]() .
This is neglected because terms that contribute at such high spatial frequencies are suppressed unless the source angular diameter is below
.
This is neglected because terms that contribute at such high spatial frequencies are suppressed unless the source angular diameter is below
![]() which requires source sizes
which requires source sizes
![]() as at
as at
![]() GHz. Not even the most compact extragalactic sources, including intra-day variable sources, appear to satisfy this requirement (e.g. Dennison & Condon 1981; Kedziora-Chudczer et al. 2001).
GHz. Not even the most compact extragalactic sources, including intra-day variable sources, appear to satisfy this requirement (e.g. Dennison & Condon 1981; Kedziora-Chudczer et al. 2001).
In practice no extragalactic radio source can be regarded as point-like, and the power spectrum given by Eq. (4) needs to be modified to take into account both the angular structure of the extragalactic source and its foreground absorbing structure.
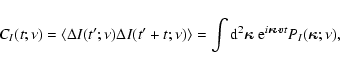
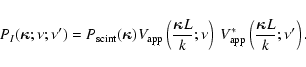
The power spectrum of intensity fluctuations across the observer's plane is the product of the point source scintillation spectrum with the power spectrum of the source angular brightness distribution (Little & Hewish 1966; Salpeter 1967; Rumsey 1975):
In practice an observer does not measure intensity fluctuations across a plane, but rather the temporal intensity fluctuations at a single point on this plane. The two are related under the assumption that the phase fluctuations are frozen into the scattering screen (e.g. Rumsey 1975). The spatial power spectrum of intensity fluctuations,
![]() ,
is related to the auto-correlation of the intensity fluctuations by a Fourier transform
,
is related to the auto-correlation of the intensity fluctuations by a Fourier transform
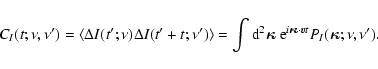
The foregoing theory applies to the autocorrelation of the intensity fluctuations at a single frequency. However, as we are interested in comparing the intensities of spectral features relative to one another and to the continuum, we also compute the covariance between intensity fluctuations at two distinct frequencies.
The frequency dependence of the covariance is potentially influenced by both its dependence on the scintillation power spectrum,
![]() ,
and on the variation in image structure with frequency.
However, the scintillations themselves are broadband (e.g. Goodman & Narayan 1989), which is to say that a points source exhibits similar intensity fluctuations over a large range of observing frequencies
,
and on the variation in image structure with frequency.
However, the scintillations themselves are broadband (e.g. Goodman & Narayan 1989), which is to say that a points source exhibits similar intensity fluctuations over a large range of observing frequencies
![]() .
Variations in
.
Variations in
![]() with frequency are therefore negligible for present purposes, and it suffices to consider only the influence of variation in image structure with frequency.
The cross power between observations at frequencies
with frequency are therefore negligible for present purposes, and it suffices to consider only the influence of variation in image structure with frequency.
The cross power between observations at frequencies ![]() and
and ![]() is (Little & Hewish 1966; Rickett 2000)
is (Little & Hewish 1966; Rickett 2000)
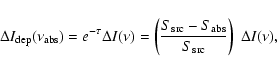
Spectral line variations can occur in sources whose continuum level also varies. Since only variations relative to the continuum indicate the presence of substructure in the absorbing material it is necessary to construct a measure of the variability that removes the contribution from continuum variability.
It is possible to separate spectral line variations from continuum fluctuations by computing how the flux density of an absorption line would vary due solely to changes in the continuum level.
The fluctuations of a spectral line whose flux density varies proportional to the continuum level,
![]() are
are
Variations induced by scintillation that are independent of the continuum level might be mistaken for variations in the optical depth, ![]() .
The amplitude of spectral line fluctuations independent of the continuum fluctuations is given by
.
The amplitude of spectral line fluctuations independent of the continuum fluctuations is given by
![]() .
The auto-correlation of independent intensity fluctuations is then
.
The auto-correlation of independent intensity fluctuations is then
A similar quantity assesses the covariance of independent variations between two spectral lines. For lines at frequencies
![]() and
and
![]() with absorbed flux densities
with absorbed flux densities
![]() and
and
![]() the cross-correlation is
the cross-correlation is
The models are also applicable to variability from systems in emission. A distribution of material in emission would exhibit the same variability properties as the same distribution seen in absorption against an extended background source. This is because the power spectra of the angular brightness distributions in the two cases are identical, except for the contribution at zero spatial frequency (
![]() )
due to the background source. As mentioned above, this contribution does not influence the variability.
)
due to the background source. As mentioned above, this contribution does not influence the variability.
We consider a model in which the intervening system is comprised of two sets of clouds, with N1 clouds of size ![]() absorbing at centre frequency
absorbing at centre frequency ![]() and N2 of size
and N2 of size ![]() absorbing at centre frequency
absorbing at centre frequency ![]() .
This is the simplest model which demonstrates that different spectral lines can vary relative to one another. The generalisation to an arbitrary number of spectral lines and cloud types is obvious, but introduces no new physics.
.
This is the simplest model which demonstrates that different spectral lines can vary relative to one another. The generalisation to an arbitrary number of spectral lines and cloud types is obvious, but introduces no new physics.
To aid in the computation of scintillation effects the exponential of the optical depth is specified in the following idealised form
![\begin{displaymath}\exp~[-\tau(\hbox{\myfont \symbol{18} };\nu)] =
\left[ 1- A...
...x{\myfont \symbol{18} }_{2,j})^2}{\theta_2^2}\right) \right],
\end{displaymath}](/articles/aa/full/2005/15/aa0425-03/img72.gif) |
(14) |
![\begin{displaymath}V_{\rm app}(\vec{r};\nu) = \frac{4 \pi^2 I_0 \delta^2(\vec{r}...
...{r} \cdot \Delta \hbox{\myfont \symbol{18} }_{\eta,i} \right],
\end{displaymath}](/articles/aa/full/2005/15/aa0425-03/img77.gif) |
(15) |
When the number of absorbing clouds is large one is justified in averaging over their positions.
The power spectrum of the apparent image contains an average over the cloud positions
![]() with
with
![]() and
and
![]() .
The evaluation of this quantity has been treated in a similar context elsewhere (Macquart 2004), to which we refer the reader for more detail.
.
The evaluation of this quantity has been treated in a similar context elsewhere (Macquart 2004), to which we refer the reader for more detail.
It is convenient to separate this average into the ![]() self-terms and
self-terms and
![]() cross-terms.
Each self-term yields a contribution of unity. The average over the cross terms proceeds by considering the clouds to be distributed randomly over an angular area
cross-terms.
Each self-term yields a contribution of unity. The average over the cross terms proceeds by considering the clouds to be distributed randomly over an angular area ![]() ,
with
,
with
![]() being the joint probability of finding the ith cloud at position
being the joint probability of finding the ith cloud at position
![]() and the jth cloud at position
and the jth cloud at position
![]() .
We assume that the statistics of the cloud positions vary only weakly over the area in which the clouds are distributed, so that we may write the probability distribution as a function of object separation,
.
We assume that the statistics of the cloud positions vary only weakly over the area in which the clouds are distributed, so that we may write the probability distribution as a function of object separation,
![]() only, and neglect its dependence on the average cloud location,
only, and neglect its dependence on the average cloud location,
![]() .
Thus one has
.
Thus one has
![$\displaystyle \sum_{j,l}^{N_\eta} \left\langle \exp\left[ -i k \vec{r} \cdot (\...
... }_{\eta,j} - \Delta \hbox{\myfont \symbol{18} }_{\eta,l})\right] \right\rangle$](/articles/aa/full/2005/15/aa0425-03/img91.gif) |
= | ![$\displaystyle N_\eta + \frac{N_\eta (N_\eta -1)}{\Omega^2} \int {\rm d}^2 {\bf\...
...yfont \symbol{18} }) \exp[i k \vec{r} \cdot \Delta \hbox{\myfont \symbol{18} }]$](/articles/aa/full/2005/15/aa0425-03/img92.gif) |
|
| = |  |
(16) |
The average power spectrum of the brightness distribution is
In the simple case in which the clouds are sparsely distributed (i.e.
![]() ), it is convenient to neglect the effect of the term involving
), it is convenient to neglect the effect of the term involving
![]() .
In fact, this term may always be ignored when the region over which the clouds are distributed greatly exceeds the refractive angular scale. In this case
.
In fact, this term may always be ignored when the region over which the clouds are distributed greatly exceeds the refractive angular scale. In this case
![]() falls to zero at sufficiently small r that it yields no contribution to the scintillation variations (cf. Eq. (7)). This is because the term involving
falls to zero at sufficiently small r that it yields no contribution to the scintillation variations (cf. Eq. (7)). This is because the term involving
![]() only contains power on angular scales much larger than that probed by scintillation.
only contains power on angular scales much larger than that probed by scintillation.
We now evaluate the auto-correlation of the temporal intensity fluctuations due to scintillation. We make the simplifying assumption that the angular scale of the absorbers is greater than or comparable to the refractive scale
![]() ,
which enables us to write the auto-correlation function in closed form (Coles et al. 1987). In this case the source power spectrum cuts off the integral in Eq. (7) over
,
which enables us to write the auto-correlation function in closed form (Coles et al. 1987). In this case the source power spectrum cuts off the integral in Eq. (7) over
![]() before the exponential term involving
before the exponential term involving ![]() (see Eq. (4)) becomes important and while the argument of the sine function is still small. Evaluation of the integral yields
(see Eq. (4)) becomes important and while the argument of the sine function is still small. Evaluation of the integral yields
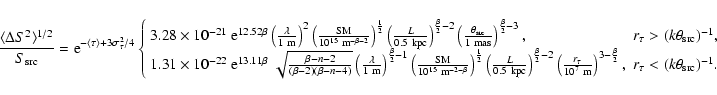
In this case a numerical estimate for the root mean square flux density variation when
![]() is
is
We also derive the time scale of fluctuations, defined as the time scale at which the correlation function reaches 1/e of its maximum value, from Eq. (18)
 |
(20) |
The cross-correlation of the intensity fluctuations
![]() is determined by the cross power of the visibilities measured at
is determined by the cross power of the visibilities measured at ![]() and
and ![]() .
This depends on the distribution of the positions of clouds of the two different sizes,
.
This depends on the distribution of the positions of clouds of the two different sizes, ![]() and
and ![]() .
A full description of the intensity cross-correlation involves the joint probability distribution of cloud centres between the two cloud types. However, a practical simplifying assumption is that the two types of clouds are distributed independently. If we assume that the cloud positions follow identical distribution functions, with the probability of finding a cloud i at position
.
A full description of the intensity cross-correlation involves the joint probability distribution of cloud centres between the two cloud types. However, a practical simplifying assumption is that the two types of clouds are distributed independently. If we assume that the cloud positions follow identical distribution functions, with the probability of finding a cloud i at position
![]() being
being
![]() ,
then the cross-correlation of the intensity fluctuations is proportional to
,
then the cross-correlation of the intensity fluctuations is proportional to
In physical terms, the result in Eq. (21) shows that the cross-power of the visibilities at the two spectral lines exhibits structure only on angular scales comparable to the entire region over which the clouds are distributed. As this scale is much larger than that probed by interstellar scintillation, it does not respond to the image structure. This is the reason that the cross-correlation between spectral lines emanating from the two independently distributed sets of absorbing clouds is zero.
In summary, we have shown that spectral lines due to absorbing clouds randomly distributed in front of a large background source can exhibit substantial variations due to interstellar scintillation. However, when multiple spectral lines are present the variations between the lines are not correlated under most conditions.
![\begin{displaymath}G(\vec{r}) = \sum_{\eta=1,2} A_\eta \frac{ \theta_\eta^2}{\th...
...\eta,j}^2}{4(\theta_{\rm src}^2 + \theta_\eta^2)} \right]\cdot
\end{displaymath}](/articles/aa/full/2005/15/aa0425-03/img126.gif) |
(25) |
 |
(27a) |
 |
(27b) |
The time scale of the intensity cross correlation, set by
![]() and
and
![]() ,
is insensitive to the angular scales of the absorbers if they are smaller than the background source, since
,
is insensitive to the angular scales of the absorbers if they are smaller than the background source, since
![]() is insensitive to
is insensitive to ![]() in this regime.
in this regime.
 |
(30b) |
 |
(30c) |
In general terms one can describe the effect of the local medium on the incident electric field of the background source,
![]() ,
as follows
,
as follows
Two specific assumptions are made concerning the statistical nature of the optical depth fluctuations. Firstly, it is assumed that the fluctuations are wide sense stationary, so that the statistical properties of
![]() do not depend on the position. Specifically, this assumption implies that quantities involving changes in optical depth between positions say,
do not depend on the position. Specifically, this assumption implies that quantities involving changes in optical depth between positions say,
![]() and
and ![]() ,
depend only on their separation,
,
depend only on their separation, ![]() .
.
The second assumption is that the statistical fluctuations in the optical depth follow a f distribution. We make this assumption in lieu of more detailed observational measurements of the distribution of optical depth fluctuations for any given spectral line. The assumption of Gaussian statistics has proven highly successful in treating fluctuations in the electron density variations in the ionized component in the interstellar medium of our Galaxy, which give rise to variations in Re![]() )
(see, for example, Armstrong et al. 1995).
)
(see, for example, Armstrong et al. 1995).
However, the model contains an implicit shortcoming, because normally distributed random variates are not constrained to either positive or negative values. As such, it makes no distinction between the statistical properties of the spatial distribution of ![]() depending on whether it is positive or negative.
Nonetheless, this shortcoming is not serious if the optical depth variations are small compared to their mean value, so that most of the medium is seen chiefly in either absorption or emission.
depending on whether it is positive or negative.
Nonetheless, this shortcoming is not serious if the optical depth variations are small compared to their mean value, so that most of the medium is seen chiefly in either absorption or emission.
Recall from the discussion in Sect. 2.2 that the scintillation characteristics of the absorption (or emission) lines depend on the mean square visibility of the absorbed (or emitting) image. We derive a general result for this quantity in Appendix C, and merely quote the result here:
The physical significance of Eq. (32) is that the opacity variations increase the amount of fine-scale structure in the image of the absorbed source. This is evident through the effect of the quantity
![]() .
The term involving
.
The term involving ![]() boosts the mean square visibility of the image by an amount that is independent of baseline length,
boosts the mean square visibility of the image by an amount that is independent of baseline length, ![]() .
However, the influence of the
.
However, the influence of the
![]() partially offsets this effect, so that there is an overall enhancement in the mean square visibility by a factor of
partially offsets this effect, so that there is an overall enhancement in the mean square visibility by a factor of
![]() for very large baselines.
for very large baselines.
The structure function of opacity variations is directly related to the power spectrum of optical depth variations,
![]() ,
by a Fourier transform:
,
by a Fourier transform:
![\begin{displaymath}D_\tau(\vec{r}) = 2 \int d^2 \hbox{\myfont \symbol{20} }~ [1-...
...bol{20} }\cdot \vec{r})] P_\tau(\hbox{\myfont \symbol{20} }).
\end{displaymath}](/articles/aa/full/2005/15/aa0425-03/img178.gif) |
(33) |
![\begin{displaymath}P_\tau (\hbox{\myfont \symbol{20} }) = Q_0 \vert \hbox{\myfon...
...}}{2 \hbox{\myfont \symbol{20} }_{\rm max}} \right)^2 \right],
\end{displaymath}](/articles/aa/full/2005/15/aa0425-03/img180.gif) |
(34) |
![\begin{displaymath}D_\tau (\vec{r}) =
\left( \frac{r}{r_\tau} \right)^{n-2}, \qq...
...ht)}{\Gamma \left( \frac{n}{2} \right)} \right]^{1/(2-n)}\cdot
\end{displaymath}](/articles/aa/full/2005/15/aa0425-03/img184.gif) |
(35) |
As an application of the foregoing formalism, let us consider the practical case of variability from a spectral line in which the power spectrum of the inhomogeneous absorbing medium follows a power law.
Recall that the response of image structure to interstellar scintillation is described in Sect. 2.2, from which we deduce that the mean square of the intensity variations is
![\begin{figure}
\par\includegraphics[width=9.4cm,clip]{0425f3.eps}
\end{figure}](/articles/aa/full/2005/15/aa0425-03/img201.gif) |
Figure 3:
The amplitude of refractive moduluation exhibited by a point source of flux density
|
| Open with DEXTER | |
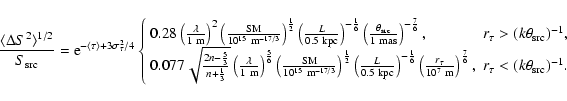
The root-mean-square flux density deviation is parametrized in terms of the optical depth variance,
![]() ,
and scattering measure, SM, as follows
,
and scattering measure, SM, as follows
 |
(39) |
 |
(40) |
We now apply the foregoing theory to observations of a variable absorption system.
PKS 1127-145 is a 5-7 Jy, z=1.187 quasar which exhibits continuum and HI-spectral variability on a time scale of ![]() days (Kanekar & Chengalur 2001). The intervening system absorbs 0.5 Jy, and is located at a redshift
days (Kanekar & Chengalur 2001). The intervening system absorbs 0.5 Jy, and is located at a redshift
![]() .
After shifting all HI spectra to the same continuum flux level, differences of
.
After shifting all HI spectra to the same continuum flux level, differences of ![]() 35 mJy were found in the strengths of the absorption lines from one observation to the next, showing that the strength of the lines varied relative to the continuum. The fluctuations are reported to be consistent with variations only in the depths of the components, and not with changes in their positions or widths.
35 mJy were found in the strengths of the absorption lines from one observation to the next, showing that the strength of the lines varied relative to the continuum. The fluctuations are reported to be consistent with variations only in the depths of the components, and not with changes in their positions or widths.
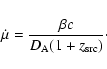
Kanekar & Chengalur consider HI variability due to motion of the line of sight towards a hypothetical superluminally ejected subcomponent of the background source. They argued that the large, rapid continuum variability on inter-day time scales requires
![]() .
The time scale of changes in the HI spectrum implies a length scale over which the HI varies significantly in the intervening system.
Assuming that the temporal variations are due to changes in the line of sight to a superluminal background source, variability on a time scale of t implies substantial changes in the
HI structure on the angular scale of (see Eq. (A.5) in Appendix A) (for
.
The time scale of changes in the HI spectrum implies a length scale over which the HI varies significantly in the intervening system.
Assuming that the temporal variations are due to changes in the line of sight to a superluminal background source, variability on a time scale of t implies substantial changes in the
HI structure on the angular scale of (see Eq. (A.5) in Appendix A) (for ![]() and
H0=65 km s-1 Mpc-1)
and
H0=65 km s-1 Mpc-1)
 |
(41) |
One can also argue that it is not feasible to explain the continuum variability as intrinsic to the source.
For observations at the frequency of the HI absorption (
![]() MHz), the variability, if intrinsic to the source, implies a brightness temperature
MHz), the variability, if intrinsic to the source, implies a brightness temperature
 |
(42) |
 |
(43) |
In the scintillation model the continuum variations imply a source size
 |
(44) |
 |
(45) |
Scintillation can induce variability in absorption lines relative to the continuum flux density and to other absorption lines. This is a natural consequence of the fact that images of the source on and off the absorption frequency differ, and that scintillation is sensitive to these differences in image structure.
Scintillation effects are important whenever the source "image'' contains significant structure on angular scales comparable to or below the scale of refractive scintillation. Variations are therefore possible even when the background source is not sufficiently compact to exhibit continuum variability: one only requires absorbing structure to be distributed on a sufficiently small scale.
The angular scale probed by scintillation is typically ![]() 0.1-1 mas for observations of HI in the local universe, which corresponds to scales from a few tens of milliparsecs to a few parsecs for the range of distances to extragalactic absorbers. Studies of HI absorption in our own Galaxy show that HI variations certainly exist on these scales (e.g. Dieter et al. 1976; Diamond et al. 1989), and there is every reason to expect similar variations in other absorbing galaxies.
However, both the size of the background source and the manner in which absorbing material is distributed across it influence the amplitude of any potential spectral variability.
0.1-1 mas for observations of HI in the local universe, which corresponds to scales from a few tens of milliparsecs to a few parsecs for the range of distances to extragalactic absorbers. Studies of HI absorption in our own Galaxy show that HI variations certainly exist on these scales (e.g. Dieter et al. 1976; Diamond et al. 1989), and there is every reason to expect similar variations in other absorbing galaxies.
However, both the size of the background source and the manner in which absorbing material is distributed across it influence the amplitude of any potential spectral variability.
Spectral line variability is expected to be more prevalent in systems absorbed against compact rather than extended sources. This is because the intensity variations due to structure imposed by clouds distributed randomly against a large background source add together independently, and reduce the amplitude of the modulations relative to the total absorbed flux density. To see this, consider the variability due to a collection of N clouds absorbing radiation against an extended background source. The power spectrum of intensity scintillations across the observer's plane is proportional to the power spectrum of the brightness distribution. The amplitude of the brightness distribution scales only linearly (rather than quadratically) with the number of absorbers if they are distributed randomly and sparsely across the background source. Thus, for a fixed absorbing flux density the root mean square amplitude of the modulations scales as N-1/2. This is of particular relevance to very large background objects, where the number of foreground absorbers can be correspondingly large.
When the background source is compact its structure acts like a high-pass filter on the structure of the absorbing material, rendering spectral variability more likely. In the case of absorption from discrete clouds, this is because the number of independent clouds contributing to the absorption is reduced. A background source which is itself compact enough to exhibit interstellar scintillation is guaranteed to exhibit spectral line variability relative to the continuum variations provided there is some variation in the optical depth across the source.
Scintillation is only capable of modulating the intensities of existing features; it does not alter the frequencies of the spectral lines. However, this does not preclude variability in the shapes of line profiles. This is expected if the angular distribution of absorbing material across the background source varies across the line profile, and is particularly relevant to observations in which contributions from individual absorbing features overlap spectrally. This would be the case if many distinct clouds contribute to the absorption at a single frequency. In essence, profile variability can occur because the apparent brightness distribution varies within the line profile and causes certain parts of the line profile to be enhanced relative to others; the scattering medium sees different source "images'' at different frequencies. Thus, while scintillation can not shift the absorption frequency, it can alter the line profile by enhancing contributions from one frequency relative to another.
When a spectral feature contains contributions from many absorbing clouds, the outer edges of the line profile are expected to exhibit greater fractional variations relative to the line centre. The edge of the line profile is more likely to contain very compact structure, due to small amounts of material at extrema of the velocity distribution. Indeed, such behaviour may have already been observed at the edge of the HI-absorption line profile in PKS 1127-145 by Kanekar & Chengalur (2001).
Different absorption lines from within the same system are expected to show differing degrees of variability, according to the amount of fine scale structure associated with each absorption line. Parts of the ISM at different temperatures in an intervening absorbing system are likely to possess different angular distributions. A colder, more densely clumped medium with more power on smaller angular scales would exhibit more variability. Such a naïve model would predict narrow lines to exhibit more variability relative to the broader lines from slightly warmer parts of the medium.
The response of scintillation to a power law spectrum of absorption (emission) fluctuations is determined by the variance and scale length of the optical depth fluctuations in the medium. For a background absorbing source larger than or comparable to the refractive scale, the presence of the optical depth fluctuations enhances the mean square amplitude fluctuations by a factor
![]() .
This enhancement is due to the extra structure imprinted on the background source by the absorbing medium.
.
This enhancement is due to the extra structure imprinted on the background source by the absorbing medium.
Scintillation-induced spectral variability is more important for absorbers at high redshifts. Absorbers of a fixed spatial scale appear smaller at high redshifts. The apparent angular diameter of structure of a fixed linear scale, s0, decreases with redshift as
![]() for angular diameter distance
for angular diameter distance
![]() .
As the angular diameter distance increases until at least
.
As the angular diameter distance increases until at least ![]() (depending on the cosmology assumed), so does the apparent source size decrease.
A second effect also enhances spectral variability at high redshift. The angular scale probed by the refractive scintillations increases with wavelength as
(depending on the cosmology assumed), so does the apparent source size decrease.
A second effect also enhances spectral variability at high redshift. The angular scale probed by the refractive scintillations increases with wavelength as
![]() .
Scintillation effects are most important when this scale exceeds the angular scale of the absorption structure. It is easier for absorption which occurs at higher redshifts, and thus at longer apparent wavelengths, to satisfy this criterion.
.
Scintillation effects are most important when this scale exceeds the angular scale of the absorption structure. It is easier for absorption which occurs at higher redshifts, and thus at longer apparent wavelengths, to satisfy this criterion.
Several other possible causes of spectral line variability have been suggested. Lewis & Ibata (2003) discuss the contribution of gravitational lensing to absorption line variability. Like scintillation, variability due to gravitational lensing requires the presence of small-scale structure in the absorbing material. However, the presence of lensing material is problematic: it is not clear whether the lensing optical depth in intervening systems is sufficiently large to reproduce the continuous sort of variability that is reported. On the other hand, if lensing effects are important then it is likely that scintillation variability will also contribute strongly to the variability, as both mechanisms depend on the presence of small scale structure in the absorbing medium.
Spatial variations in the absorbing structure coupled with motions in the background source can also cause line variability. Both Kanekar & Chengalur (2001) and the present paper discuss the possibility of source motions giving rise to HI variability in PKS 1127-145, while Briggs (1983) considers this in relation to the HI variations observed in AO 235+164.
For the model considered by Briggs (1983), the optical depth variations are not independent between spectral lines. Measurements of any two lines are sufficient to predict the variations of the other lines observed. Application of this model to AO 235+164 shows that background source motions can reproduce the spectral variability observed. However, we note that the presence of correlations between spectral line variations does not preclude scintillation as a viable explanation, as scintillation causes correlated variability between sets of spectral lines whenever there is a correlation in the spatial distribution of the absorbing material. Indeed, if the structure were all located within a small enough angle (i.e. within
![]() ), the variability would be completely correlated.
), the variability would be completely correlated.
Scintillation is most sensitive to structure on scales less than the refractive scale of the scintillation, typically ![]() 1 mas. Line variability arises when intervening absorption imposes structure in the source image that varies significantly with frequency on this angular scale.
1 mas. Line variability arises when intervening absorption imposes structure in the source image that varies significantly with frequency on this angular scale.
The theory presented here applies equally to any absorption or emission line in the radio band provided that its distribution is sufficiently compact for scintillation to be important. In this respect, the foregoing theory is also useful in the interpretation of fast maser variability (Greenhill et al. 1997).
Other possible explanations of spectral line variability include gravitational lensing effects and motions in the position of the background source relative to the absorbing material. However, the presence of small scale structure in the absorbing material in both cases means that scintillation effects are likely to play an important, if not dominant role in the variability. Scintillation is a viable explanation for the cases of spectral variability hitherto observed at radio wavelengths, particularly for observations of the HI line.
As an application of the theory, we have examined the HI variability reported along the line of sight to PKS 1127-47, in which spectral lines vary relative to one another and to the continuum. A simple model accounts for all the observed inter-day spectral variability. At this frequency, scintillation can account for variations on time scales of days to weeks. We also argue that scintillation must be important in this source even as an explanation of the continuum variability.
Acknowledgements
I thank Nissim Kanekar for many useful discussions and for reading the manuscript critically and Avinash Desphande for reviewing the manuscript and pointing out a conceptual error in the original manuscript.
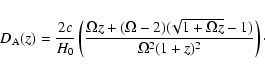
Suppose an observer at Earth measures a change in angle ![]() in the direction to the background source over a time interval. The change in angle corresponds to a distance
in the direction to the background source over a time interval. The change in angle corresponds to a distance
![]() at the source, where
at the source, where
![]() is the angular diameter distance, given by
is the angular diameter distance, given by
 |
(A.1) |
 |
(A.3) |
| (A.4) |
 |
(B.1) |
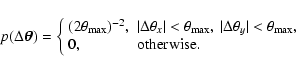
![$\displaystyle \int_{-\theta_{\rm max}}^{\theta_{\rm max}} \frac{{\rm d}\Delta \...
...\Delta \theta_y) - b
\left(\Delta \theta_x^2 + \Delta \theta_y^2\right) \right]$](/articles/aa/full/2005/15/aa0425-03/img253.gif) |
= |  |
|
![$\displaystyle -
{\rm erf} \left( \frac{2 b \theta_{\rm max} - i a_x}{2 \sqrt{b}...
...rm erf} \left( \frac{2 b \theta_{\rm max} - i a_y}{2 \sqrt{b}} \right)
\right],$](/articles/aa/full/2005/15/aa0425-03/img255.gif) |
(B.2) |
 |
(B.3) | ||
| (B.4) |
The wavefield incident upon a point ![]() on a plane at a distance D from a thin screen of absorbing material with phase variations
on a plane at a distance D from a thin screen of absorbing material with phase variations ![]() can be written in terms of the Fresnel-Kirchoff integral (see, e.g., Born & Wolf 1965; Goodman & Narayan 1989)
can be written in terms of the Fresnel-Kirchoff integral (see, e.g., Born & Wolf 1965; Goodman & Narayan 1989)
Here ![]() is regarded as a complex quantity. Since we are interested only in opacity variations, we henceforth set Re
is regarded as a complex quantity. Since we are interested only in opacity variations, we henceforth set Re![]() and consider only the imaginary contribution to the phase, Im(
and consider only the imaginary contribution to the phase, Im(
![]() .
With this specification, Eq. (C.1) is a solution to the wave equation for a thin screen of absorbing material in the absence of refraction.
.
With this specification, Eq. (C.1) is a solution to the wave equation for a thin screen of absorbing material in the absence of refraction.
Equation (C.1) incorporates wave effects that are normally neglected when considering the effect of optical depth variations. For instance, if one points a telescope toward a particular point in an absorbing medium, one expects to measure an optical depth associated with that particular point in the medium. However, although the optical depth ![]() is a well-defined quantity, Eq. (C.1) implies that the wavefield one measures contains the contributions
is a well-defined quantity, Eq. (C.1) implies that the wavefield one measures contains the contributions ![]() averaged over some region in the absorbing material, with the weighting function given by the first exponential term appearing in the integrand. This effect is important when the optical depth variations occur on a scale that is small compared to the length scale
averaged over some region in the absorbing material, with the weighting function given by the first exponential term appearing in the integrand. This effect is important when the optical depth variations occur on a scale that is small compared to the length scale
![]() .
Equation (C.1) reduces to the familiar definition of optical depth
.
Equation (C.1) reduces to the familiar definition of optical depth
![]() in the limit of geometric optics, which corresponds to
in the limit of geometric optics, which corresponds to
![]() .
However, we choose to work within the framework of physical optics in the present case because its generality allows one to consider the effect of absorbing structures that may be small compared to
.
However, we choose to work within the framework of physical optics in the present case because its generality allows one to consider the effect of absorbing structures that may be small compared to ![]() .
This case may be relevant for absorption by some extragalactic systems where D is large and the medium may be sufficiently inhomogeneous.
.
This case may be relevant for absorption by some extragalactic systems where D is large and the medium may be sufficiently inhomogeneous.
The mean square visibility of radiation from a distant absorbed background source which has propagated through the random absorbing medium is
| |
= | ||
| = | |||
![$\displaystyle \times \exp \left[ i \frac{
(\vec{x}_1-\vec{r}-\vec{r}'/2)^2 - (\...
...\vec{r}'/2)^2 - (\vec{x}_4-\vec{r}-\vec{r}'/2)^2 }{2 r_{\rm F}^2 } \right]\cdot$](/articles/aa/full/2005/15/aa0425-03/img269.gif) |
(C.2) |
| |
= | ||
| (C.3) |
Making the change of variables
| (C.4) |
| = | ![$\displaystyle \frac{1}{(2 \pi r_{\rm F}^2)^4} \int {\rm d}^2 \vec{R} ~ {\rm d}^...
...bf\rho}\cdot \vec{r} }{r_{\rm F}^2}\right] V_{\rm src}(\vec{r}_2 + {\bf\rho}/2)$](/articles/aa/full/2005/15/aa0425-03/img282.gif) |
||
| (C.5) |
![\begin{displaymath}\left\langle \vert V_{\rm abs}(\vec{r}') \vert ^2 \right\rang...
...ngle \eta \rangle + 6 C_\eta(0) - 2 D_\eta (\vec{r}') \right].
\end{displaymath}](/articles/aa/full/2005/15/aa0425-03/img291.gif) |
(C.7) |
![\begin{displaymath}P_{\rm scint}(\hbox{\myfont \symbol{20} }) = 8 \pi r_{\rm e}^...
...t( \frac{\hbox{\myfont \symbol{20} }L}{k} \right) \right]\cdot
\end{displaymath}](/articles/aa/full/2005/15/aa0425-03/img18.gif)
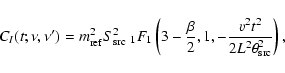
![$\displaystyle C_I(t;\nu_{\rm abs},\nu_{\rm abs}) - \left(\frac{S_{\rm src}-S_{\...
...t]+ \left(\frac{S_{\rm src}-S_{\rm abs}}{S_{\rm src}} \right)^2 C_I(t;\nu,\nu).$](/articles/aa/full/2005/15/aa0425-03/img53.gif)
![\begin{displaymath}C_{\rm indep}(t;\nu) = 4 \pi^2 r_{\rm e}^2 \lambda^2 {\rm SM}...
...{\beta}{2},1,-\frac{v^2 t^2}{2 L^2 \theta_\eta^2}\right] \cdot
\end{displaymath}](/articles/aa/full/2005/15/aa0425-03/img102.gif)
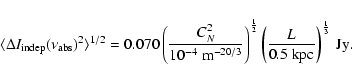
![\begin{displaymath}\left\langle (\Delta I)^2 \right\rangle_{\eta}^{1/2} = 0.36 ~...
...ft[ \frac{{S_{\rm abs}}_{\eta}^2}{N_{\eta}} \right]^{1/2}\cdot
\end{displaymath}](/articles/aa/full/2005/15/aa0425-03/img103.gif)
![\begin{displaymath}I_{\rm src}(\hbox{\myfont \symbol{18} })=I_0 \exp \left[ - \frac{\hbox{\myfont \symbol{18} }^2}{\theta_{\rm src}^2}\right],
\end{displaymath}](/articles/aa/full/2005/15/aa0425-03/img120.gif)
![$\displaystyle S_{\rm src}^2 \left\{ \exp \left[ -\frac{k^2 r^2 \theta_{\rm src}^2}{4} \right] - G(\vec{r}) \right\}^2,$](/articles/aa/full/2005/15/aa0425-03/img123.gif)
![$\displaystyle ~ S_{\rm src}^2
\exp \left[ - \frac{ k^2 r^2 \theta_{\rm src}^2}{...
...exp \left[ - \frac{k^2 r^2 \theta_{\rm src}^2}{4}\right] - G(\vec{r}) \right\},$](/articles/aa/full/2005/15/aa0425-03/img125.gif)
![\begin{displaymath}\langle V_{\rm app}(\vec{r};\nu) V_{\rm app}^*(\vec{r};\nu) \...
...ta^2}{2(\theta_{\rm src}^2 + \theta_\eta^2)} \right] \right\},
\end{displaymath}](/articles/aa/full/2005/15/aa0425-03/img147.gif)
![\begin{displaymath}\langle V_{\rm app}(\vec{r};\nu) V_{\rm app}^*(\vec{r};\nu') ...
...\exp \left[ - \frac{k^2 r^2 \theta_{\rm src}^2}{2}\right]\cdot
\end{displaymath}](/articles/aa/full/2005/15/aa0425-03/img148.gif)
![\begin{displaymath}\left \langle \vert V_{\rm app} (\vec{r})\vert^2 \right\rangl...
...tau \rangle + \frac{3}{2} C_\tau(0) - D_\tau(\vec{r}) \right],
\end{displaymath}](/articles/aa/full/2005/15/aa0425-03/img168.gif)
![\begin{displaymath}\left\langle \Delta S^2 \right\rangle = 8 \pi r_{\rm e}^2 \la...
... \frac{\hbox{\myfont \symbol{20} }L}{2 k} \right) \right]\cdot
\end{displaymath}](/articles/aa/full/2005/15/aa0425-03/img186.gif)
![\begin{displaymath}u(\vec{r}) = \frac{{\rm e}^{ik D}}{2 \pi i r_{\rm F}^2 } \int...
...ec{r}) ^2}{2 r_{\rm F}^2} \right] {\rm e}^{ i \phi(\vec{x})} ,
\end{displaymath}](/articles/aa/full/2005/15/aa0425-03/img258.gif)
![$\displaystyle \langle u(\vec{r}+\vec{r}'/2) u^*(\vec{r}-\vec{r}'/2) u(\vec{r}+\...
...\vec{r}_1 }{r_{\rm F}^2}\right]
V_{\rm src}(\vec{r}_2) V_{\rm src}^*(\vec{r}_2)$](/articles/aa/full/2005/15/aa0425-03/img288.gif)