A&A 430, 481-489 (2005)
DOI: 10.1051/0004-6361:20040447
Massive star formation in the W49 giant molecular cloud: Implications for the formation of massive star clusters
N. L. Homeier 2,1 - J. Alves 2
1 - Johns Hopkins University, Department of Physics and Astronomy, 21218 Baltimore, MD, USA
2 - European Southern Observatory, Karl-Schwarzschild Str. 2, 85748 Garching b. München, Germany
Received 15 March 2004 / Accepted 8 September 2004
Abstract
We present results from JHKs imaging of the densest
region of the W49 molecular cloud. In a recent paper
(2003, ApJ, 589, L45), we reported the detection of (previously unknown)
massive stellar clusters
in the well-known giant radio HII region W49A, and here we
continue our analysis.
We use the extensive line-of-sight extinction to isolate a population
of objects associated with W49A. We constrain the slope of the
stellar luminosity function by constructing an extinction-limited
luminosity function, and use this to obtain a mass function. We find no
evidence for a top-heavy MF, and the slope of the
derived mass function is
 .
We identify candidate
massive stars from
our color-magnitude diagram, and we use these to estimate the
current total stellar mass of
.
We identify candidate
massive stars from
our color-magnitude diagram, and we use these to estimate the
current total stellar mass of
 in the region
of the W49 molecular cloud covered by our survey.
Candidate ionizing stars for several
ultra-compact HII regions are detected, with many having multipe candidate
sources.
On the global molecular cloud scale in W49, massive star formation apparently
did not proceed in a single
concentrated burst, but in small groups, or subclusters. This may be
an essential physical description for star formation in what
will later be termed a "massive star cluster''.
in the region
of the W49 molecular cloud covered by our survey.
Candidate ionizing stars for several
ultra-compact HII regions are detected, with many having multipe candidate
sources.
On the global molecular cloud scale in W49, massive star formation apparently
did not proceed in a single
concentrated burst, but in small groups, or subclusters. This may be
an essential physical description for star formation in what
will later be termed a "massive star cluster''.
Key words: ISM: H II regions - ISM: bubbles - Galaxy: open clusters
and associations: individual: W49A - stars: formation - Galaxy: disk
- infrared: ISM
The W49 Giant Molecular Cloud (GMC) is the most massive in the Galaxy
outside the Galactic center; it extends over more than 50 pc
in diameter (Simon et al. 2001) with a mass of
 .
Embedded within this cloud, W49A (Mezger et al. 1967; Shaver & Goss 1970)
is one of the brightest Galactic giant radio H II regions
(
.
Embedded within this cloud, W49A (Mezger et al. 1967; Shaver & Goss 1970)
is one of the brightest Galactic giant radio H II regions
(
 ,
Smith et al. 1978). As such, it has been
used as a template for comparison with extragalactic
"ultradense HII regions'' (UD H II; Johnson & Kobulnicky 2003), which
appear to be massive star clusters in the process of assembly (Johnson et al. 2001; Vacca et al. 2002).
,
Smith et al. 1978). As such, it has been
used as a template for comparison with extragalactic
"ultradense HII regions'' (UD H II; Johnson & Kobulnicky 2003), which
appear to be massive star clusters in the process of assembly (Johnson et al. 2001; Vacca et al. 2002).
![\begin{figure}
\par\includegraphics[width=16.5cm,clip]{0447fig1.eps}
\end{figure}](/articles/aa/full/2005/05/aa0447-04/Timg17.gif) |
Figure 1:
J, H, and Ks images of the W49A region. The main star cluster
begins to appear in the H image, but is readily apparent in the Ks image,
as are many diffuse nebular features.
North is up and East to the left. |
| Open with DEXTER |
The W49A star-forming
region lies in the Galactic plane (
 ,
,
 )
at a distance of
)
at a distance of
 kpc (Gwinn et al. 1992) and has
 40 UC H II regions (e.g.,
De Pree et al. 1997,2000; Smith et al. 2000) associated with a minimum of 40 central stars earlier than B3 (later than this, the star does not
put out the necessary UV photons to ionize the surrounding gas, and it
will not be detected as a UC H II region). About 12 of these radio
sources are arranged in the well known Welch "ring'' (Welch et al. 1987).
A few other young Galactic clusters have a large number of massive
stars, e.g., the Carina nebula (e.g. Walborn 1995; Rathborne et al. 2002),
NGC 3603
(e.g. Moffat et al. 1994; Drissen et al. 1995; Eisenhauer et al. 1998; Brandl et al. 1999; Brandner et al. 2001; Moffat et al. 2002; Nürnberger & Petr-Gotzens 2002; Sung & Bessell 2004; Stolte et al. 2004),
Cygnus OB2 (e.g. Knödlseder 2000; Comerón et al. 2002;
Hanson 2003), the Arches cluster
(e.g. Serabyn et al. 1998; Blum et al. 2001b; Figer et al. 2002; Stolte et al. 2002), and
Westerlund 1 (Clark & Negueruela 2002), or
are very young, e.g. NGC 3576 (Barbosa et al. 2003; Figuerêdo et al. 2002), W42
(Blum et al. 2000),
and W31 (Kim & Koo 2002; Blum et al. 2001a) but no other known
region has a large number of massive stars in such a highly embedded
and early evolutionary state. For this reason W49A is unique in our
known Galaxy.
40 UC H II regions (e.g.,
De Pree et al. 1997,2000; Smith et al. 2000) associated with a minimum of 40 central stars earlier than B3 (later than this, the star does not
put out the necessary UV photons to ionize the surrounding gas, and it
will not be detected as a UC H II region). About 12 of these radio
sources are arranged in the well known Welch "ring'' (Welch et al. 1987).
A few other young Galactic clusters have a large number of massive
stars, e.g., the Carina nebula (e.g. Walborn 1995; Rathborne et al. 2002),
NGC 3603
(e.g. Moffat et al. 1994; Drissen et al. 1995; Eisenhauer et al. 1998; Brandl et al. 1999; Brandner et al. 2001; Moffat et al. 2002; Nürnberger & Petr-Gotzens 2002; Sung & Bessell 2004; Stolte et al. 2004),
Cygnus OB2 (e.g. Knödlseder 2000; Comerón et al. 2002;
Hanson 2003), the Arches cluster
(e.g. Serabyn et al. 1998; Blum et al. 2001b; Figer et al. 2002; Stolte et al. 2002), and
Westerlund 1 (Clark & Negueruela 2002), or
are very young, e.g. NGC 3576 (Barbosa et al. 2003; Figuerêdo et al. 2002), W42
(Blum et al. 2000),
and W31 (Kim & Koo 2002; Blum et al. 2001a) but no other known
region has a large number of massive stars in such a highly embedded
and early evolutionary state. For this reason W49A is unique in our
known Galaxy.
To uncover the embedded stellar population in W49A we
performed a
 (16 pc
  16 pc),
deep J, H, and Ks-band imaging survey centered on the densest region
of the W49 GMC (Simon et al. 2001, see their Fig. 2). The initial
results were presented in Alves & Homeier (2003), where we reported
the discovery of one massive and three smaller stellar clusters
detected at NIR wavelengths. In this companion paper
we present our photometric results, including the number of massive star
candidates, objects with infrared excesses, and candidate ionizing
sources of compact and ultracompact H II regions.
16 pc),
deep J, H, and Ks-band imaging survey centered on the densest region
of the W49 GMC (Simon et al. 2001, see their Fig. 2). The initial
results were presented in Alves & Homeier (2003), where we reported
the discovery of one massive and three smaller stellar clusters
detected at NIR wavelengths. In this companion paper
we present our photometric results, including the number of massive star
candidates, objects with infrared excesses, and candidate ionizing
sources of compact and ultracompact H II regions.
To better interpret what we observe in the W49A star-forming region,
we will briefly mention a simplified version of
the stages of massive star formation.
The hot core phase is that of a rapidly
accreting, massive protostar. Although the protostar is emitting
UV photons at this stage, the H II emission is "quenched''
due to the high accretion rate (Walmsley 1995; Churchwell 2002).
The next phase is the ultra-compact H II (UC H II) phase, and is the
best studied one observationally. A UC H II region contains
a central hydrogen-burning star which has ceased to accrete appreciably.
The star's UV flux eats through its gas and dust cocoon and
will eventually break out of the dense local medium to ionize
surrounding more diffuse ISM. UC H II regions are radio-, far-IR-, and
sometimes mid-IR-bright, but often undetectable at NIR
wavelengths due to high local extinction. As the star disperses
more of the surrounding gas and dust, the UC H II region
becomes observable at shorter and shorter wavelengths, until the
central object finally emerges as an unobscured massive star (see
Churchwell 2002).
3 Observations and data reduction
The observations were taken on June 8, 2001, with the SOFI
(Moorwood et al. 1998) near-infrared
camera on the ESO's 3.5 m New Technology Telescope (NTT) on La Silla,
Chile, during a spell of good weather and exceptional seeing (FWHM
of the final combined images
 ). SOFI employs a
 Hawaii HgCdTe array, and the observations were taken with a plate scale
of
Hawaii HgCdTe array, and the observations were taken with a plate scale
of
 pixel. A set of 30 dithered images of 60 s each were taken in the J, H, and Ks filters. The images were
combined with the DIMSUM
pixel. A set of 30 dithered images of 60 s each were taken in the J, H, and Ks filters. The images were
combined with the DIMSUM![[*]](/icons/foot_motif.gif) package. The pixel scale
of the final combined images is
package. The pixel scale
of the final combined images is
 pixel. Standard stars
9136, 9157, and 9172 from the Persson catalog (Persson et al. 1998)
were observed at the beginning, middle, and end of the night
to obtain an airmass solution. Photometry was
performed with the DAOPHOT package in IRAF.
DAOFIND was used to detect sources above a threshold of 5 sigma.
PSF models were constructed for each image using 5-7 isolated, bright
stars, the tasks PSTSELECT, PSF, and ALLSTAR were run to extract
the final photometry, and aperture corrections were performed.
J and H coordinates were transformed to Ks image
coordinates using GEOMAP and GEOXYTRAN.
Objects with errors larger than 0.15 mag and objects within 150 pixels of the image edges were excluded. Our final J, H, and Ks images
are shown in Fig. 1. Our final samples contain 2255 and
7299, for the matched JHKs and HKs lists, respectively.
pixel. Standard stars
9136, 9157, and 9172 from the Persson catalog (Persson et al. 1998)
were observed at the beginning, middle, and end of the night
to obtain an airmass solution. Photometry was
performed with the DAOPHOT package in IRAF.
DAOFIND was used to detect sources above a threshold of 5 sigma.
PSF models were constructed for each image using 5-7 isolated, bright
stars, the tasks PSTSELECT, PSF, and ALLSTAR were run to extract
the final photometry, and aperture corrections were performed.
J and H coordinates were transformed to Ks image
coordinates using GEOMAP and GEOXYTRAN.
Objects with errors larger than 0.15 mag and objects within 150 pixels of the image edges were excluded. Our final J, H, and Ks images
are shown in Fig. 1. Our final samples contain 2255 and
7299, for the matched JHKs and HKs lists, respectively.
We compared our Ks photometry with the K observations of
Conti & Blum (2002).
From a sample of 493 stars in both data sets, we find an offset of
0.1 mag between the K and Ks magnitudes, with the SOFI photometry
presented here being 0.1 mag fainter than the OSIRIS photometry.
This offset can be accounted for by the different filter response
curves and the highly reddened nature of the objects.
We performed tests
with the SYNPHOT task CALCPHOT for the SOFI Ks and OSIRIS K
(K185) filters. Using the Galactic extinction law of Clayton et al. (CCM) (1989) for
E(B-V)=10.85 (
 ),
SOFI
),
SOFI
 for a 30 000 K blackbody,
there is a
0.037-0.056 mag difference for
30 000-3000 K blackbodies,
with the SOFI photometry being fainter. With
E(B-V)=7.0 (
for a 30 000 K blackbody,
there is a
0.037-0.056 mag difference for
30 000-3000 K blackbodies,
with the SOFI photometry being fainter. With
E(B-V)=7.0 (
 ),
SOFI
),
SOFI
 for a 30 000 K blackbody,
there is a
0.014-0.029 mag difference for
30 000-3000 K blackbodies,
again with the SOFI photometry being fainter. It would seem that
approximately
0.04-0.09 mag are unaccounted for, however,
the extinction
laws available with SYNPHOT do not include the widely accepted
Rieke & Lebofsky (RL) (1985) Galactic extinction law, which we use
throughout the rest of the paper.
The slope of this extinction law also describes the slope
of our color-color relation shown in Fig. 2.
for a 30 000 K blackbody,
there is a
0.014-0.029 mag difference for
30 000-3000 K blackbodies,
again with the SOFI photometry being fainter. It would seem that
approximately
0.04-0.09 mag are unaccounted for, however,
the extinction
laws available with SYNPHOT do not include the widely accepted
Rieke & Lebofsky (RL) (1985) Galactic extinction law, which we use
throughout the rest of the paper.
The slope of this extinction law also describes the slope
of our color-color relation shown in Fig. 2.
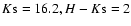
For AK=1, the CCM law gives H-K=0.6, while the RL law
gives H-K=0.57. Thus there is a difference of
0.03-0.09 mag for
AK=1-3, typical of the stars in this
region. Therefore, if the RL extinction law (and not the CCM law)
accurately describes the extinction
along the line of sight to W49A (which we have evidence for)
then the 0.1 mag offset between our SOFI Ks
magnitudes and the K magnitudes of Conti & Blum (2002)
should be due to the different filter response curves and the
highly reddened nature of the stars.
![\begin{figure}
\par\includegraphics[width=6.4cm,clip]{0447fig2.eps}
\end{figure}](/articles/aa/full/2005/05/aa0447-04/Timg34.gif) |
Figure 2:
Color-color diagram for our survey. The main sequence and giant
tracks are overplotted, as is a light solid line indicating the reddening
sequence for the bluest, hottest stars. A Rieke & Lebofsky (1985)
extinction law was used. |
| Open with DEXTER |
3.2 Completeness limits
The completeness limits were determined by adding 500-1500 fake stars to
each image and extracting them in the same way in which the data analysis
was performed. The fake stars were created with the psf image used
with the ALLSTAR task, and input to the science images with ADDSTAR.
We consider a star as recovered only
if its recovered magnitude is within
0.15 mag (our error cut) of the input magnitude.
The 80% completeness limits for the J, H, and Ks filter images are
20.0,
18.7, and 17.2, respectively. The limits reflect the increasing importance
of crowding in our images from J to Ks.
Because of crowding concerns, we also performed completeness
tests on the central
 pixels of our images.
For the H and Ks images, the 80% completeness limits were approximately
0.5 mag brighter than the limits for the entire field. The J limit
was unaffected.
pixels of our images.
For the H and Ks images, the 80% completeness limits were approximately
0.5 mag brighter than the limits for the entire field. The J limit
was unaffected.
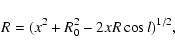
4.1 Luminosity functions
Our images contain many stars along the line of sight, but we can
use the reddening within the Galactic disk to our advantage.
We attempt to identify a stellar population associated with the W49A
region by first selecting objects with
 colors red enough to be consistent with a distance of 11.4 kpc along the
Galactic plane. This can be calculated by assuming an
exponential distribution of dust (as in Homeier et al. 2003)
so that the extinction follows the form:
colors red enough to be consistent with a distance of 11.4 kpc along the
Galactic plane. This can be calculated by assuming an
exponential distribution of dust (as in Homeier et al. 2003)
so that the extinction follows the form:
where x is
kpc from Gwinn et al. (1992), l=43,
R0=8 kpc, and
 kpc (Kent et al. 1991). For these
parameters we arrive at AK=2.1 and H-K=1.2 for a
Rieke & Lebofsky (1985) reddening law.
kpc (Kent et al. 1991). For these
parameters we arrive at AK=2.1 and H-K=1.2 for a
Rieke & Lebofsky (1985) reddening law.
In the remainder of the paper, we consider objects within
 of
19d10m17.5s,
of
19d10m17.5s,
 (J2000)
to be associated with Cluster 1, which corresponds to the arc of
ionized emission to the North, and a physical distance of 2.5 pc.
(J2000)
to be associated with Cluster 1, which corresponds to the arc of
ionized emission to the North, and a physical distance of 2.5 pc.
![\begin{figure}
\par\includegraphics[width=8cm,clip]{0447fig3.eps}\end{figure}](/articles/aa/full/2005/05/aa0447-04/Timg39.gif) |
Figure 3:
The K-band luminosity function for all objects. The binsize is 0.3 mag. We show the 80% completeness limit as a dashed line. |
| Open with DEXTER |
![\begin{figure}
\par\includegraphics[width=8cm,clip]{0447fig4.eps}\end{figure}](/articles/aa/full/2005/05/aa0447-04/Timg40.gif) |
Figure 4:
The K-band luminosity function for objects with
 which
are likely to be associated with the W49A star-forming region
(see text).
The binsize is 0.3 mag. The dashed histogram indicates objects within
of our adopted center of Cluster 1. We include the 80%
completeness
limit for the entire field as a dashed line, and for the inner
pixels as a dotted line.
which
are likely to be associated with the W49A star-forming region
(see text).
The binsize is 0.3 mag. The dashed histogram indicates objects within
of our adopted center of Cluster 1. We include the 80%
completeness
limit for the entire field as a dashed line, and for the inner
pixels as a dotted line. |
| Open with DEXTER |
![\begin{figure}
\par\includegraphics[width=6.9cm,clip]{0447fig5.eps}
\end{figure}](/articles/aa/full/2005/05/aa0447-04/Timg41.gif) |
Figure 5:
 Color-magnitude diagram showing the limits for an
extinction-limited sample. We chose an H-K=2.0 limit to cover a
reasonable range of reddening. For the entire field, our 80%
completeness limits are H=18.7 and
Color-magnitude diagram showing the limits for an
extinction-limited sample. We chose an H-K=2.0 limit to cover a
reasonable range of reddening. For the entire field, our 80%
completeness limits are H=18.7 and
 .
However, crowding in the
center of the image reduces this to H=18.2, .
However, crowding in the
center of the image reduces this to H=18.2,
 Thus at
 ,
H-K=2, we are above 80% completeness for everything brighter and
bluer than these limits. This defines the bottom-right corner of
the overplotted polygon. The slope of the bottom edge is determing by the
extinction law, and the H-K=1.2 limit is described in Sect. 4.1. ,
H-K=2, we are above 80% completeness for everything brighter and
bluer than these limits. This defines the bottom-right corner of
the overplotted polygon. The slope of the bottom edge is determing by the
extinction law, and the H-K=1.2 limit is described in Sect. 4.1. |
| Open with DEXTER |
In Fig. 3 we present the K-band luminosity function for all
objects in our H and K sample, and in Fig. 4 we select only
those objects with
as being located at or farther than the W49
molecular cloud as described above.
The histogram for objects within
of Cluster 1 is plotted with a
dashed line, and a solid line indicates all objects outside this region.
The binsize is 0.3 mag, and the bin boundary at the faint magnitude
limit was chosen to be the magnitude of the faintest star in each sample.
We would like an unbiased luminosity function for the stars associated with
W49, so we select an extinction-limited sample of stars
within
of our adopted center of Cluster 1. We expect negligible
background contamination near Cluster 1 due to the large optical depth of
the W49 molecular cloud. The magnitude and
color limits of our
extinction-limited sample are shown in Fig. 5. The
 limit is set by our best estimate of foreground extinction as
previously described.
Our 80% completeness limits for the entire field are at
H=18.7 and
.
Thus at
,
limit is set by our best estimate of foreground extinction as
previously described.
Our 80% completeness limits for the entire field are at
H=18.7 and
.
Thus at
,
 ,
we are
above 80% completeness for everything brighter and bluer than these
limits. However, crowding in the center reduces these 80%
completeness limits to H=18.2 and
,
and thus
,
we are
above 80% completeness for everything brighter and bluer than these
limits. However, crowding in the center reduces these 80%
completeness limits to H=18.2 and
,
and thus
 defines the bottom-right
corner of the overplotted region. The slope of the bottom edge is
determined by a Rieke & Lebofsky extinction law (1985).
defines the bottom-right
corner of the overplotted region. The slope of the bottom edge is
determined by a Rieke & Lebofsky extinction law (1985).
The extinction-limited KLF for Cluster 1 is shown in
Fig. 6,
and for everything in our field in
Fig. 8. For these histograms, the bin boundary at
the faint end was set at the faintest star in each sample.
The error bars are  ,
where N is the number of stars in each bin.
,
where N is the number of stars in each bin.
![\begin{figure}
\par\includegraphics[width=8cm,clip]{0447fig6.eps}\end{figure}](/articles/aa/full/2005/05/aa0447-04/Timg46.gif) |
Figure 6:
Extinction-limited K-band luminosity function for Cluster 1. The binsize
is 0.5 mag. |
| Open with DEXTER |
![\begin{figure}
\par\includegraphics[width=8cm,clip]{0447fig7.eps}\end{figure}](/articles/aa/full/2005/05/aa0447-04/Timg47.gif) |
Figure 7:
Extinction-limited extinction-corrected K-band luminosity function
for Cluster 1. The binsize is 0.5 mag. The slope of the fitted line
is
 .
We used a larger bin size to take into account
extinction correction errors caused by intrinsic
colors. .
We used a larger bin size to take into account
extinction correction errors caused by intrinsic
colors. |
| Open with DEXTER |
![\begin{figure}
\par\includegraphics[width=8cm,clip]{0447fig8.eps}
\end{figure}](/articles/aa/full/2005/05/aa0447-04/Timg48.gif) |
Figure 8:
Extinction-limited K-band luminosity function for all objects.
The binsize is 0.5 mag. |
| Open with DEXTER |
![\begin{figure}
\par\includegraphics[width=8cm,clip]{0447fig9.eps}\end{figure}](/articles/aa/full/2005/05/aa0447-04/Timg49.gif) |
Figure 9:
Extinction-limited extinction-corrected K-band luminosity function
for all objects. The binsize is 0.5 mag. The slope of the fitted line
is
 .
We used a larger bin size to take into account extinction
correction errors caused by intrinsic
colors. .
We used a larger bin size to take into account extinction
correction errors caused by intrinsic
colors. |
| Open with DEXTER |
Since both samples suffer from severe non-uniform extinction, we
corrected for this effect assuming an intrinsic color of
 .
This choice is based on the knowledge
that all stars without hot dust are intrinsically
nearly colorless in the near-infrared, with
ranging from 0.0 to 0.3.
We expect objects associated with the W49A star-forming region to be early-type
stars with intrinsic
near 0.0, whereas giant stars should
have intrinsic
up to 0.3. Thus we calculate extinction-corrected
K magnitudes as
.
This choice is based on the knowledge
that all stars without hot dust are intrinsically
nearly colorless in the near-infrared, with
ranging from 0.0 to 0.3.
We expect objects associated with the W49A star-forming region to be early-type
stars with intrinsic
near 0.0, whereas giant stars should
have intrinsic
up to 0.3. Thus we calculate extinction-corrected
K magnitudes as
 .
Dereddening a star with an intrinsic color
.
Dereddening a star with an intrinsic color
 to
will result
in an inferred Ks magnitude which is 0.25 mag too faint, whereas a
star with an intrinsic
to
will result
in an inferred Ks magnitude which is 0.25 mag too faint, whereas a
star with an intrinsic
 will be 0.25 mag too bright.
Our extinction-corrected extinction-limited KLFs for Cluster 1 and
for all objects in our field are shown in
Figs. 7 and 9.
We use 0.5 mag bins for these samples to take into account the
uncertainty in the extinction correction. The bin boundary at the faint
end was set to K=12.95, the faintest extinction-corrected magnitude allowed
by our selection criteria.
A linear least-squares fit was made, yielding a slope of
for Cluster 1 and
for the entire field.
Any photometric mass function relies on a
magnitude-mass relation, which has its source in a luminosity-mass
relation.
We take the relationship between initial mass and absolute
K magnitude from the
 yr isochrones of
Lejeune & Schaerer (2001) with enhanced mass loss rates.
We can then construct a mass function
by converting our extinction-limited extinction-corrected
Ks luminosity function for our entire field to a mass function
by transforming
each magnitude bin to a mass bin. We can also
convert magnitudes for individual stars into masses,
then bin these masses to arrive at a mass histogram.
The mass functions derived in these two ways are
shown in Fig. 10.
We extrapolated the magnitude-mass relation to infer masses for the most
luminous stars, which are more luminous than the
yr isochrones of
Lejeune & Schaerer (2001) with enhanced mass loss rates.
We can then construct a mass function
by converting our extinction-limited extinction-corrected
Ks luminosity function for our entire field to a mass function
by transforming
each magnitude bin to a mass bin. We can also
convert magnitudes for individual stars into masses,
then bin these masses to arrive at a mass histogram.
The mass functions derived in these two ways are
shown in Fig. 10.
We extrapolated the magnitude-mass relation to infer masses for the most
luminous stars, which are more luminous than the
 models.
Errors of 10-20% in the mass estimates are expected simply
from the uncertainty in the distance.
models.
Errors of 10-20% in the mass estimates are expected simply
from the uncertainty in the distance.
Our slopes are derived from linear least-squares fits weighted with the
errors derived from Poisson statistics ().
The mass function slopes yielded by the two methods,
 and
and
 ,
are in excellent agreement
The error in each slope measurement is large and there are many sources of
uncertainty, but we can conclude that we do not find
evidence for a top-heavy IMF.
If we use the 1 Myr isochrones, our measured slopes are
,
are in excellent agreement
The error in each slope measurement is large and there are many sources of
uncertainty, but we can conclude that we do not find
evidence for a top-heavy IMF.
If we use the 1 Myr isochrones, our measured slopes are
 and
and
 ,
within the
,
within the  uncertainties.
The slope of our mass function and the number of stars in the sample
indicate that we should have at least one
 in our extinction-limited
sample. Our J image does not go deep enough for us to securely identify
extremely massive candidates. There are several luminous objects at Ks
for which we lack J magnitudes, and we are therefore unable to
quantify the contribution to the Ks magnitude from hot dust.
in our extinction-limited
sample. Our J image does not go deep enough for us to securely identify
extremely massive candidates. There are several luminous objects at Ks
for which we lack J magnitudes, and we are therefore unable to
quantify the contribution to the Ks magnitude from hot dust.
![\begin{figure}
\par\includegraphics[width=16.2cm,clip]{0447fig10.eps}
\end{figure}](/articles/aa/full/2005/05/aa0447-04/Timg59.gif) |
Figure 10:
Mass functions from the extinction-limited extinction-corrected sample
shown in Fig. 9. In the left panel we transformed
the Ks magnitudes
of the luminosity function into mass. The mass bin sizes thus depend on the
mass-magnitude relationship.
The fitted slope is
.
In the right panel, masses were derived
based
on the Ks magnitudes for individual stars, and the log(M) bins are
0.1. The fitted slope is
.
We do not find
evidence for a top-heavy IMF. |
| Open with DEXTER |
To estimate the number of stars with masses
 associated with the W49A region,
we will assume
intrinsic colors of H-K=0 and calculate the unobscured apparent K magnitude
as
associated with the W49A region,
we will assume
intrinsic colors of H-K=0 and calculate the unobscured apparent K magnitude
as
 .
As in the previous section, we use the
relation between mass and absolute K magnitude from the
Lejeune & Schaerer (2001) models at
yr for solar
metallicity and enhanced mass loss. Assuming an age from
.
As in the previous section, we use the
relation between mass and absolute K magnitude from the
Lejeune & Schaerer (2001) models at
yr for solar
metallicity and enhanced mass loss. Assuming an age from
 yr to 2 Myr has a
negligible effect on our overall result.
yr to 2 Myr has a
negligible effect on our overall result.
Figure 11 shows our CMD with the
position of a
yr 20  star, and a reddening line indicating AK=5. All stars
above this line with
are identified as candidate massive stars.
We will use this sample later to estimate the total stellar mass in the
region.
star, and a reddening line indicating AK=5. All stars
above this line with
are identified as candidate massive stars.
We will use this sample later to estimate the total stellar mass in the
region.
There is no robust
way to measure the background in such a region, as the cluster is
embedded in a molecular cloud, which means the extinction is non-uniform
across the field. However, one likely contaminant is disk giant stars.
Absolute Ks magnitudes for the brightest disk giant stars should
be
 (Sparke & Gallagher 2000),
which is equivalent to an apparent magnitude of
(Sparke & Gallagher 2000),
which is equivalent to an apparent magnitude of
 at a distance
of 12 kpc (neglecting extinction), just farther than the W49A region.
Assuming
AK=2-2.5 mag, they would have apparent magnitudes
of
at a distance
of 12 kpc (neglecting extinction), just farther than the W49A region.
Assuming
AK=2-2.5 mag, they would have apparent magnitudes
of
 .
If we select stars with
.
If we select stars with
 and Ks in this
magnitude range, we find that they are not uniformly
distributed over our field, but fall preferentially on the northern half.
This is consistent with their identification as background giant stars, as
the W49 molecular cloud is less dense as one goes from the center
to the northern edge of the image. From the non-uniform distribution
of reddened sources in our field, which we identify as background giants,
we estimate
that they contribute 20-30 stars to our total.
Another source of contamination in our census of massive stars
is a possible population of stars which are undetected at J with
Ks excesses, which could make
some less massive stars appear as more massive stars.
and Ks in this
magnitude range, we find that they are not uniformly
distributed over our field, but fall preferentially on the northern half.
This is consistent with their identification as background giant stars, as
the W49 molecular cloud is less dense as one goes from the center
to the northern edge of the image. From the non-uniform distribution
of reddened sources in our field, which we identify as background giants,
we estimate
that they contribute 20-30 stars to our total.
Another source of contamination in our census of massive stars
is a possible population of stars which are undetected at J with
Ks excesses, which could make
some less massive stars appear as more massive stars.
Our J-H vs.
color-color diagram is shown in Fig. 2,
with the main sequence and giant tracks overplotted as solid and dotted
lines (Bessell & Brett 1988). The reddening boundary for the hottest stars is
plotted as a
dashed line. We can see that several stars fall to the right of this
line, which would indicate an
color which is affected not only
by extinction, but also a Ks excess due to hot dust. However, most
of these are not extincted
enough to be part of the W49 region, and also fall near the edges of
our images. These could be photometric outliers, or true Ks excess
objects along the line of sight; most probably, the population is a
combination of the two. Only two stars with strong Ks excesses
are likely to be part of the W49A region. Both of these are within
2 pc of the
projected center of Cluster 1. One is faint and appears to have an unresolved
companion at K, suggesting the result could be due to a deblending error.
The other was identified as
star No. 2 by Conti & Blum (2002). This object has an excess of approximately
0.7 mag and thus from its corrected color and magnitude appears to be
a star with a mass of 20-25 .
It is located between the projected
center of Cluster 1 and the ring of ultracompact HII regions. This star is
an obvious candidate for follow-up observations looking for evidence
that the hot dust which surrounds the star is in the shape
of a remnant accretion disk.
![\begin{figure}
\par\includegraphics[width=6.6cm,clip]{0447fig11.eps}
\end{figure}](/articles/aa/full/2005/05/aa0447-04/Timg69.gif) |
Figure 11:
(H-K) Color-magnitude diagram showing the limits for identifying
candidate massive stars. The solid line represents the reddening line for
a
yr
 star (Lejeune & Schaerer 2001),
from AK=0 to AK=5.
The dotted line represents the H-K=1.2 limit described in Sect. 4.1.
star (Lejeune & Schaerer 2001),
from AK=0 to AK=5.
The dotted line represents the H-K=1.2 limit described in Sect. 4.1. |
| Open with DEXTER |
Conti & Blum (2002) detected two UCH II regions in their H and K images,
radio sources "F'' and "J2''. We also detect these sources, and
in Table 1 we list candidate ionizing sources for
the compact and ultracompact
H II regions CC, F, J2, R and Q, S, and W49 South
(names from De Pree et al. 1997).
For regions with multiple detections, we have selected only objects with
inferred
 .
We list inferred masses in Col. 9, and
we note that with the relation we are using, five objects have inferred masses
greater than 120 .
This corresponds to an absolute K magnitude
brighter than -6.2. For the stars
without J magnitudes, they could have infrared excesses which push their
Ks magnitudes above this.
.
We list inferred masses in Col. 9, and
we note that with the relation we are using, five objects have inferred masses
greater than 120 .
This corresponds to an absolute K magnitude
brighter than -6.2. For the stars
without J magnitudes, they could have infrared excesses which push their
Ks magnitudes above this.
This is almost certainly the case for object F. Unpublished
spectra indicate that it has a spectrum marked only by lines of He I at
2.06  m, Br
m, Br  ,
and anomalous features at 2.08 m in
emission and 2.10 in absorption
(P. Conti & P. Crowther, private communication). The important point is
that no photospheric lines are seen. We can put an upper limit of 20
on its J magnitude, for a minimum J-H color of 4.2, and a maximum
Ks excess of
,
and anomalous features at 2.08 m in
emission and 2.10 in absorption
(P. Conti & P. Crowther, private communication). The important point is
that no photospheric lines are seen. We can put an upper limit of 20
on its J magnitude, for a minimum J-H color of 4.2, and a maximum
Ks excess of
 mag.
mag.
One of the objects with inferred M > 120
has J-H and
colors that indicate it does not have a Ks excess. It has an
inferred
absolute K magnitude of -7.14, which is highly overluminous, even for
a multiple of 3 objects. One possibility is that this object is slightly
older than the surrounding stars. The stellar
evolutionary models
for high mass stars predict that a 120
star will enter the
supergiant phase at 1.7 Myr, and brighten by about 1.5 mag in K.
An age spread of 1 Myr would explain this. Another less interesting
possibility
is that the magnitudes are simply off due to difficulty in correctly
characterizing the surrounding nebular emission.
Table 1:
Candidate stars associated with HII regions.
The virial mass of
the W49 molecular cloud,
 ,
puts it among the most
massive in our galaxy (Simon et al. 2001). Our NIR
observations cover the densest regions of this cloud,
over a physical distance of 15 pc. There are "fuzzy'' patches in
our Ks image from nebular emission, and these extend to the
Eastern, Western, and Southern edges of our field, indicating
that we have not fully sampled the star formation activity in
the W49A cloud. There is also a peak in both the molecular gas density
(Simon et al. 2001) and the radio emission (Brogan & Troland 2001) to the
Northeast of our field.
,
puts it among the most
massive in our galaxy (Simon et al. 2001). Our NIR
observations cover the densest regions of this cloud,
over a physical distance of 15 pc. There are "fuzzy'' patches in
our Ks image from nebular emission, and these extend to the
Eastern, Western, and Southern edges of our field, indicating
that we have not fully sampled the star formation activity in
the W49A cloud. There is also a peak in both the molecular gas density
(Simon et al. 2001) and the radio emission (Brogan & Troland 2001) to the
Northeast of our field.
What we have uncovered is a previously undetected
massive stellar cluster (Cluster 1), and stellar sources
associated with UC H II regions. Cluster 1 and the "ring'' of
UC H II regions are separated by only 2 pc in projection,
meaning that this differs
from a "second generation'' as seen in 30 Doradus (Walborn et al. 1999,2002)
and NGC 3603 (Blum et al. 2000; Nürnberger et al. 2002). In the case of W49A,
when the OB stars powering the
UC H II regions emerge, the region encompassing both Cluster 1 and
the Welch ring of UC HII regions
will appear to be the "core'' of the star cluster.
The projected geometry of the
region is highly suggestive of triggering; the "ring'' of UC H II regions
is at the border of the ionized bubble surrounding Cluster 1.
What does the core of Cluster 1 hold? Given the high internal extinction,
we are likely to be incomplete in our near-infrared
census of star formation and therefore a total mass or density estimate.
The core is crowded; high spatial resolution observations are needed to
accurately determine the stellar density in the core. Taken at
face value and without correcting for the large extinction,
the cluster core appears to be
significantly less dense
than the Arches cluster, NGC 3603, or 30 Doradus. If it is truly less dense,
then the different formation environment of
W49A, at a Galactocentric distance of 8 kpc, may be an important
clue for understanding the processes
which drive clustered star formation.
The subclustering phenomenon is useful to describe the
star formation pattern in the W49A molecular cloud.
When the cloud has ceased forming stars, the resulting
stellar group will likely be called a "cluster''. At the
time of current observation, the massive star formation
does not appear to be distributed uniformly throughout the region,
or with a radial dependence relative to a cluster "center''.
Rather it is better described as occurring in "subclusters''.
In this sense we could count 4-5 subclusters within  pc
using the combined NIR and radio
observations: Cluster 1, the (Welch) "ring'' of UC H II regions, W49A South, the RQ complex, and perhaps the CC source.
We speculate that star formation within a subcluster is essentially
synchronized, and a massive star cluster is a collective of
several (or many) subclusters.
pc
using the combined NIR and radio
observations: Cluster 1, the (Welch) "ring'' of UC H II regions, W49A South, the RQ complex, and perhaps the CC source.
We speculate that star formation within a subcluster is essentially
synchronized, and a massive star cluster is a collective of
several (or many) subclusters.
We can make an estimate for the total stellar mass of the W49A star
cluster by counting stars with masses greater than 20
and using a Salpeter slope for the mass function. We take upper and
lower mass limits as 120
and 1 ,
respectively.
For Cluster 1, we
find 54 stars within
,
implying a total mass of
 .
In our entire field, we
count 269 stars with masses
.
In our entire field, we
count 269 stars with masses  ,
implying a
total mass of
,
implying a
total mass of
 .
The stars we
have identified as massive stars are
certainly contaminated by background objects,
but we are also certainly incomplete in our census due to extinction and
angular resolution. The extent to which these effects cancel
each other (or not) is unknown. Even if the stellar
mass estimate for W49A is a factor of 2 too high, W49A is as massive
or more massive than any known young Galactic star cluster. We also note
that it is possible,
perhaps even likely, that we have not
yet detected the most massive young star clusters in the
Milky Way (e.g. Hanson 2003).
.
The stars we
have identified as massive stars are
certainly contaminated by background objects,
but we are also certainly incomplete in our census due to extinction and
angular resolution. The extent to which these effects cancel
each other (or not) is unknown. Even if the stellar
mass estimate for W49A is a factor of 2 too high, W49A is as massive
or more massive than any known young Galactic star cluster. We also note
that it is possible,
perhaps even likely, that we have not
yet detected the most massive young star clusters in the
Milky Way (e.g. Hanson 2003).
It is important to note that this is a lower limit to the
final stellar mass,
as there is circumstantial and direct evidence for ongoing star
formation in this region. There is abundant molecular gas,
and hot cores near the ring of UC H II regions (Wilner et al. 2001; McGrath et al. 2004).
The densest region of the molecular cloud is north of the "ring'' of
UC H II regions, which is completely extincted even in our Ks image.
This is the most likely place for massive stars in earlier stages of
formation than probed with existing observations.
What we observe in W49A is a region with massive stars at various
evolutionary stages, from hot cores to UC H II regions to naked
OB stars, similar to W43 (Blum et al. 1999; Motte et al. 2003) and
the significantly less massive W75N (Shepherd et al. 2003).
We have presented a more comprehensive investigation into our previous
discovery of stellar clusters in the giant radio HII region W49A
(Alves & Homeier 2003).
Our observations clearly show a massive star cluster
adjacent to the UC H II regions (2 pc distant).
This means that the W49A region began forming stars
earlier than previously thought, and that the
UC HII regions which have long been known to radio astronomers
are not the first generation of massive stars.
We use these data to estimate a total stellar mass in this region of
,
and a total mass for Cluster 1 of
 .
Since molecular gas is
abundant, this is a lower limit to the final stellar mass of the cluster.
.
Since molecular gas is
abundant, this is a lower limit to the final stellar mass of the cluster.
With these observations, W49A joins the list of Galactic giant
radio H II regions where two or more phases of
massive star formation coexist. This means that the formation of
massive stars is not completely synchronized, but that there
is some spread in age.
The magnitude of the spread could be investigated with spectra of
the relatively unembedded massive stars and the
lifetime of UC H II regions, although this lifetime is only poorly known.
With the current observations and the
presence of dense molecular gas in the central few pc, a reasonable
guess for the age spread is 1 Myr.
The last point we would like to make is that the subclustering
phenomenon is essential for the description of star formation in
the W49A molecular cloud, at least as traced by the massive stars.
However, there also exists evidence for
subclustering in lower-mass star-forming regions (Lada et al. 1996; Testi et al. 2000),
which is reproduced in star formation simulations (Bonnell et al. 2003).
Possible examples of subclustering in
extragalactic star clusters are: SSC-A in NGC 1569 and NGC 604 in M 33.
SSC-A in NGC 1569 has a
stellar concentration with red supergiants and another with
Wolf-Rayet stars (Gonzalez Delgado et al. 1997; de Marchi et al. 1997; Hunter et al. 2000; Origlia et al. 2001).
The massive stars in NGC 604 are subclustered, but the
region itself is of sufficiently
low density to be termed a Scaled OB Association (SOBA) rather
than a star cluster (Maíz-Apellániz 2001). The applicability of the subclustering
description to other young massive Galactic star clusters remains to be seen,
but we conclude that it is a useful concept for describing and
understanding massive
star formation in the W49 GMC.
Acknowledgements
We would like to thank the anonymous referee for careful readings and comments which improved the
paper. N.H. acknowledges and thanks the European Southern
Observatory (ESO) Studentship Programme which provided support during
the early stages of this work.
We are pleased to acknowledge Miguel Moreira for discussions and
assistance with the observations, Robert Simon for providing molecular
line data on W49's giant molecular cloud, where the clusters are
embedded, and Chris De Pree for providing radio continuum data of the
H II regions associated with W49A.
- Alves, J., & Homeier,
N. 2003, ApJ, 589, L45 [NASA ADS] [CrossRef] (In the text)
- Barbosa, C. L.,
Damineli, A., Blum, R. D., & Conti, P. S. 2003, AJ, 126,
2411 [NASA ADS] [CrossRef] (In the text)
- Bessell, M. S., &
Brett, J. M. 1988, PASP, 100, 1134 [NASA ADS] [CrossRef] (In the text)
- Blum, R. D.,
Damineli, A., & Conti, P. S. 1999, AJ, 117, 1392 [NASA ADS] [CrossRef] (In the text)
- Blum, R. D., Conti,
P. S., & Damineli, A. 2000, AJ, 119, 1860 [NASA ADS] [CrossRef] (In the text)
- Blum, R. D.,
Damineli, A., & Conti, P. S. 2001, AJ, 121, 3149 [NASA ADS] [CrossRef] (In the text)
- Blum, R. D.,
Schaerer, D., Pasquali, A., et al. 2001, AJ, 122, 1875 [NASA ADS] [CrossRef] (In the text)
- Bonnell, I. A., Bate, M.
R., & Vine, S. G. 2003, MNRAS, 343, 413 [NASA ADS] [CrossRef] (In the text)
- Brandl, B.,
Brander, W., Eisenhauer, F., et al. 1999, A&A, 352, 69 [NASA ADS] (In the text)
-
Brandner, W., Grebel, E. K., Chu, Y.-H., et al. 2000, AJ, 119,
292 [NASA ADS] [CrossRef] (In the text)
- Brogan, C. L., &
Troland, T. H. 2001, ApJ, 550, 799 [NASA ADS] [CrossRef] (In the text)
- Cardelli, J. A., Clayton,
G. C., & Mathis, J. S. 1989, ApJ, 345, 245 [NASA ADS] [CrossRef]
- Churchwell,
E. 2002, ARA&A, 40, 27 [NASA ADS]
- Clark, J. S., &
Negueruela, I. 2002, A&A, 396, L25 [EDP Sciences] [NASA ADS] [CrossRef] (In the text)
- Comerón, F.,
Pasquali, A., Rodighiero, G., et al. 2002, A&A, 389, 874 [EDP Sciences] [NASA ADS] [CrossRef] (In the text)
- Conti, P. S., &
Blum, R. D. 2002, ApJ, 564, 827 [NASA ADS] [CrossRef]
- de Marchi, G.,
Clampin, M., Greggio, L., et al. 1997, ApJ, 479, L27 [NASA ADS] [CrossRef] (In the text)
- De Pree, C. G.,
Mehringer, D. M., & Goss, W. M. 1997, ApJ, 482, 307 [NASA ADS] [CrossRef] (In the text)
- De Pree, C. G.,
Wilner, D. J., Goss, W. M., Welch, W. J., & McGrath, E. 2000,
ApJ, 540, 308 [NASA ADS] [CrossRef]
- Drissen, L., Moffat,
A. F. J., Walborn, N. R., & Shara, M. M. 1995, AJ, 110,
2235 [NASA ADS] [CrossRef] (In the text)
- Eisenhauer, F.,
Quillenbach, A., Zinnecker, H., & Genzel, R. 1998, ApJ, 498,
278 [NASA ADS] [CrossRef] (In the text)
- Figer, D. F.,
Najarro, F., Gilmore, D., et al. 2002, ApJ, 581, 258 [NASA ADS] [CrossRef] (In the text)
- Figuerêdo, E.,
Blum, R. D., Damineli, A., & Conti, P. S. 2002, AJ, 124,
2739 [NASA ADS] [CrossRef] (In the text)
- Garay, G., &
Lizano, S. 1999, PASP, 111, 1049 [NASA ADS] [CrossRef]
- Gonzalez Delgado, R.
M., Leitherer, C., Heckman, T., & Cerviño, M. 1997, ApJ,
483, 705 [NASA ADS] [CrossRef] (In the text)
- Gwinn, C. R., Moran,
J. M., & Reid, M. J. 1992, ApJ, 393, 149 [NASA ADS] [CrossRef] (In the text)
- Hanson, M. M. 2003, ApJ, 597,
957 [NASA ADS] [CrossRef] (In the text)
- Homeier, N. L., Blum,
R. D., Conti, P. S., & Damineli, A. 2003, A&A, 397,
585 [EDP Sciences] [NASA ADS] [CrossRef] (In the text)
- Hunter, D. A.,
O'Connell, R. W., Gallagher, J. S., & Smecker-Hane, T. A. 2000,
AJ, 120, 2383 [NASA ADS] [CrossRef] (In the text)
- Johnson, K. E.,
Kobulnicky, H. A., Massey, P., & Conti, P. S. 2001, ApJ, 559,
864 [NASA ADS] [CrossRef] (In the text)
- Johnson, K. E.,
Indebetouw, R., & Pisano, D. J. 2003, AJ, 126, 101 [NASA ADS] [CrossRef]
- Johnson, K. E., &
Kobulnicky, H. A. 2003, ApJ, 597, 923 [NASA ADS] [CrossRef] (In the text)
- Kent, S. M., Dame, T.
M., & Fazio, G. 1991, ApJ, 378, 131 [NASA ADS] [CrossRef] (In the text)
- Kim, K., & Koo, B.
2002, ApJ, 575, 327 [NASA ADS] [CrossRef] (In the text)
- Knödlseder, J. 2000,
A&A, 360, 539 [NASA ADS] (In the text)
- Lada, C. J., Alves, J.,
& Lada, E. A. 1996, AJ, 111, 1964 [NASA ADS] [CrossRef] (In the text)
- Lejeune, T., &
Schaerer, D. 2001, A&A, 366, 538 [EDP Sciences] [NASA ADS] [CrossRef] (In the text)
- Maíz-Apellániz,
J. 2001, ApJ, 563, 151 [NASA ADS] [CrossRef] (In the text)
- Massey, P., & Hunter,
D. A. 1998, ApJ, 493, 180 [NASA ADS] [CrossRef]
- McGrath, E. J., Goss, W.
M., & De Pree, C. G. 2004 ApJS, in press
(In the text)
- Mezger, P. G.,
Schraml, J., & Terzian, Y. 1967, ApJ, 150, 807 [NASA ADS] [CrossRef] (In the text)
- Moffat, A. F. J.,
Drissen, L., & Shara, M. M. 1994, ApJ, 436, 183 [NASA ADS] [CrossRef] (In the text)
- Moffat, A. F. J., et
al. 2002, ApJ, 127, 1014 (In the text)
-
Moorwood, A., Cuby, J. G., & Lidman, C. 1998, The Messenger,
91, 9 (In the text)
- Motte, F., Schilke,
P., & Lis, D. C. 2003, ApJ, 582, 277 [NASA ADS] [CrossRef] (In the text)
- Nürnberger, D. E.
A., & Petr-Gotzens, M. A. 2002, A&A, 382, 537 [EDP Sciences] [NASA ADS] [CrossRef] (In the text)
- Nürnberger, D.
E. A., Bronfman, L., Yorke, H. W., & Zinnecker, H. 2002,
A&A, 394, 253 [EDP Sciences] [NASA ADS] [CrossRef] (In the text)
- Origlia, L.,
Leitherer, C., Aloisi, A., Greggio, L., & Tosi, M. 2001, AJ,
122, 815 [NASA ADS] [CrossRef] (In the text)
- Persson, S. E.,
Murphy, D. C., Krzeminski, W., Roth, M., & Rieke, M. J. 1998,
AJ, 116, 247 [NASA ADS]
- Rathborne, J. M.,
Burton, M. G., Brooks, K. J., et al. 2002, MNRAS, 331, 85 [NASA ADS] [CrossRef] (In the text)
- Rieke, G. H., &
Lebofsky, M. J. 1985, ApJ, 288, 618 [NASA ADS] [CrossRef]
- Serabyn, E., Shupe, D.,
& Figer, D. F. 1998, Nature, 394, 448 [NASA ADS] [CrossRef] (In the text)
- Shaver, P. A., & Goss,
W. M. 1970, AuJPA, 14, 113 [NASA ADS] (In the text)
- Shepherd, D. S.,
Testi, L., & Stark, D. P. 2003, ApJ, 584, 882 [NASA ADS] [CrossRef] (In the text)
- Simon, R., Jackson,
J. M., Clemens, D. P., Bania, T. M., & Heyer, M. H. 2001, ApJ,
551, 747 [NASA ADS] [CrossRef] (In the text)
- Smith, L. F., Mezger,
P. G., & Biermann, P. 1978, A&A, 66, 65 [NASA ADS] (In the text)
- Smith, N., Jackson,
J. M., Kraemer, K. E., et al. 2000, ApJ, 540, 316 [NASA ADS] [CrossRef] (In the text)
- Sparke, L. S., &
Gallagher, J. S. 2000, Galaxies in the universe: an introduction,
ed. L. S. Sparke, & J. S. Gallagher (Cambridge, UK: Cambridge
University Press)
(In the text)
- Sternberg, A., Hoffmann,
T. L., & Pauldrach, A. W. A. 2004, ApJ, in press
- Stolte, A., Grebel,
E. K., Brandner, W., & Figer, D. F. 2002, A&A, 394,
459 [EDP Sciences] [NASA ADS] [CrossRef] (In the text)
- Stolte, A.,
Brandner, W., Brandl, B., Zinnecker, H., & Grebel, E. 2004, AJ,
128, 765 [NASA ADS] [CrossRef] (In the text)
- Sung, H., & Bessell, M.
S. 2004, AJ, 127, 1014 [NASA ADS] [CrossRef] (In the text)
- Testi, L., Sargent,
A. I., Olmi, L., & Onello, J. S. 2000, ApJ, 540, L53 [NASA ADS] [CrossRef] (In the text)
- Vacca, W. D.,
Johnson, K. E., & Conti, P. S. 2002, AJ, 123, 772 [NASA ADS] [CrossRef] (In the text)
- Walborn, N. R. 1995, Rev.
Mex. Astron. Astrofis. Conf. Ser., 2, 51 [NASA ADS] (In the text)
- Walborn, N. R.,
Barbá, R. H., Brandner, W., et al. 1999, AJ, 117, 225 [NASA ADS] [CrossRef] (In the text)
- Walborn, N. R.,
Maíz-Apellániz, J., & Barbá, R. H. 2002, AJ,
124, 1601 [NASA ADS] [CrossRef] (In the text)
- Walmsley, M.
1995, Rev. Mex. Astron. Astrofis. Conf. Ser., 1, 137 [NASA ADS]
- Welch, W. J., Dreher,
J. W., Jackson, J. M., Terebey, S., & Vogel, S. N. 1987,
Science, 238, 1550 [NASA ADS] (In the text)
- Wilner, D. J., De
Pree, C. G., Welch, W. J., & Goss, W. M. 2001, ApJ, 550,
L81 [NASA ADS] [CrossRef] (In the text)
Copyright ESO 2005
![\begin{figure}
\par\includegraphics[width=16.5cm,clip]{0447fig1.eps}
\end{figure}](/articles/aa/full/2005/05/aa0447-04/img17.gif)
![\begin{figure}
\par\includegraphics[width=6.4cm,clip]{0447fig2.eps}
\end{figure}](/articles/aa/full/2005/05/aa0447-04/img34.gif)
![\begin{figure}
\par\includegraphics[width=8cm,clip]{0447fig3.eps}\end{figure}](/articles/aa/full/2005/05/aa0447-04/img39.gif)
![\begin{figure}
\par\includegraphics[width=8cm,clip]{0447fig4.eps}\end{figure}](/articles/aa/full/2005/05/aa0447-04/img40.gif)
![\begin{figure}
\par\includegraphics[width=6.9cm,clip]{0447fig5.eps}
\end{figure}](/articles/aa/full/2005/05/aa0447-04/img41.gif)
![\begin{figure}
\par\includegraphics[width=8cm,clip]{0447fig6.eps}\end{figure}](/articles/aa/full/2005/05/aa0447-04/img46.gif)
![\begin{figure}
\par\includegraphics[width=8cm,clip]{0447fig7.eps}\end{figure}](/articles/aa/full/2005/05/aa0447-04/img47.gif)
![\begin{figure}
\par\includegraphics[width=8cm,clip]{0447fig8.eps}
\end{figure}](/articles/aa/full/2005/05/aa0447-04/img48.gif)
![\begin{figure}
\par\includegraphics[width=8cm,clip]{0447fig9.eps}\end{figure}](/articles/aa/full/2005/05/aa0447-04/img49.gif)
![\begin{figure}
\par\includegraphics[width=16.2cm,clip]{0447fig10.eps}
\end{figure}](/articles/aa/full/2005/05/aa0447-04/img59.gif)
![\begin{figure}
\par\includegraphics[width=6.6cm,clip]{0447fig11.eps}
\end{figure}](/articles/aa/full/2005/05/aa0447-04/img69.gif)