E. Covino1 - A. Frasca2 - J. M. Alcalá1 - R. Paladino3 - M. F. Sterzik4
1 - INAF - Osservatorio Astronomico di Capodimonte,
via Moiariello 16, 80131 Napoli, Italy
2 -
INAF - Osservatorio Astrofisico di Catania, via S. Sofia, 78,
Città Universitaria, 95123 Catania, Italy
3 -
INAF - Osservatorio Astronomico di Cagliari,
Loc. Poggio dei Pini, Strada 54, 09012 Capoterra, Cagliari, Italy
4 -
European Southern Observatory, Casilla 190001, Santiago 19, Chile
Received 27 February 2004 / Accepted 21 July 2004
Abstract
We report new photometric observations and a new determination of the
fundamental stellar parameters for the low-mass pre-main sequence eclipsing
system RX J0529.4+0041A
based on high-precision, near-IR (![]() )
differential photometry obtained
using adaptive optics at the ESO-La Silla 3.6 m telescope, and
)
differential photometry obtained
using adaptive optics at the ESO-La Silla 3.6 m telescope, and
![]() CCD photometry performed with the OIG camera at TNG. The new photometric data, in combination with already published photoelectric photometry and solution of the radial velocity curve, yield a more
precise determination of the absolute dimensions and masses as well as of
other basic physical properties of the components.
CCD photometry performed with the OIG camera at TNG. The new photometric data, in combination with already published photoelectric photometry and solution of the radial velocity curve, yield a more
precise determination of the absolute dimensions and masses as well as of
other basic physical properties of the components.
Key words: stars: pre-main sequence - stars: binaries: eclipsing - stars: binaries: spectroscopic - stars: fundamental parameters - stars: individual: RX J0529.4+0041 - stars: binaries: close
The location of young stars on the H-R diagram is commonly used to infer their masses and ages from the comparison with computed pre-main sequence (PMS) evolutionary tracks and isochrones. In spite of the considerable amount of theoretical work devoted in the last two decades to the development of PMS evolutionary models, the currently available evolutionary tracks from different authors yield somewhat different predictions, in terms of mass and age, especially in the solar and lower mass stars regime (see for example Baraffe et al. 2002). This is mainly because the models still suffer from severe uncertainties both in the input physics and in the treatment of the complex phenomena accompanying the early evolutionary phases of a star (for example, the burning of light elements and the treatment of convection during the Hayashi phase), which are determinant factors for the calculation of the observable properties of a star (e.g. effective temperature and luminosity). These uncertainties heavily affect the estimations of stellar masses and ages, and have strong consequences for the derivation of the initial mass function (IMF), and for reconstructing the star formation history of a given region, in particular in the low- and very low-mass regimes. Thus, the comparison of fundamental stellar parameters derived directly from observations with the predictions from evolutionary model calculations provides a crucial test in order to discriminate among different models as well as to provide a "mass calibration'' for the available sets of PMS tracks.
Unfortunately, from the observational side, the lack of direct information on fundamental stellar parameters for low-mass PMS stars of different masses and ages still prevents such a test from being realised and does not yet allow one to constrain the models. The situation is still unsatisfactory even for the low main sequence, since eclipsing systems with low-mass components are extremely rare, mainly because of observational limitations. The very few determinations of stellar parameters available to date indicate that the current models tend to underestimate the radius (by up to 20%) and to overestimate the effective temperature (by about 150 K), whereas ages might be overestimated by up to a factor 10 (Torres & Ribas 2002).
The study of binary systems, through the measurement of the dynamical mass of two gravitationally bound components orbiting each other, represents the only way to test theoretical evolutionary models and to provide the absolute mass calibration for PMS tracks in the H-R diagram, as well as a relative age calibration for the theoretical isochrones. Indeed, the component stars in relatively short-period systems most likely originated from a common star formation event, and they should hence be coeval. Thus, they are expected to "trace'' an observational isochrone. Among all kinds of binary stars, spectroscopic and eclipsing systems offer the best means to test theoretical evolutionary tracks, as they allow, through the combined analysis of radial velocities and photometric curves, the determination of all stellar fundamental parameters of the components in one step (Andersen 1991). However, until now, this possibility has been hampered by the extreme rarity of eclipsing systems and the difficulty of finding them among PMS stars. A more extended, systematic search would require relatively large amounts of dedicated time on small/intermediate size (1 m class) telescopes (unfortunately a dying species), in order to intensively monitor large numbers of objects in nearby star formation regions.
While many spectroscopic binaries with main-sequence components, in the field and in open clusters, have been studied and their orbital elements have been derived, so that the circularization time is determined for the population of binaries belonging to young clusters and for the two older binary populations of M 67 and of the Galactic Halo, for the PMS binaries Mathieu (1994) counted only 25 systems with known orbital elements. These numbers have been increasing in recent years thanks to the discovery of many weak-T Tauri stars (WTTS) as optical counterparts of X-ray sources (mainly in the ROSAT All-Sky Survey) in the nearby star-forming regions. The preliminary results of on-going spectroscopic monitoring surveys on these stars (Alcalà et al. 2002; Covino et al. 2001; Melo et al. 2001) have revealed that many of them are indeed spectroscopic binaries. Among these we discovered the first eclipsing binary composed of two low-mass stars, RX J0529.4+0041 (Covino et al. 2000).
In this paper we determine anew the fundamental stellar parameters for the
two low-mass components of the PMS eclipsing binary system RX J0529.4+0041A,
based on near-infrared (![]() )
and
)
and
![]() CCD photometry.
CCD photometry.
Although unfavorable weather conditions at TNG prevented us from achieving a good
coverage of the eclipse phases in the optical bands, these data proved
to be quite useful to constrain the physical parameters of the binary components
(e.g.
![]() and radii) as they, in combination with the infrared photometry,
allowed us a "multiwavelength'' approach to the light-curve solution.
and radii) as they, in combination with the infrared photometry,
allowed us a "multiwavelength'' approach to the light-curve solution.
Sequences of high-angular resolution images of RX J0529.4+0041 were obtained in
the near-infrared J, H and K bands using the ADaptive Optics Near Infrared System
(ADONIS), mounted at the ESO 3.6 m telescope at La Silla Observatory (Chile),
equipped with the System for High Angular Resolution Pictures (SHARP) II near
infrared (NIR) imaging camera with a NICMOS III array.
A plate scale of 0.050 arcsec/pixel, yielding a camera field-of-view of 12
![]() 8
8 ![]() 12
12
![]() 8, was used (see Beuzit et al. 1997; and Hofmann
et al. 1995, for more details).
8, was used (see Beuzit et al. 1997; and Hofmann
et al. 1995, for more details).
The orbital period, of nearly exactly 3 days, and the short duration of the eclipses (less than 6 h), determined by previous photoelectric photometry in the B and V bands (Covino et al. 2000), posed quite strong constraints on the observation scheduling. The observations were thus planned on two separate nights, December 6th 2000 and January 12th 2001, in which, based on the ephemerides available to us (Covino et al. 2001), the primary and secondary minima were expected to occur in the middle of the night, under the most favorable observability conditions for La Silla. The observations were successfully carried out, and both the primary and secondary eclipses could be entirely monitored. Additional observations using the same instrumental set-up were ensured on three consecutive nights in 2001, from December 6th to 8th, with the aim to check the stability of the light-curve with time as well as to gather at least a partial coverage at different out-of-eclipse phases. This was in fact the last opportunity to gather additional data using the same instrument, as ADONIS was decommissioned after ESO Period 69.
The main advantage of using an AO system is that it provides diffraction
limited resolution in the core of the Point Spread Function (PSF)
(i.e.
![]() in the K-band).
This allowed us to fully resolve, in each of the J, H, and K bands, the
two visual components of RX J0529.4+0041, at about 1
in the K-band).
This allowed us to fully resolve, in each of the J, H, and K bands, the
two visual components of RX J0529.4+0041, at about 1
![]() 3 separation.
Since our targets are relatively bright they were used as reference stars
for wavefront sensing.
Overheads for the AO system and NIR camera setting were of the order of a few minutes.
In order not to lose time resolution, we chose:
1) not to optimize the AO system performance when switching to the next filter
and the result of this choice was a lower resolution in the J and H bands;
2) to spend the minimum time in adjusting the individual integration time, although
the PSF peak intensity may vary by more than 10% between consecutive frames.
3 separation.
Since our targets are relatively bright they were used as reference stars
for wavefront sensing.
Overheads for the AO system and NIR camera setting were of the order of a few minutes.
In order not to lose time resolution, we chose:
1) not to optimize the AO system performance when switching to the next filter
and the result of this choice was a lower resolution in the J and H bands;
2) to spend the minimum time in adjusting the individual integration time, although
the PSF peak intensity may vary by more than 10% between consecutive frames.
The integration times were set to 30 s in J and 20 s in H and K filters
for all exposures of the target.
Near-IR photometric standard stars taken from the ARNICA Catalogue
(Hunt et al. 1998) were observed at the beginning and end of the night, under
similar sky transparency conditions, to obtain absolute ![]() photometry.
As measured by the La Silla Differential Image Motion Monitor (DIMM),
the atmospheric seeing during our run varied with time, ranging from 0
photometry.
As measured by the La Silla Differential Image Motion Monitor (DIMM),
the atmospheric seeing during our run varied with time, ranging from 0
![]() 8 to 1
8 to 1
![]() 2.
2.
Unfortunately, the measurements of time turned out not to be as accurate as we would have expected. Time was not registered in the FITS header of each ADONIS frame, but could only be inferred from the UT "hour'' and "minute'' of the computer clock which was recorded, without any rounding-off of the seconds, in the corresponding file-name. This implied a possible inaccuracy of up to 1 min on the time-axis which, at the phases where the light variation is faster, may affect the data by an amount comparable to the photometric uncertainty.
For the reduction of the ADONIS images we used our own procedures based on the ESO/Eclipse (Vers. 3.4) data reduction routines (Devillard 1997), running under Unix. The background emission was computed for every pixel as a median value of the stack of frames. For each exposure the following reduction steps were applied: i) subtraction of background sky emission; ii) division by flat-field; iii) correction for bad pixels by applying a bad-pixel map; and iv) "shift-and-add'' method to yield the final images.
As expected, the new, extremely sharp, ADONIS images of RX J0529.4+0041 allowed
us to fully resolve the eclipsing system from its visual companion and to
separately measure each of them by aperture photometry (see Fig. 1),
The photometric measurement of the stars in the ADONIS field was performed by using
a semi-authomatic IDL procedure, specifically written by us for this task, which
calls the IDL APER routine adapted from DAOPHOT.
Moreover, taking advantage of the fact that the two visual components, thanks
to their relatively large separation (
![]()
![]()
![]() ), appeared
fully resolved on all of the ADONIS images, we could also use the companion as a
comparison star to measure the relative light variations of the eclipsing system
in the J, H and K bands.
Indeed, the differential photometry proved to reduce significantly the scatter
in the resulting light-curves with respect to absolute measurements, but, of
course, we wanted first to probe the stability of the companion on different
nights. Absolute photometry was thus used to check the visual companion for possible
varability, indicating that this star was fairly stable (within about 1%) on
the different nights of the run. This indication received further confirmation after the excellent match obtained in the differential light-curve between the two secondary minima observed by us
almost one year apart.
), appeared
fully resolved on all of the ADONIS images, we could also use the companion as a
comparison star to measure the relative light variations of the eclipsing system
in the J, H and K bands.
Indeed, the differential photometry proved to reduce significantly the scatter
in the resulting light-curves with respect to absolute measurements, but, of
course, we wanted first to probe the stability of the companion on different
nights. Absolute photometry was thus used to check the visual companion for possible
varability, indicating that this star was fairly stable (within about 1%) on
the different nights of the run. This indication received further confirmation after the excellent match obtained in the differential light-curve between the two secondary minima observed by us
almost one year apart.
![\begin{figure}
\par\includegraphics[width=8.65cm,clip]{0348fig1.ps}\end{figure}](/articles/aa/full/2004/44/aa0348-04/img17.gif) |
Figure 1: ADONIS images of the eclipsing PMS binary RX J0529.4+0041A (upper-right star) and its companion in the J, H, and K bands. North is down, East to the left. The three upper images show the eclipsing system at maximum brightness, whereas the lower ones are close to the primary minimum. In the upper and lower middle frames the apertures used for measuring each component and the corresponding sky are also drawn. |
| Open with DEXTER | |
In order to properly take into account the mutual light contamination of the two stars the sky background was measured at diametrically opposite positions with respect to each component, as shown in the central panels of Fig. 1.
Table 1:
![]() differential photometry of the eclipsing component
RXJ 0529.4+0041 A with respect to component B, with running
Heliocentric Julian Day (-2, 400, 000). The corresponding orbital phase
is computed using the new ephemeris given in Sect. 4.1
(only in electronic form).
differential photometry of the eclipsing component
RXJ 0529.4+0041 A with respect to component B, with running
Heliocentric Julian Day (-2, 400, 000). The corresponding orbital phase
is computed using the new ephemeris given in Sect. 4.1
(only in electronic form).
In order to derive the best quality light-curves from our data for the subsequent analysis, differential photometry in the J, H, and K bands of RX J0529.4+0041A with respect to the visual companion used as a comparison star was obtained. Estimated errors of the differential measurements are of the order of 0.005 mag or lower.
Table 2: Absolute photometry for the visual components, A (eclipsing binary) and B (companion), of RXJ 0529.4+0041. All magnitudes involving component A refer to out-of-eclipse phases, thus providing the mean maximum-light level.
In Table 1 we report the differential J, H, and K magnitudes of RX J0529.4+0041A with respect to the visual companion versus the Heliocentric Julian Day.
Taking advantage of the prolonged observation of the target field during large part
of the night, and spanning a wide range of air mass,
atmospheric extinction coefficients in the J, H and K bands were determined,
for each night, from the measurements of the visual companion, RX J0529.4+0041B,
instead of adopting the (somewhat lower) mean values for La Silla.
Zero Points to convert the instrumental magnitudes to absolute photometry were determined
from the ![]() standard stars observed at the beginning, middle, and end of the night.
Our Zero Point determinations, obtained by measuring the standard stars through an
aperture of 60 pixels radius, were found to be in excellent agreement with the values
provided under the ESO-La Silla Web site
standard stars observed at the beginning, middle, and end of the night.
Our Zero Point determinations, obtained by measuring the standard stars through an
aperture of 60 pixels radius, were found to be in excellent agreement with the values
provided under the ESO-La Silla Web site![]() .
.
Mean ![]() magnitudes for the visual components of RX J0529.4+0041 are reported
in Table 2. The values for component A correspond to maximum brightness (out-of-eclipse phases).
magnitudes for the visual components of RX J0529.4+0041 are reported
in Table 2. The values for component A correspond to maximum brightness (out-of-eclipse phases).
CCD photometry in the
![]() bands (R and I in the Cousins photometric
system) was obtained on the two nights, 2000 November 19th and 2001 January 5th,
using the Optical Imager of Galileo (OIG) at the Galileo National Telescope
(TNG) at La Palma (Canarias islands, Spain), operated in service mode.
Although in changeable weather conditions, and affected by interruptions due
to technical reasons, some useful data could be obtained on November 19th, which
cover the rise from the primary minimum, while on January 5th the observation of the
secondary minimum was completely hampered by bad weather conditions.
Data reduction was performed using IRAF
bands (R and I in the Cousins photometric
system) was obtained on the two nights, 2000 November 19th and 2001 January 5th,
using the Optical Imager of Galileo (OIG) at the Galileo National Telescope
(TNG) at La Palma (Canarias islands, Spain), operated in service mode.
Although in changeable weather conditions, and affected by interruptions due
to technical reasons, some useful data could be obtained on November 19th, which
cover the rise from the primary minimum, while on January 5th the observation of the
secondary minimum was completely hampered by bad weather conditions.
Data reduction was performed using IRAF![]() .
.
Absolute
![]() mean magnitudes (in the Johnson-Cousins photometric system)
of RX J0529.4+0041 at maximum light are reported in Table 2, and
are derived from already available calibrated
mean magnitudes (in the Johnson-Cousins photometric system)
of RX J0529.4+0041 at maximum light are reported in Table 2, and
are derived from already available calibrated ![]() photoelectric photometry
obtained, during out-of-eclipse phases, at Catania Observatory (Covino et al.
2000) under photometric sky conditions, combined with OIG
photoelectric photometry
obtained, during out-of-eclipse phases, at Catania Observatory (Covino et al.
2000) under photometric sky conditions, combined with OIG
![]() data.
data.
During most of the OIG observations the two visual components were not
resolved, however, on some of the images obtained at maximum light the
seeing was below 1.0 arcsec, allowing us to resolve the two components and
measure their magnitude difference in the
![]() bands, in an analogous
way as for
bands, in an analogous
way as for ![]() .
The photometry of the two optically resolved A and B components is reported
in Table 2, and the measurements of component A correspond
to maximum light. We could hence also obtain the differential
.
The photometry of the two optically resolved A and B components is reported
in Table 2, and the measurements of component A correspond
to maximum light. We could hence also obtain the differential ![]() magnitudes of component A
with respect to component B, from their combined magnitudes, using the photometry
reported in Table 2 for the resolved, A and B components, and the
procedure described in the Appendix to correct for the third-light.
magnitudes of component A
with respect to component B, from their combined magnitudes, using the photometry
reported in Table 2 for the resolved, A and B components, and the
procedure described in the Appendix to correct for the third-light.
Our study makes use of distinct but complementary sets of information. These involve the results of the analysis of radial velocity curve reported in Table 3, light-curve, and spectral energy distribution (SED). The combined results provide a complete description of the gross physical properties of the system and a precise measurement of its distance.
Table 3: Orbital elements and stellar parameters of RXJ 0529.4+0041A from the spectroscopic orbits. The Epoch T0 refers to the time of maximum velocity of the primary.
We exploit our already published results (radial velocity curves and spectral type determinations) from high-resolution spectroscopy (Covino et al. 2001) as well as new absolute multi-band photometry. Indeed the solution of the spectroscopic orbits yields the minimum absolute size of the system and individual minimum masses, which depend on the inclination of the orbital plane. On the other hand, the light-curve solution constrains the relative sizes and temperature ratio of the components, while the absolute value of the effective temperature for at least one of the components need to be determined by means of some calibration external to the light-curves.
The solution of the radial velocity curves reported by Covino et al. (2001)
provided a precise determination of the mass ratio and individual masses
(apart from the factor ![]() )
of the eclipsing components.
The latter, combined with the orbital inclination obtained from the
light-curve solution, convert into absolute masses.
)
of the eclipsing components.
The latter, combined with the orbital inclination obtained from the
light-curve solution, convert into absolute masses.
The spectral types of the components, yielding information on the effective temperatures of the stars, provide very important constraints on the input parameters for the analysis of the light curves of eclipsing binary systems. In particular it is critical, in order to achieve a reliable evaluation of the effective temperature of the Secondary from the light-curve analysis, to rely on a good determination of the spectral type of the Primary component so that its effective temperature can be adopted as a fixed input parameter. To this purpose, we adopt the revised spectral types derived by Covino et al. (2001) through a matching of the binary spectrum with that of a synthetic binary. Details on the application of the spectral subtraction technique and on the radial and rotational velocities determination are given in Covino et al. (2000, 2001).
The spectral type of K1 ![]() spectral subclass restricts the allowed
spectral subclass restricts the allowed
![]() for the Primary component to the range 5000-5300 K.
The value of 5025 K, derived from the de Jager & Nieuwenhuijzen (1987)
calibration, was originally adopted for the B and V light-curve
solution in Covino et al. (2000).
A spectral classification of K7-M 0 for the secondary component was derived
from spectral synthesis of composite binary spectra in Covino et al. (2001).
for the Primary component to the range 5000-5300 K.
The value of 5025 K, derived from the de Jager & Nieuwenhuijzen (1987)
calibration, was originally adopted for the B and V light-curve
solution in Covino et al. (2000).
A spectral classification of K7-M 0 for the secondary component was derived
from spectral synthesis of composite binary spectra in Covino et al. (2001).
Additional constraints on the effective temperature of the primary component
can be obtained from the observed colours at the secondary minimum,
when the light contribution from the secondary, although not totally eclipsed,
becaoms drastically reduced (by as much as nearly 90%).
Thus, the colour information can actually help to set a lower limit to the
effective temperature of the primary.
The best suited appear to be the B-V and V-K colours, in combination
with colour-to-effective temperature calibrations.
Using the B-V colour has the advantage that B and V data are simultaneous and the
contributions from the secondary and tertiary components are relatively less important.
The third-light corrected magnitudes V=12.61 and B=13.54 (from Table 2), become,
at the secondary minimum, 12.77 and 13.67, respectively, giving B-V= 0.90.
This, adopting a value of E(B-V)= 0.10 mag, for the distance of 325 pc, yields
B-V=0.80, which would correspond to
![]() ,
adopting the Alonso et al.
(1996) calibration, or to
,
adopting the Alonso et al.
(1996) calibration, or to
![]() ,
using the one from
Flower (1996).
A (V-K)0 value of 2.05 at the secondary minimum is obtained from the measured
K magnitude at phase 0.5, and the combined V magnitude corrected for the third light
at the same phase, adopting AV=0.325 and AK=0.040 for the interstellar
extinction. This yields
,
using the one from
Flower (1996).
A (V-K)0 value of 2.05 at the secondary minimum is obtained from the measured
K magnitude at phase 0.5, and the combined V magnitude corrected for the third light
at the same phase, adopting AV=0.325 and AK=0.040 for the interstellar
extinction. This yields
![]() ,
using Alonso et al. calibration.
,
using Alonso et al. calibration.
![\begin{figure}
\par\includegraphics[width=8.5cm,clip]{0348fig2.ps}\end{figure}](/articles/aa/full/2004/44/aa0348-04/img31.gif) |
Figure 2: Example of the bisector method used to determine the time of a minimum. The vertical solid line represents the bisector for primary eclipse data in the H band, whereas the dashed line shows the bisector on a ten times expanded scale. |
| Open with DEXTER | |
![\begin{figure}
\par\includegraphics[width=8.6cm,clip]{0348fig3.ps} \end{figure}](/articles/aa/full/2004/44/aa0348-04/img32.gif) |
Figure 3: Observed minus calculated times of minima for the eclipsing system RX J0529.4+0041A. Primary and secondary minima are represented with filled and open circles respectively. The orbital period appears to be constant within the errors. |
| Open with DEXTER | |
The orbital period has been re-determined from the times of the observed photometric minima.
In order to reduce the uncertainties on the mid-eclipse epochs due to the
measurement errors, the time of each minimum was obtained applying the bisector
method to the well observed minima (including both descending and rising branches),
as illustrated in Fig. 2, where the jitter in the eclipse
bisector induced by the photometric noise is clearly visible.
The standard deviation of the mid-eclipse epochs is in the range from
about 50 to 150 s, depending on the data S/N and on the sampling rate.
In Fig. 3 we plot the difference between the observed epochs of
primary (filled circles) and secondary minima (open circles) and those obtained
from the ephemeris of constant period which gives the best match to the data:
The O-C diagram reported in Fig. 3 shows that a constant period ephemeris is able to reproduce the observed epoch of minima within the errors, with all O-C residuals scattered around zero, although it might also contain a hint for an increasing period which needs additional data to be confirmed.
We used the differential photometry of compenent A relative to component B
obtained in each band, following the usual approach to eclipsing binary
light-curve modelling (see Wilson 1994, for a comprehensive
review on the subject).
The solution of the three near-infrared light-curves in the J, H, and K bands was performed using the program Nightfall, written by R. Wichmann![]() ,
based on Roche geometry. The fit to the observed light-curves was obtained
using the option of the program which evaluates the flux contribution of the
two components in the observed bands by means of model atmospheres.
Although the system is clearly well detached
(as indicated by the sharpness of the eclipses), reflection and proximity
effects were also considered using the algorithm described in
Djurasevic (1992).
,
based on Roche geometry. The fit to the observed light-curves was obtained
using the option of the program which evaluates the flux contribution of the
two components in the observed bands by means of model atmospheres.
Although the system is clearly well detached
(as indicated by the sharpness of the eclipses), reflection and proximity
effects were also considered using the algorithm described in
Djurasevic (1992).
The best-fit solution to the observed light-curves was found under the following assumptions and using the following program options:
Actually, Nightfall uses as a measurement of the size of the stars the filling factor of each component, RocheFill, defined as the ratio between the polar radius of the star and the polar radius of its Roche lobe. Allowed values for RocheFill are in the range 0.001-1.3 (values above 1.0, indicate stars merging into a common-envelope/overcontact system). Initial values of the fit parameters were taken from the previous, combined radial-velocity and light-curve solution (Covino et al. 2001). Additionally, several trials were also performed running Nightfall with different starting values for the parameters to make realistic estimates of the uncertainties and to test the uniqueness of the solution.
While the depths of the eclipses in different bands constrain the ratio of
the stellar temperatures, in order to establish the absolute
temperature scale, the temperature of the primary component needs to be
evaluated independently from color and/or spectral type informations.
However, even with precise masses, the test of PMS tracks might be
invalidated because of uncertainties on the effective temperatures of the
two components.
Thus, the light-curve solution was also performed adopting for the
primary component extreme values for its plausible temperature range,
compatible with its spectral type of K0-K1, and depending on different
temperature scale calibrations, e.g. 4950-5300 K
(Houdashelt et al. 2000; Cox 2000; Gray 1992; de Jager & Nieuwenhuijzen 1987).
This test showed that the effect of varing the temperature of the primary
component by ![]() 100 K, produces a change in the resulting temperature of
the secondary of nearly the same amount
whereas it does not affect significantly the other parameters (e.g., the
orbital inclination and the stellar radii).
Therefore, the uncertainty on the temperature of the Secondary should not be
significantly larger than that quoted for the Primary component.
100 K, produces a change in the resulting temperature of
the secondary of nearly the same amount
whereas it does not affect significantly the other parameters (e.g., the
orbital inclination and the stellar radii).
Therefore, the uncertainty on the temperature of the Secondary should not be
significantly larger than that quoted for the Primary component.
In principle, only the analysis of several, fully covered light-curves in different photometric bands, obtained at various epochs, can help to average out both measurement errors and intrinsic variations (as due, for example, to changing distributions of spots) in order to achieve a reliable determination of the parameters. Therefore, with the aim to check the long-term stability of the light-curve, the observation of the secondary eclipse was repeated in a second epoch, about eleven months later. As seen from Fig. 6 these two secondary minima overlap perfectly when folded in phase with the ephemeris given in Eq. (1). Thus, although more observations would be obviously desired, we can suppose rather confidently that the light-curve was stable over the time span of our observations.
![\begin{figure}
\par\includegraphics[width=7.2cm,clip]{0348fig4.ps}\end{figure}](/articles/aa/full/2004/44/aa0348-04/img40.gif) |
Figure 4:
|
| Open with DEXTER | |
![\begin{figure}
\par\includegraphics[width=7.2cm,clip]{0348fig5.ps}\end{figure}](/articles/aa/full/2004/44/aa0348-04/img41.gif) |
Figure 5:
Normalized |
| Open with DEXTER | |
As the
![]() photometry of RX J0529.4 +0041A incorporates the light
from the close visual companion, whereas the
photometry of RX J0529.4 +0041A incorporates the light
from the close visual companion, whereas the ![]() bands does not,
before any attempt to perform a simultaneous light-curve solution of the
optical and near-IR data, the former data need to be corrected for the
contribution from the third light.
bands does not,
before any attempt to perform a simultaneous light-curve solution of the
optical and near-IR data, the former data need to be corrected for the
contribution from the third light.
The first light-curve solution was thus performed on the ![]() data and,
initially, also the presence of stellar spots on either of the eclipsing
components was not considered.
However, the computed light-curves are unable to provide a really satisfactory
match to the observational data, as they cannot reproduce the variation of the
out-of-eclipse level, suggesting the likely presence of large photospheric spots
on at least one of these late-type components.
In particular, the computed light-curves do not reproduce the exact depths
of the eclipses because of the notably different out-of-eclipse levels
around the primary and secondary minima, apparent in the J, H, and K
as well as in the more complete B and V light-curves (Covino et al. 2000).
Thus, in order to achieve a more reliable fit, the out-of-eclipse variation
needs to be taken into account.
data and,
initially, also the presence of stellar spots on either of the eclipsing
components was not considered.
However, the computed light-curves are unable to provide a really satisfactory
match to the observational data, as they cannot reproduce the variation of the
out-of-eclipse level, suggesting the likely presence of large photospheric spots
on at least one of these late-type components.
In particular, the computed light-curves do not reproduce the exact depths
of the eclipses because of the notably different out-of-eclipse levels
around the primary and secondary minima, apparent in the J, H, and K
as well as in the more complete B and V light-curves (Covino et al. 2000).
Thus, in order to achieve a more reliable fit, the out-of-eclipse variation
needs to be taken into account.
The presence of photospheric spots is to alter the out-of eclipse level, and hence
the relative depth and the duration of the minima. Therefore, if not properly
accounted for, this can cause systematic effects, in particular on relative
temperature and radii of the components.
However, as the information contained in the light-curve is insufficient
to establish the exact location of spots on eather component, we explored this
scenario by running several light-curves solutions with inclusion of up to two
cool spots on the surface of each component.
In order to achieve a satisfactory fit to the data, at least two, diametrically
opposed spots on the hotter component are needed.
The first solution obtained from ![]() ignoring the presence of spots yielded
a radius for the primary about 15% bigger than a solution in which stellar spots
are included.
Figure 4 shows the light-curve fit obtained with two circular spots
located on the primary component: the first, at longitude 0
ignoring the presence of spots yielded
a radius for the primary about 15% bigger than a solution in which stellar spots
are included.
Figure 4 shows the light-curve fit obtained with two circular spots
located on the primary component: the first, at longitude 0![]() and latitude -25
and latitude -25![]() ,
with 20
,
with 20![]() radius and temperature of 3120 K, the second,
at longitude 180
radius and temperature of 3120 K, the second,
at longitude 180![]() and latidute 42
and latidute 42![]() ,
with 14
,
with 14![]() radius
and temperature 4370 K, respectively. The latitude, spot radius, and dimming factor (i.e., the ratio of the local temperatures with and without spot) of the spots were let as free parameters, whereas the latitude was kept fixed.
radius
and temperature 4370 K, respectively. The latitude, spot radius, and dimming factor (i.e., the ratio of the local temperatures with and without spot) of the spots were let as free parameters, whereas the latitude was kept fixed.
![\begin{figure}
\par\includegraphics[width=7.4cm,clip]{0348fig6.ps}\end{figure}](/articles/aa/full/2004/44/aa0348-04/img42.gif) |
Figure 6: Best-fit, simultaneous solution of the differential B, V, J, H, and K light-curves of RX J0529.4+0041A with respect to the visual companion, used as a comparison star. B and V differential magnitudes have been corrected for the third light contribution, following the method exposed in the Appendix. Light symbols represent the photoelectric data obtained at Serra La Nave (Covino et al. 2000), black dots indicate the CCD data from TNG. |
| Open with DEXTER | |
![\begin{figure}
\par\includegraphics[width=8.8cm,clip]{0348fig7.ps}\end{figure}](/articles/aa/full/2004/44/aa0348-04/img43.gif) |
Figure 7:
|
| Open with DEXTER | |
Table 4:
Best-fit parameters from model solutions of the ![]() light-curves with 2 spots on the primary component and
light-curves with 2 spots on the primary component and
![]() (rectified) light-curves, corresponding to an effective temperature of the Primary component of 5200 K. The quoted uncertainties are formal mean standard errors to the solution.
(rectified) light-curves, corresponding to an effective temperature of the Primary component of 5200 K. The quoted uncertainties are formal mean standard errors to the solution.
Table 5: Adopted stellar physical parameters for the eclipsing components of RXJ 0529.4+0041A.
In order to exploit the full potential of the wide wavelength range (from optical
to near-IR) covered by our data, we finally performed the simultaneous solution
for the whole set of
B, V, J, H, and K light-curves, after correcting the B
and V data for the contribution from the third light.
We obtained the differential ![]() magnitudes corrected for the third-light,
using the photometry reported in Table 2 for the resolved, A and B components, following the procedure described in the Appendix.
magnitudes corrected for the third-light,
using the photometry reported in Table 2 for the resolved, A and B components, following the procedure described in the Appendix.
Figure 5 shows the comparison of the OIG data, before and after correction
for the third-light, with the synthetic light-curves calculated from a solution of
the ![]() light-curves only. The net effect of the correction is to change the relative depths of the eclipses, as also clearly seen from the figure.
light-curves only. The net effect of the correction is to change the relative depths of the eclipses, as also clearly seen from the figure.
After this test, the correction for the third light was hence applied to all the other available optical data, using the direct measurents of component B in the corresponding bands, reported in Table 2.
Notice that we did not include the U, R, I light-curves in the final analysis
because of the lack of photometric coverage.
Also, due to lack of simultaneity of the optical and near-IR observations and
to incomplete phase coverage of the ![]() data, the only meaningful way to
perfom a combined solution of the five bands simultaneously was to proceed with
the rectification of the out-of eclipse level in the light-curves
(Wilson 1994).
This was achieved by removing from each light-curve the wave-like distortion
ascribable to photospheric spots.
data, the only meaningful way to
perfom a combined solution of the five bands simultaneously was to proceed with
the rectification of the out-of eclipse level in the light-curves
(Wilson 1994).
This was achieved by removing from each light-curve the wave-like distortion
ascribable to photospheric spots.
In this final analysis we also solved for the following light-curve parameters:
the orbital inclination, the temperature of the secondary, and the radii of the
two stars.
The resulting stellar parameters are reported in Table 4,
together with their corresponding formal mean standard errors.
![]() -square maps, produced with Nightfall for different pairs of
parameters around the best-fit solution, are shown in Fig. 7.
For comparison purposes, Table 4 also gives the corresponding
results of the fit to the
-square maps, produced with Nightfall for different pairs of
parameters around the best-fit solution, are shown in Fig. 7.
For comparison purposes, Table 4 also gives the corresponding
results of the fit to the ![]() light-curves with two spots on the primary component
from Sect. 4.2.1.
For same temperature of the Primary, the solution with spots yielded larger radii
for both the primary and secondary component, 1.58 and 1.49
light-curves with two spots on the primary component
from Sect. 4.2.1.
For same temperature of the Primary, the solution with spots yielded larger radii
for both the primary and secondary component, 1.58 and 1.49 ![]() ,
respectively,
and an effective temperature of the Secondary about 120 K cooler.
,
respectively,
and an effective temperature of the Secondary about 120 K cooler.
Changing the temperature of the primary component from 5000 to 5300 K to
account for uncertainties in its spectral type (![]() 1 subclass)
as well as to allow for possible systematic differences introduced by the
adoption of a given temperature scale calibration, the temperature of the
Secondary passes from nearly 4000 to about 4300 K, whereas the other free
parameters remain practically unchanged (e.g. the orbital inclination varies
from 86.37 to 86.53, and the radii of the primary and secondary components
vary from 1.39 to 1.44
1 subclass)
as well as to allow for possible systematic differences introduced by the
adoption of a given temperature scale calibration, the temperature of the
Secondary passes from nearly 4000 to about 4300 K, whereas the other free
parameters remain practically unchanged (e.g. the orbital inclination varies
from 86.37 to 86.53, and the radii of the primary and secondary components
vary from 1.39 to 1.44 ![]() and, respectively, from 1.41 to 1.35
and, respectively, from 1.41 to 1.35 ![]() ).
Thus, assuming those extreme values for the temperature of the Primary,
the derived temperature for the Secondary also changes by nearly 300 K.
Thus, the uncertainty on the temperature of the Secondary is essentially
dominated by the uncertainty on the temperature of the Primary.
The best among the best-fit solutions is found adopting an effective temperature
for the Primary of 5200 K. This result turns out to be in line with the analysis
of the spectral energy distribution reported in Sect. 5.
).
Thus, assuming those extreme values for the temperature of the Primary,
the derived temperature for the Secondary also changes by nearly 300 K.
Thus, the uncertainty on the temperature of the Secondary is essentially
dominated by the uncertainty on the temperature of the Primary.
The best among the best-fit solutions is found adopting an effective temperature
for the Primary of 5200 K. This result turns out to be in line with the analysis
of the spectral energy distribution reported in Sect. 5.
The final stellar physical parameters adopted from the light-curve analysis are listed in Table 5. The uncertainties quoted in this table were adopted not from the formal probable errors on the solution but rather performing additional trial solutions to account for the uncertainties on the adopted input parameters.
Several sets of starting parameters were tried in order to fully explore the
parameter space around the best-fit solution.
The scatter in the resulting parameters from numerous additional solutions
yields the estimated uncertainties that are generally several times larger
than the internal statistical errors and we consider to be more realistic.
For illustrative purposes, ![]() -square maps for different pairs of parameters
around the best-fit solution are shown in Fig. 7.
-square maps for different pairs of parameters
around the best-fit solution are shown in Fig. 7.
Table 5 summarises the physical stellar parameters that we finally adopt for the components in the subsequent comparison with PMS evolutionary models.
We use the
![]() absolute photometry for the visual (A and B)
components of RX J0529.4+0041, to derive the effective temperature and
radius of component B adopting the same distance inferred for the eclipsing
system and to verify the consistency of the results obtained for the latter
from light-curve analysis.
absolute photometry for the visual (A and B)
components of RX J0529.4+0041, to derive the effective temperature and
radius of component B adopting the same distance inferred for the eclipsing
system and to verify the consistency of the results obtained for the latter
from light-curve analysis.
The spectral energy distribution (SED) of RX J0529.4+0041 A, reported
in the upper panel of Fig. 8, was constructed from the dereddened,
![]() observed fluxes (black dots). These are compared with calculated
fluxes (triangles) obtained from a combination of two synthetic Next-Generation
spectra, corresponding to the physical parameters derived from the light-curve solution
for each of the two eclipsing components. Also drawn in the figure are the
individual and total synthetic spectra.
observed fluxes (black dots). These are compared with calculated
fluxes (triangles) obtained from a combination of two synthetic Next-Generation
spectra, corresponding to the physical parameters derived from the light-curve solution
for each of the two eclipsing components. Also drawn in the figure are the
individual and total synthetic spectra.
![\begin{figure}
\par\includegraphics[width=8.8cm,clip]{0348fig8a.ps}\vspace*{3mm}
\includegraphics[width=8.8cm,clip]{0348fig8b.ps}\end{figure}](/articles/aa/full/2004/44/aa0348-04/img48.gif) |
Figure 8:
Upper panel: spectral energy distribution (SED) of
RX J0529.4+0041 A, as deduced from observed
|
| Open with DEXTER | |
Based on spectroscopic evidences (presence of Lithium and common systemic radial velocity), there are good reasons to believe that RX J0529.4+0041 A and B do form a physically bound hierarchical triple system. Therefore it can be assumed to have the same distance from the Sun and the same age of RX J0529.4+0041 A.
Since RX J0529.4+0041 B is presumably single (spectroscopic data seem to rule out a possible SB nature), we can locate it in the HR diagram with fairly good accuracy exploiting the information gained from the study of the inner binary. The key parameter needed for the conversion from visual magnitude to luminosity is the distance of the system. Its value could be obtained in a very simple way with the "bolometric flux'' method (see Gray 1992), which requires only the radii and effective temperatures of the eclipsing components A1 and A2 and the bolometric corrections. However, since we have data in several bands from near-UV to near-IR, we preferred to match the observed spectral energy distribution (SED) with synthetic spectra.
We evaluated the flux emitted in the optical and IR regions by the inner binary
RX J0529.4+0041 A from the average, out-of-eclipse,
![]() combined
magnitudes (Table 2).
combined
magnitudes (Table 2).
After standard correction for interstellar reddening (Savage & Mathis 1979,
for AR and AI), adopting the value E(B-V) = 0.10, we obtained the
![]() fluxes at Earth (in erg cm-2 s-1 Å-1) for the
central wavelength of each band (Lamla 1982).
fluxes at Earth (in erg cm-2 s-1 Å-1) for the
central wavelength of each band (Lamla 1982).
These observed fluxes were compared with those obtained by integrating, into
the proper pass-bands, the composite spectrum obtained by combining, with the
proper weights, two synthetic low-resolution spectra matching the two eclipsing
components of RX J0529.4+0041 A generated with the NextGen (Hauschildt et al.
1999a,b) photospheric models and available on the
web![]() .
.
The total flux at Earth
![]() was obtained from the
stellar surface fluxes of the individual synthetic spectra,
was obtained from the
stellar surface fluxes of the individual synthetic spectra,
![]() according to the relation
according to the relation
 |
(2) |
In order to derive the effective temperature and luminosity of component B,
we used a method similar to the one described previously, in which a single
synthetic spectrum was used to reproduce the observed SED. We fixed
the distance to the value found for the inner binary (325 pc) and let
![]() and
and ![]() of the model as well as the star radius to vary.
The model with
of the model as well as the star radius to vary.
The model with
![]() K,
K,
![]() and a star radius
and a star radius
![]() gives the best match to the observed SED (see
Fig. 8).
The star radius we deduce for RX J0529.4+0041 B is in fairly good agreement with the
value of
gives the best match to the observed SED (see
Fig. 8).
The star radius we deduce for RX J0529.4+0041 B is in fairly good agreement with the
value of
![]() derived by means of the Barnes-Evans relation for
late-type stars (Barnes et al. 1978) between the intrinsic (V-R)
colour index, the V apparent magnitude and the stellar angular diameter
derived by means of the Barnes-Evans relation for
late-type stars (Barnes et al. 1978) between the intrinsic (V-R)
colour index, the V apparent magnitude and the stellar angular diameter ![]() :
:
| (3) |
Finally, the masses, effective temperatures and luminosities for the eclipsing components are compared with the theoretical values inferred from evolutionary models, adopting various sets of PMS evolutionary tracks calculated by different authors.
Figure 9 shows the positions on the HR diagramme corresponding to the stellar parameters derived from the new light-curve solution reported in Table 5, compared with different sets of PMS evolutionary tracks and isochrones.
Table 6: Fundamental stellar properties for the components of RX J0529.4+0041A, NTT 045251+3016 (Steffen et al. 2001) and V1174 Ori (Stassun et al. 2004).
![\begin{figure}
\par\includegraphics[width=14cm,clip]{0348fig9.ps}\end{figure}](/articles/aa/full/2004/44/aa0348-04/img64.gif) |
Figure 9:
Comparison on the HR diagramme of the positions of the eclipsing
components of RX J0529.4+0041A (black diamonds) with different sets of PMS
evolutionary tracks and isochrones from different authors. The position of
the third component, RX J0529.4+0041B, is marked by the triangle.
Tracks corresponding to different masses (solid lines) are labelled in solar
units and isochrones (dashed lines) at different ages are marked in Myrs.
Additionally, the positions of the components of the eclipsing system V1174 Ori
(Stassun et al. 2004; small, open diamonds) and of the spectro-astrometric
binary NTT 045251+3016 (Steffen et al. 2001; |
| Open with DEXTER | |
Additional mass determinations for low-mass PMS stars have become available in
the literature.
Therefore, on the HR diagramme of Fig. 9 we also report for
comparison purposes the components of the astrometric-spectroscopic system
NTT 045251+3016, with dynamical masses of about 1.4 and 0.8 ![]() respectively (Steffen et al. 2001), and those of the new eclipsing-spectroscopic
binary V1174 Ori, of about 1.0 and 0.7
respectively (Steffen et al. 2001), and those of the new eclipsing-spectroscopic
binary V1174 Ori, of about 1.0 and 0.7 ![]() (Stassun et al. 2004).
The fundamental parameters for these two systems and RX J0529.4+0041 A,
are summarised in Table 6.
The different positions of each pair of stars in the HR diagramme can be
interpreted in terms of age differences for these systems, although metallicity
might in principle also play a role.
However, we notice that while for V1174 Ori, analogously to RX J0529.4+0041 A,
the dynamical masses are accurate to about 1%, in the case of NTT 045251+3016
the accuracy appears somewhat lower, mainly due to the still relatively large
uncertainty on the orbital inclination deriving from the not yet complete coverage
of the astrometric orbit. Indeed, the dynamical masses derived for the components
of NTT 045251+3016 appear clearly inconsistent with their position on the
HR diagramme as both the primary and secondary components are slightly cooler
than the corresponding component of V1174 Ori, suggesting comparable (or
slightly lower) masses.
(Stassun et al. 2004).
The fundamental parameters for these two systems and RX J0529.4+0041 A,
are summarised in Table 6.
The different positions of each pair of stars in the HR diagramme can be
interpreted in terms of age differences for these systems, although metallicity
might in principle also play a role.
However, we notice that while for V1174 Ori, analogously to RX J0529.4+0041 A,
the dynamical masses are accurate to about 1%, in the case of NTT 045251+3016
the accuracy appears somewhat lower, mainly due to the still relatively large
uncertainty on the orbital inclination deriving from the not yet complete coverage
of the astrometric orbit. Indeed, the dynamical masses derived for the components
of NTT 045251+3016 appear clearly inconsistent with their position on the
HR diagramme as both the primary and secondary components are slightly cooler
than the corresponding component of V1174 Ori, suggesting comparable (or
slightly lower) masses.
With the present stellar parameter determinations, a better agreement between
dynamical and theoretical masses is found for RX J0529.4+0041 A, and marginally also
for V1174 Ori, in the case of the Swenson et al. tracks, and those from Baraffe et al.
corresponding to a value of the mixing length parameter,
![]() .
On the other hand, when compared to D'Antona & Mazzitelli's tracks,
the Secondary of RX J0529.4+0041 A appears to be somewhat cooler for the FST
tracks set, and better consistent to the MLT set of tracks.
However, D'Antona et al. (2000) have shown that the purely thermal
effect of a magnetic field can deeply modify the behavior of atmospheric convection,
increasing the temperature gradients and lowering the effective temperature of
the model.
From the observational point of view, the results of the light-curve analysis
also showed that the presence of spots represent a critical issue for the determination
of stellar parameters, as they may affect the derived radii and alter the
mean temperature of the components.
Another key point to consider is that models for single, non-rotating stars might
be inadequate to reproduce the properties of relatively fast-rotating stars.
.
On the other hand, when compared to D'Antona & Mazzitelli's tracks,
the Secondary of RX J0529.4+0041 A appears to be somewhat cooler for the FST
tracks set, and better consistent to the MLT set of tracks.
However, D'Antona et al. (2000) have shown that the purely thermal
effect of a magnetic field can deeply modify the behavior of atmospheric convection,
increasing the temperature gradients and lowering the effective temperature of
the model.
From the observational point of view, the results of the light-curve analysis
also showed that the presence of spots represent a critical issue for the determination
of stellar parameters, as they may affect the derived radii and alter the
mean temperature of the components.
Another key point to consider is that models for single, non-rotating stars might
be inadequate to reproduce the properties of relatively fast-rotating stars.
Altough not helpful in the definition of absolute ages, PMS binary components
at least provide a very good relative test for theoretical isochrones, as they
are expected to be coeval.
Remarkably, the components of the two eclipsing systems RX J0529.4+0041 A,
and V1174 Ori, all lie very close to the same (10 Myr) isochrone of the
Swenson et al.'s set.
However, the slope of the observed isochrone appears to differ significantly
from a theoretical one for all the other models except in the case of Baraffe
et al.'s (
![]() ) models, which are marginally consistent
with the observations.
) models, which are marginally consistent
with the observations.
Furthermore, using the results from Sect. 5.2, it is possible to locate the visual component, RX J0529.4+0041 B, on the H-R diagramme. Indeed, the high Li content in all of the three components and their common, systemic radial velocity, consistent with that of the Orion region, provide, altogether, strong independent support to the fact that the three of them are still in the PMS phase and most likely coeval.
The major trigger for the present work was the rather striking mismatch between
the observed
![]() for the secondary component of RX J0529.4+0041 A
(Covino et al. 2000, 2001) and the predictions by current models.
Notoriously, theoretical PMS evolutionary tracks at low masses run almost
vertically in the H-R diagramme, hence the determination of effective
temperature is critical for the mass estimation of young low-mass stars.
Moreover, as also seen here, among the various models there exist large
differences in the predicted paths of young stars towards the main sequence,
consequently the inferred masses and ages are sensitive to both the choice of
models and the adopted temperature scale.
In the case of the eclipsing components of RX J0529.4+0041 A, the surface
gravities, calculated directly from the masses and radii, allow to restrict
the choice to the temperature scales for dwarf stars.
for the secondary component of RX J0529.4+0041 A
(Covino et al. 2000, 2001) and the predictions by current models.
Notoriously, theoretical PMS evolutionary tracks at low masses run almost
vertically in the H-R diagramme, hence the determination of effective
temperature is critical for the mass estimation of young low-mass stars.
Moreover, as also seen here, among the various models there exist large
differences in the predicted paths of young stars towards the main sequence,
consequently the inferred masses and ages are sensitive to both the choice of
models and the adopted temperature scale.
In the case of the eclipsing components of RX J0529.4+0041 A, the surface
gravities, calculated directly from the masses and radii, allow to restrict
the choice to the temperature scales for dwarf stars.
Due to the relatively large temperature difference between the components of RX J0529.4+0041 A, the secondary eclipse appears too shallow and poorly defined, when observed in visible bands, to provide a satisfactory determination of the effective temperature of the cooler component. The situation was made even worse by the "veiling'' produced on the light-curve by the third-light contribution, due to the close visual companion, unresolved in most of the optical observations. Hence, the idea to observe in the near-IR, where the secondary minimum was expected to be deeper, and to exploit adaptive optics capabilities in order to separate the light from the companion and to obtain high precision, high time-resolution, near-infrared differential light-curves.
It is also important to note that the two components of RX J0529.4+0041 A are
in a well-detached binary configuration, as each star is well inside its
critical Roche lobe. Thus, the current observable properties of the two stars are not expected
to differ significantly from those of single stars of the same masses and age,
although they will certainly become affected by binarity at some point in their
future evolution, after the primary will have left the main sequence.
On the other hand, it is very likely that their orbits had already experienced
an early dynamical evolution, during the formation phase, which eventually led to
circularization accompanied by a shrinkage of the orbit to its present-day size.
Theory predicts that tidal friction in a hierarchical triple, provided that the
outer and inner orbits are nearly orthogonal, can reduce the inner orbital
period from months to days within a relatively short period of time, of the
order of
![]() (Kiseleva et al. 1998).
We can obtain a rough evaluation (or at least the order of magnitude) for the
orbital period of the outer binary from the third Kepler law, by adopting a
total mass
(Kiseleva et al. 1998).
We can obtain a rough evaluation (or at least the order of magnitude) for the
orbital period of the outer binary from the third Kepler law, by adopting a
total mass
![]() (with
(with
![]() and assuming
and assuming
![]() ), provided that the projected separation of 1.3 arcsec
is not very different from the true angular semi-major axis of the orbit
(following the statistical arguments by Reipurth & Zinnecker 1993).
Then, at a distance of 325 pc, this translates into a semi-major axis
), provided that the projected separation of 1.3 arcsec
is not very different from the true angular semi-major axis of the orbit
(following the statistical arguments by Reipurth & Zinnecker 1993).
Then, at a distance of 325 pc, this translates into a semi-major axis
![]() AU, or an orbital period of
AU, or an orbital period of
![]()
![]() 104 yr.
Thus, a rough upper limit to the time required to reduce the orbital period of
the inner binary from a few months to the present value of 3 days (with a parallel
increase of the outer orbit period) would be of the order of 108 years.
This means that such a mechanism could plausibly operate to determine
the present-day orbital configuration of the RX J0529.4+0041 triple system.
104 yr.
Thus, a rough upper limit to the time required to reduce the orbital period of
the inner binary from a few months to the present value of 3 days (with a parallel
increase of the outer orbit period) would be of the order of 108 years.
This means that such a mechanism could plausibly operate to determine
the present-day orbital configuration of the RX J0529.4+0041 triple system.
We notice that, in the case of synchronous rotation, the radii of the two
components yield equatorial rotational velocities of 24.4 and 23 km s-1
for the Primary and Secondary components, respectively.
The result is thus fully consistent with the measured ![]() of 25
of 25 ![]() 3 km s-1 for the Primary, while it appears somewhat in excess
with respect to the value of 17
3 km s-1 for the Primary, while it appears somewhat in excess
with respect to the value of 17 ![]() 3 km s-1 measured in the case of
the Secondary, unless the accuracy of the
3 km s-1 measured in the case of
the Secondary, unless the accuracy of the ![]() measurement is
notably worse than the quoted statistical error.
Thus, this might indicate that either the radius of the Secondary is
significantly overestimated (by about 20%), or the synchronization
condition is not verified for the lower-mass component. However, the latter
eventuality appears less likely, because spin-orbit synchronization is
expected to occur on a shorter time-scale than orbital circularization
(Zahn & Bouchet 1989).
measurement is
notably worse than the quoted statistical error.
Thus, this might indicate that either the radius of the Secondary is
significantly overestimated (by about 20%), or the synchronization
condition is not verified for the lower-mass component. However, the latter
eventuality appears less likely, because spin-orbit synchronization is
expected to occur on a shorter time-scale than orbital circularization
(Zahn & Bouchet 1989).
The new observations presented here have shown that it is indeed possible to improve significantly the visibility and the definition of the secondary eclipse, and, in principle, the overall quality of the entire light-curve by means of spatially resolved near-IR photometry. However, due to the severe constraints set by the three-day orbital period, the main limitation of ground-based observations is the difficulty in covering the full light-curve by observing over a few, consecutive, orbital cycles. This makes any attempt towards a more detailed analysis of the light-curve and the interpretation of possible out-of-eclipse variations in terms of the presence of stellar spots far more complicated. Indeed, although the wavy shape of the light-curves outside eclipse clearly indicates the presence of spots on at least one of the components, the present data-set appears inadequate for a meaningful, detailed treatment of stellar spots (Torres & Ribas 2002).
Therefore, the best way to carry out a fine light-curve analysis and further improve the present determinations of the stellar parameters for RX J0529.4+0041 A, and possibly for other PMS eclipsing systems, would be to ensure continuous phase coverage observations, over at least two consecutive orbital cycles, exploiting for instance photometric telescopes on board satellites.
Acknowledgements
We wish to thank the ESO staff for kind assistance and technical support during the ADONIS observations, in particular Katie Brooks and Erich Wenderoth. We also gratefully acknowledge Antonio Magazzù and Javier A. Licandro for performing the service observations at the TNG. We thank the referee, Dr. J. Andersen, for valuable comments which helped to improve the paper. We acknowledge financial support by the Italian Ministero dell'Università e della Ricerca. This research has made use of the Simbad database, operated at CDS, Strasbourg, France.
Table 1: JHK differential photometry of the eclipsing component RXJ 0529.4+0041 A with respect to component B, with running Heliocentric Julian Day (-2,400,000). The corresponding orbital phase is computed using the new ephemeris given in Sec. 4.1 (Only in electronic form.)
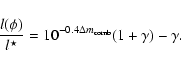
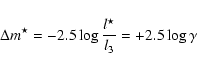
The net effect of the presence of a third light on the light-curve is to produce a kind of veiling, which reduces the depths of the eclipses as well as their ratio, thus simulating a system with lower orbital inclination and altered temperature difference between the eclipsing components.
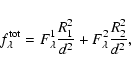
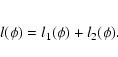
The total flux contributed by the two eclipsing components (indicated by the
indices 1 and 2) at phase ![]() is
is

| |
= |  |
|
| = |  |
(A.3) |