![\begin{figure}
\par\includegraphics[width=5.85cm,clip]{1277_f1a.ps}\includegraph...
...m,clip]{1277_f1b.ps}\includegraphics[width=5.85cm,clip]{1277_f1c.ps}\end{figure}](/articles/aa/full/2004/43/aa1277/Timg17.gif) |
Figure 1: Continuum intensity ( left), total circular polarization ( middle), and total linear polarization ( right) maps of AR 8704 as observed with TIP on 1999 September 20 at 15:25 UT. The linear polarization L is defined as L2 = Q2 + U2. The arrow indicates the direction to disk center. It also represents the positive y-axis of the local reference frame. Contour levels for the inner and outer penumbral boundaries are 0.75 and 0.90 of the quiet sun continuum intensity. The continuum map shows an azimuthal path at a normalized radial distance of 0.7. The crosses mark the position of the Stokes profiles displayed in Fig. 3. |
| Open with DEXTER | |
In the text
| |
Figure 2: Spatial variation of the intensity ( left), circular polarization ( middle) and linear polarization ( right) profiles of the Fe I 1564.8 nm line in AR 8704 along the symmetry line connecting the disk center and the sunspot center. The horizontal and vertical axes represent the spectral and spatial directions, respectively. The center-side penumbra is at the top. The Stokes V and L profiles in each row have been normalized to their maximum absolute values for better visibility. Note that the maximum Doppler shifts occur near the spatial positions where Stokes V and Stokes L show discontinuities. |
| Open with DEXTER | |
In the text
![\begin{figure}
\par\includegraphics[width=8.8cm,clip]{1277_f3.eps}\end{figure}](/articles/aa/full/2004/43/aa1277/Timg32.gif) |
Figure 3: Examples of observed (dots) and best-fit (solid lines) profiles emerging from the center-side ( left) and limb-side ( right) penumbra at the spatial locations marked in Fig. 1 with crosses. Note the abnormal Stokes Q profiles and the extended red wings of Stokes V on the center side. The example for the limb-side penumbra was observed near the neutral line. At this position, Stokes V shows three lobes and Stokes Q and U are clearly asymmetric. |
| Open with DEXTER | |
In the text
![\begin{figure}
\par\includegraphics[width=13cm,clip]{1277_f4a.eps}\vspace*{3mm}
...
...4c.eps}\vspace*{3mm}
\includegraphics[width=13cm,clip]{1277_f4d.eps}\end{figure}](/articles/aa/full/2004/43/aa1277/Timg33.gif) |
Figure 4: Magnetic and kinematic configuration of AR 8704 as derived from the two-component inversion of the observed Stokes profiles. From top to bottom: magnetic field strength, magnetic field inclination, magnetic field azimuth, and LOS velocity (positive values indicate redshifts) for the background ( left) and flux-tube ( right) atmospheres. All angles are expressed in the LRF. Azimuths are measured counterclockwise from the positive x-axis of the LRF. The umbra in the flux-tube component is displayed in black because the filling factor is nearly zero there. |
| Open with DEXTER | |
In the text
![\begin{figure}
\par\includegraphics[width=7.8cm,clip]{1277_f5.ps}\end{figure}](/articles/aa/full/2004/43/aa1277/Timg39.gif) |
Figure 5: Map of the fractional area of the resolution element occupied by the second magnetic component (the flux-tube atmosphere). |
| Open with DEXTER | |
In the text
 |
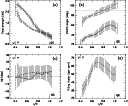
Figure 6:
Magnetic configuration of AR 8704 as inferred from the two-component
inversions presented in this work. a) Azimuthally averaged
magnetic field strength; b) magnetic zenith angle; c)
relative magnetic azimuth; and d) filling factor for the
background (solid lines) and flux-tube (dashed lines) atmospheres, as
a function of normalized radial distance (R is the spot radius as seen
in the continuum image). The inner and outer penumbral boundaries are
indicated with small vertical bars on the x-axes. The relative azimuth
|
| Open with DEXTER | |
In the text
 |
Figure 7: Kinematic configuration of AR 8704 as deduced from the two-component inversions. Top panels: zenith angle of the velocity vector in the flux-tube ( left) and background ( right) atmospheres. For comparison purposes, the zenith angle of the magnetic field vector in each component is also depicted (thick lines). Bottom panels: magnitude of the velocity vector in each component. Error bars for the flow angles and flow speeds have been computed through error propagation of the uncertainties in the best-fit coefficients of Eq. (2). Error bars for the magnetic zenith angles represent the uncertainties in the azimuthal averages. |
| Open with DEXTER | |
In the text
![\begin{figure}
\par\includegraphics[width=6.65cm,clip]{1277_f8a.ps}\vspace*{3mm}
\includegraphics[width=6.65cm,clip]{1277_f8b.ps}\end{figure}](/articles/aa/full/2004/43/aa1277/Timg54.gif) |
Figure 8: Spatial positions (black pixels outside the umbra) where the flow speed in the flux-tube component is larger than the sound speed ( top) and the tube speed ( bottom). White pixels represent locations where the cosine of the LOS magnetic field inclination is smaller than 0.25. No calculations have been carried out in these pixels to avoid large extrapolations. |
| Open with DEXTER | |
In the text
![\begin{figure}
\par\includegraphics[width=4.1cm,clip]{1277_f9a.eps}\hspace*{2mm}...
...c.eps}\hspace*{2mm}
\includegraphics[width=4.1cm,clip]{1277_f9d.eps}\end{figure}](/articles/aa/full/2004/43/aa1277/Timg60.gif) |
Figure 9: Left panels: field strength ( top) and field inclination ( bottom) resulting from one-component inversions of pixels along an azimuthal path crossing the inner penumbra at r/R = 0.6, versus the filling factors deduced from the two-component inversion of the same pixels. Right panels: field strengths ( top) and field inclinations ( bottom) in the background (open circles) and flux-tube (filled circles) atmospheres from the two-component inversion, as a function of the filling factor, along the same azimuthal path. |
| Open with DEXTER | |
In the text
![\begin{figure}
\par\includegraphics[width=5.85cm,clip]{1277f10a.ps}\includegraph...
...m,clip]{1277f10b.ps}\includegraphics[width=5.85cm,clip]{1277f10c.ps}\end{figure}](/articles/aa/full/2004/43/aa1277/Timg63.gif) |
Figure 10:
a) Observed NCP of Fe I 1564.8 nm. b)
Difference between LOS magnetic field azimuths in the flux tube and
the background (
|
| Open with DEXTER | |
In the text