A&A 426, 97-103 (2004)
DOI: 10.1051/0004-6361:20035755
S. Faúndez1 - L. Bronfman1 - G. Garay1 - R. Chini2 - L.-Å. Nyman3 - J. May1
1 - Departamento de Astronomía, Universidad de Chile, Casilla 36-D, Santiago, Chile
2 - Astronomisches Institut der Ruhr-Universität Bochum, Universitätsstr. 150/NA 7, 44780 Bochum, Germany
3 - European Southern Observatory, Casilla 19001, Santiago, Chile
Received 27 November 2004 / Accepted 1 June 2004
Abstract
We report the results of a 1.2 mm continuum emission survey toward
146 IRAS sources thought to harbour high-mass star forming regions. The sources
have FIR colors typical of UCHII regions and were detected in the CS(
![]() )
line
survey of Bronfman et al. (1996). Regions of
)
line
survey of Bronfman et al. (1996). Regions of
![]() ,
centered on each IRAS source, were mapped with an angular resolution of
,
centered on each IRAS source, were mapped with an angular resolution of ![]() 24
24
![]() ,
using the SIMBA array on the SEST telescope. 1.2 mm emission
was detected toward all IRAS sources. We find that the dust cores associated
with these sources have typical sizes of 0.4 pc and masses
of
,
using the SIMBA array on the SEST telescope. 1.2 mm emission
was detected toward all IRAS sources. We find that the dust cores associated
with these sources have typical sizes of 0.4 pc and masses
of
![]() .
Dust temperatures and luminosities, derived from the
SED, are typically 32 K and
.
Dust temperatures and luminosities, derived from the
SED, are typically 32 K and
![]() .
.
Key words: ISM: clouds - stars: formation - ISM: dust, extinction - radio continum: ISM - stars: circumstellar matter - ISM: H II regions
The process of formation of massive stars is still not well understood
(e.g. Garay & Lizano 1999).
There are two main hypotheses to explain their mass build-up: (i) through
coalescense of low-mass stars in high stellar density clusters (
![]() stars pc-3; Bonnell et al. 1998) and (ii) through accretion
(Osorio & Lizano 1999; Yorke & Sonnhalter 2002; McKee & Tan 2003). Recent
observations of
disks (Shepherd et al. 2001) and jets (Garay et al. 2003
) give support to the
accretion scenario, but coalescence cannot be ruled out.
stars pc-3; Bonnell et al. 1998) and (ii) through accretion
(Osorio & Lizano 1999; Yorke & Sonnhalter 2002; McKee & Tan 2003). Recent
observations of
disks (Shepherd et al. 2001) and jets (Garay et al. 2003
) give support to the
accretion scenario, but coalescence cannot be ruled out.
Understanding the formation and early evolution of massive stars requires knowledge of the physical conditions of their
birth environment. Due to the intrinsic
scarcity of high-mass stars and the short timescales involved in their formation
(
![]() yr, McKee & Tan 2003), the early stages of such formation have
been only recently explored by systematic surveys
(Plume et al. 1992, 1997; Bronfman et al. 1996; Beuther et al. 2002; Sridharan et
al. 2002; Mueller et al. 2002). From a survey of molecular emission, in several
transitions of CS, toward regions of massive star formation associated with water
masers, Plume et al. (1997) found that high-mass stars are formed in molecular
cores with typical densities of
yr, McKee & Tan 2003), the early stages of such formation have
been only recently explored by systematic surveys
(Plume et al. 1992, 1997; Bronfman et al. 1996; Beuther et al. 2002; Sridharan et
al. 2002; Mueller et al. 2002). From a survey of molecular emission, in several
transitions of CS, toward regions of massive star formation associated with water
masers, Plume et al. (1997) found that high-mass stars are formed in molecular
cores with typical densities of
![]() cm-3, radii of 0.5 pc and
virial masses of
cm-3, radii of 0.5 pc and
virial masses of
![]() .
.
With the goal of determining the physical characteristics of molecular cores
harboring recently formed massive stars, at spatial scales of ![]() 0.5 pc,
we have made a survey of 1.2 mm continuum emission toward 146 objects,
thought to harbour high-mass star forming regions, using the SIMBA bolometer at
SEST (Nyman et al. 2001). The sources were selected from the CS(
0.5 pc,
we have made a survey of 1.2 mm continuum emission toward 146 objects,
thought to harbour high-mass star forming regions, using the SIMBA bolometer at
SEST (Nyman et al. 2001). The sources were selected from the CS(
![]() )
survey of
Bronfman et al. (1996) ensuring high density gas and that they
have FIR colours typical of ultra compact H II regions (Wood & Churchwell 1989).
The 1.2-mm emission was mapped within regions of
)
survey of
Bronfman et al. (1996) ensuring high density gas and that they
have FIR colours typical of ultra compact H II regions (Wood & Churchwell 1989).
The 1.2-mm emission was mapped within regions of ![]()
![]() centered on the IRAS sources. Moreover, since the sites of massive star formation are known to be
gregarious, a further goal of this survey was to find massive cores in early
stages of evolution, previous to the formation of a central massive object.
In this paper we present the basic data set of the 1.2-mm objects associated
with the IRAS sources. The identification of dense, cold and massive pre-stellar
objects from this survey will be the subject of a further publication.
centered on the IRAS sources. Moreover, since the sites of massive star formation are known to be
gregarious, a further goal of this survey was to find massive cores in early
stages of evolution, previous to the formation of a central massive object.
In this paper we present the basic data set of the 1.2-mm objects associated
with the IRAS sources. The identification of dense, cold and massive pre-stellar
objects from this survey will be the subject of a further publication.
The observations were made using the 37-channel hexagonal bolometer array
SIMBA installed at the SEST 15 m telescope. The passband of the bolometer has an
equivalent width of 90 GHz and is centered at 250 GHz. The SEST telescope
has a beamwidth of
![]() at the frequency band of SIMBA. The 1.2 mm emission was mapped toward 146 regions, centered on IRAS sources.
We observed typically 2-3 maps per source, with a final rms of 40 mJy
beam-1. Typical map sizes were
at the frequency band of SIMBA. The 1.2 mm emission was mapped toward 146 regions, centered on IRAS sources.
We observed typically 2-3 maps per source, with a final rms of 40 mJy
beam-1. Typical map sizes were
![]() .
The maps were
observed in the fast mapping mode in three runs between June 2001 and July 2002.
The scans are in azimuth at a velocity of
.
The maps were
observed in the fast mapping mode in three runs between June 2001 and July 2002.
The scans are in azimuth at a velocity of
![]() /s, separated in elevation
by
/s, separated in elevation
by
![]() .
Data reduction was done using the MOPSI (Zylka 1998) software in
three steps. In the first step, a standard procedure was followed to create
an intensity map and to define a proper baseline to avoid artifacts close to
the source. In the second stage, a model of the source is created using the
previous map, which is used in the correlated sky noise filtering of the last
step. Care was taken in choosing the intensity of the despiking because some
sources were too strong. Sky opacity corrections were applied and the maps
were calibrated from observations of Uranus or Mars. The calibration
uncertainties are estimated at 20%.
.
Data reduction was done using the MOPSI (Zylka 1998) software in
three steps. In the first step, a standard procedure was followed to create
an intensity map and to define a proper baseline to avoid artifacts close to
the source. In the second stage, a model of the source is created using the
previous map, which is used in the correlated sky noise filtering of the last
step. Care was taken in choosing the intensity of the despiking because some
sources were too strong. Sky opacity corrections were applied and the maps
were calibrated from observations of Uranus or Mars. The calibration
uncertainties are estimated at 20%.
![\begin{figure}
\par\includegraphics[width=11cm,clip]{0755fig1.ps}\vspace*{4mm}
\includegraphics[width=11cm,clip]{0755fig2.ps} %
\end{figure}](/articles/aa/full/2004/40/aa0755/Timg42.gif) |
Figure 1: Galactic distribution of the sources in the survey. Top: longitude-latitude coverage. Bottom: longitude-velocity distribution. |
| Open with DEXTER | |
The 146 observed IRAS sources were chosen as follows. We selected the brightest CS sources
(
TA > 2.0 K) in the Bronfman et al. (1996) survey. Of the near 200 sources fulfilling this
criteria, we observed 103 that homogeneously cover the galactic longitude. We
complemented this sample with 34 sources that exhibit wings in the CS spectrum,
indicative of outflow phenomena, and 9 sources without detections in the radio
continuum survey of Walsh et. al (1998). The total number of sources brighter
than 2.0 K is 116, exhibiting broad wings in the CS(2
![]() 1) line is 82 and with
no radio continuum detections is 21. The Galactic coverage of our survey is shown
in Fig. 1. The majority of the sources are within the solar circle (95%).
1) line is 82 and with
no radio continuum detections is 21. The Galactic coverage of our survey is shown
in Fig. 1. The majority of the sources are within the solar circle (95%).
Kinematical distances were derived using the CS(
![]() )
line velocities reported by
Bronfman et al. (1996), a flat rotation curve, and the standard IAU constants for the solar velocity
and solar radius of, respectively, 220 km s-1 and 8.5 kpc. The two-fold
ambiguity in kinematic distance that affects sources within the solar circle was
resolved using a standard spiral arms model following Bronfman et al. (2000).
For sources in the I quadrant, we adopted distances from the literature and, when not avilable, adopted
the near distance. The nearest source is located at 400 pc and the farthest one is at 13 kpc. The average
distance is 4.4 kpc. The distribution of distances is shown in the lower right panel of Fig. 3
)
line velocities reported by
Bronfman et al. (1996), a flat rotation curve, and the standard IAU constants for the solar velocity
and solar radius of, respectively, 220 km s-1 and 8.5 kpc. The two-fold
ambiguity in kinematic distance that affects sources within the solar circle was
resolved using a standard spiral arms model following Bronfman et al. (2000).
For sources in the I quadrant, we adopted distances from the literature and, when not avilable, adopted
the near distance. The nearest source is located at 400 pc and the farthest one is at 13 kpc. The average
distance is 4.4 kpc. The distribution of distances is shown in the lower right panel of Fig. 3
1.2-mm emission was detected toward all 146 observed regions (each ![]()
![]() in size). Maps are shown in Figs. 6-22.
In almost half of the maps we detected two or more objects (average of 2.2 sources
per map. Figure 5 shows the distribution of number of sources per map). In particular we find that all IRAS sources are associated
with 1.2 mm emission. The observed and derived parameters of the 1.2-mm sources
associated with the IRAS sources are summarized in Table 1. Column 1 gives the IRAS name; Col. 2 the distance; Col. 3 the number of sources per map; Cols. 4 and 5 the right ascension and declination of
the peak in the 1.2-mm emission; Col. 6 the 1.2-mm flux density;
Col. 7 the angular size of the 1.2-mm emission. The derived parameters,
dust temperature, mass, density and luminosity, are given in Cols. 8 to 11,
respectively.
In what follows we describe how the value of the parameters were obtained.
in size). Maps are shown in Figs. 6-22.
In almost half of the maps we detected two or more objects (average of 2.2 sources
per map. Figure 5 shows the distribution of number of sources per map). In particular we find that all IRAS sources are associated
with 1.2 mm emission. The observed and derived parameters of the 1.2-mm sources
associated with the IRAS sources are summarized in Table 1. Column 1 gives the IRAS name; Col. 2 the distance; Col. 3 the number of sources per map; Cols. 4 and 5 the right ascension and declination of
the peak in the 1.2-mm emission; Col. 6 the 1.2-mm flux density;
Col. 7 the angular size of the 1.2-mm emission. The derived parameters,
dust temperature, mass, density and luminosity, are given in Cols. 8 to 11,
respectively.
In what follows we describe how the value of the parameters were obtained.
The angular sizes, given in Col. 7 of Table 1, correspond to the geometrical
mean of the observed semi-major and semi-minor axes of Gaussians fitted to the 1.2-mm emission.
An histogram of the distribution of the physical sizes, determined
from the angular sizes using the distances listed in Col. 2, is shown in the
upper left panel of Fig. 3. The average radius of the sources in our survey is ![]() pc.
pc.
Dust temperatures were derived by fitting the spectral energy distribution
(SED) using a modified blackbody model,
 |
(1) |
 |
(2) |
![\begin{figure}
\par\includegraphics[width=2.5in,height=2.5in,clip]{0755fig3.eps}...
...4mm}
\includegraphics[width=2.55in,height=2.55in,clip]{0755fig4.eps}\end{figure}](/articles/aa/full/2004/40/aa0755/Timg54.gif) |
Figure 2: SED of typical 1.2-mm/IRAS sources. Top: IRAS 15439-5449. Bottom: IRAS 17143-3700. The subscripts C and H refers to cold and hot components, respectively. |
| Open with DEXTER | |
A model with two dust components at different temperatures had to be used to
obtain a good fit of the SED (consisting of the 1.2 mm flux and the fluxes in the
four IRAS bands; see Fig. 2). We adopted as angular size of the colder component
that given in Table 1. We find that the cold component has a typical temperature of
![]() 32 K, a turnover frequency of
32 K, a turnover frequency of ![]()
![]() GHz, and a power law index
between 1.5-2.5. The warmer component has a typical temperature of
GHz, and a power law index
between 1.5-2.5. The warmer component has a typical temperature of ![]() 140 K and
a turnover frequency of
140 K and
a turnover frequency of ![]()
![]() GHz (
GHz (![]() was fixed to 1). The
angular size of this component was estimated from the fit.
An histogram of the temperatures for the cold component is shown
in the upper right panel of Fig. 3.
was fixed to 1). The
angular size of this component was estimated from the fit.
An histogram of the temperatures for the cold component is shown
in the upper right panel of Fig. 3.
The dust clouds in our survey have ![]() (
(
![]() )
column densities considerably smaller
than 1026 cm-2, the value at which
)
column densities considerably smaller
than 1026 cm-2, the value at which
![]() for a
temperature of
for a
temperature of ![]() 32 K (e.g. Mezger 1994). Therefore, the emission is
optically thin and the dust mass can be computed using the expression (e.g. Chini et al. 1987),
32 K (e.g. Mezger 1994). Therefore, the emission is
optically thin and the dust mass can be computed using the expression (e.g. Chini et al. 1987),
 |
(3) |
The value of the opacity is set by the characteristics of the dust, which are not
well determined observationally. Different assumptions about these characteristics
can lead to values that differ up to one order of magnitude. The opacities compiled
by Hildebrand (1983) have been commonly used in the literature (e.g. Walker et al.
1990; Beuther et al. 2002). More recently, Ossenkopf & Henning (1994)
computed and tabulated the opacity of dust in a broader wavelength range. We adopt a dust
opacity at 1.2 mm of 1 cm2 g-1, computed by the last authors for
typical conditions of dense protostellar clouds. This opacity is a factor of 5
greater than the opacity given by Hildebrand(1983), implying masses five times
smaller than those computed using the Hildebrand's value. Assuming a gas-to-dust mass
ratio
![]() ,
the total cloud mass is given in terms of the
flux density at 1.2 mm by,
,
the total cloud mass is given in terms of the
flux density at 1.2 mm by,
 |
(4) |
The densities were determined from the masses assuming a mean mass per particle of
![]() and that the sources have spherical morphologies with
the radius given in Table 1. The distribution of densities is shown in the
bottom right panel of Fig. 3. The average density of our sample is
and that the sources have spherical morphologies with
the radius given in Table 1. The distribution of densities is shown in the
bottom right panel of Fig. 3. The average density of our sample is
![]() cm-3. The average surface density,
cm-3. The average surface density,
![]() ,
is
,
is ![]() g cm-2.
g cm-2.
The bolometric luminosities, listed in Col. 11 of Table1, were calculated
by integrating the SED. The distribution of luminosities is shown in the middle
right panel of Fig. 3. The average luminosity of
![]() corresponds to that of a O6.5 ZAMS star. The median luminosity is
corresponds to that of a O6.5 ZAMS star. The median luminosity is
![]() ,
therefore the source of energy of half of our objects would
correspond to stars with spectral type of O8 or earlier if they are excited by
a single star. Our sample does, however, contain a few low luminosity objects
such as IRAS 08076-3556 (Persi et al. 1994) and IRAS 11590-6452 (Bourke et al.
1997). Most of our sources (91%) have luminosities
,
therefore the source of energy of half of our objects would
correspond to stars with spectral type of O8 or earlier if they are excited by
a single star. Our sample does, however, contain a few low luminosity objects
such as IRAS 08076-3556 (Persi et al. 1994) and IRAS 11590-6452 (Bourke et al.
1997). Most of our sources (91%) have luminosities ![]() 10
10
![]() ,
which correspond to that of a star B0.5 (Panagia 1973).
,
which correspond to that of a star B0.5 (Panagia 1973).
The 1.2-mm emission associated with the IRAS sources exhibits a variety of morphologies. Filaments are seen in 24% of the sources, 23% show clumpy morphologies and 53% have regular shapes. The mechanisms of formation of massive and dense cores are still poorly known and the variety of structures seen in the maps illustrates the complexity of the problem. The common appearance of filaments in our maps, as well as in other star forming regions (e.g., Mizuno et al. 1995), suggests that gravitational instabilities in filaments are likely to be an important mechanism of core formation (Larson 1985; Tilley & Pudritz 2003). The clumpy structure could be explained if the cores are formed by turbulent shocks (Padoan et al. 2001). Therefore, both gravitational fragmentation and turbulent shocks seem to play a fundamental role for the origin of the massive and dense cores. The present survey provides a wealth of observational data to further explore the rol of filamentary structure in massive star formation.
![\begin{figure}
\par\mbox{\includegraphics[width=2.5in,height=2.5in,clip]{0755fig...
...\includegraphics[width=2.5in,height=2.5in,clip]{0755f010.eps} }
\par\end{figure}](/articles/aa/full/2004/40/aa0755/Timg75.gif) |
Figure 3:
Distribution of parameters of 1.2-mm cores associated with high-mass
star forming regions. Upper left: size distribution. The averageradius is
|
| Open with DEXTER | |
Figure 4 shows an histogram of the luminosity-to-mass ratio. The average value
of L/M for our sample is
![]() .
Comparisons with
other works need a scaling of the opacities. Mueller et al. (2002) and Beuther
et al. (2002) reported average values of
.
Comparisons with
other works need a scaling of the opacities. Mueller et al. (2002) and Beuther
et al. (2002) reported average values of ![]() and
and
![]() ,
respectively, which rescaled to our opacity of
1 cm2 g-1 correspond to values of 133 and 100
,
respectively, which rescaled to our opacity of
1 cm2 g-1 correspond to values of 133 and 100
![]() .
.
Sridharan et al. (2002) proposed that the L/M ratio is an indicator of cloud
evolution. To achieve this conclusion, they compared the luminosity-to-mass
ratio distribution of sources undetected in radio continuum surveys
(Parkes-MIT-NRAO or PMN survey, Griffith et al. 1994, and the 5 GHz Green Bank
survey, Gregory & Condon 1991) with that of sources associated with UC H II regions
reported by Hunter (1997) and Hunter et al. (2000). They found that
sources with no radio detections have lower values of L/M.
They suggested that this result can be explained if the embedded cluster
becomes more luminous with time. To corroborate this hypothesis we divided our
sample into two subsamples, those with and without radio continuum detections in
the PMN survey. The right panel of Fig. 4 shows the distribution of the luminosity-to-mass ratio
for both subsamples. The average value of L/M for cores associated
with UC HII regions is ![]() ,
whereas that of cores not associated with
UC HII regions is
,
whereas that of cores not associated with
UC HII regions is
![]() .
Applying the
Kolmogorov-Smirnov test to both subsamples we obtained a K-S statistics of 0.27
with a significance level of 0.007. Therefore, the null hypothesis (both
subsamples are from the same distribution) cannot be discarded.
.
Applying the
Kolmogorov-Smirnov test to both subsamples we obtained a K-S statistics of 0.27
with a significance level of 0.007. Therefore, the null hypothesis (both
subsamples are from the same distribution) cannot be discarded.
![\begin{figure}
\par\mbox{\includegraphics[width=2.5in,height=2.5in,clip]{0755f01...
...cm}
\includegraphics[width=2.5in,height=2.5in,clip]{0755f012.eps} }
\end{figure}](/articles/aa/full/2004/40/aa0755/Timg82.gif) |
Figure 4: Left: histogram of the distribution of the L/M ratio for the whole sample of cores. Right: luminosity-to-mass ratio of two subsamples. Dotted line: cores without radio detections; continuous line: cores associated with radio emission. The tail of low L/M in sources with no radio continuum detections is produced by contamination of low-mass cores with non-ionizing sources. |
| Open with DEXTER | |
In the following we describe an alternative approach to explain the difference in the
luminosity-to-mass ratio among dust cores assuming that all systems are roughly coeval.
Most of the IRAS sources in our sample are luminous
and thus are likely to host a cluster of young stars containing a massive star. Due to the
strong dependence of luminosity with mass, the total luminosity is dominated by the
most luminous member of the cluster. Thus it is
possible that the value of the L/M ratio is mainly determined by the most luminous
member of the cluster. In what follows we assess this hypothesis in
a simple way. Assuming a Salpeter initial mass function
(
![]() )
and using the mass-to-luminosity relation for stars,
)
and using the mass-to-luminosity relation for stars,
![]() (Bressan et al. 1993), we obtain that the mass and luminosity of the most massive
star of the cluster,
(Bressan et al. 1993), we obtain that the mass and luminosity of the most massive
star of the cluster, ![]() and
and ![]() respectively, are related to the
total luminosity of the cluster by the expression,
respectively, are related to the
total luminosity of the cluster by the expression,
![]() .
Figure 6 plots the
.
Figure 6 plots the
![]() ratio of the dust
cores (determined from the observations) versus
ratio of the dust
cores (determined from the observations) versus ![]() (derived using the
last expression), showing that there is a clear correlation between these quantities.
A robust estimation fit to the observed relationship gives
(derived using the
last expression), showing that there is a clear correlation between these quantities.
A robust estimation fit to the observed relationship gives
![]() .
We conclude that the luminosity-to-mass ratio can be interpreted as an indicator
of which type of star is the most conspicuous one of the cluster.
.
We conclude that the luminosity-to-mass ratio can be interpreted as an indicator
of which type of star is the most conspicuous one of the cluster.
Several surveys of molecular line emission toward massive star-forming regions (hereafter
MSFRs) have been carried out during the last decade (see Evans 1999 for a review).
The properties of massive and dense cores derived from these observations
are in good agreement with those derived by us using as tracer dust emission.
For instance, Plume et al. (1997) observed the CS(
![]() )
line emission toward several
MSFR and found that the cores have an average radius of 0.5 pc, and average
virial mass of
)
line emission toward several
MSFR and found that the cores have an average radius of 0.5 pc, and average
virial mass of
![]() and densities,
derived from large velocity gradient models, of
and densities,
derived from large velocity gradient models, of
![]() cm-3.
cm-3.
Large surveys of dust emission toward MSFRs have been recently reported by
Mueller et al. (2002) and Beuther et al. (2002). We note, beforehand, that since
different observational works using as probe the dust emission may assume different
opacities, a comparison needs a rescaling of the dust opacities. Mueller et al. (2002) carried out observations of dust emission at submillimeter wavelenghts
toward 51 MSFRs associated with water masers. The average luminosity of the sources in their
sample is
![]() ,
similar to that of the objects in our
sample (
,
similar to that of the objects in our
sample (
![]() ). They found that the cores in their sample
have an average radius of
). They found that the cores in their sample
have an average radius of
![]() pc, an average mass of
pc, an average mass of
![]() ,
and an average surface density of
,
and an average surface density of
![]() cm-2, in good
agreement with our results.
Beuther et al. (2002) made observations of dust emission at millimeter
wavelengths toward 69 MSFRs selected from Bronfman et al. (1996). The average luminosity of their
objects is
cm-2, in good
agreement with our results.
Beuther et al. (2002) made observations of dust emission at millimeter
wavelengths toward 69 MSFRs selected from Bronfman et al. (1996). The average luminosity of their
objects is
![]() ,
about ten times smaller than that of
the objects in our sample. They found that the cores have an average radius of
,
about ten times smaller than that of
the objects in our sample. They found that the cores have an average radius of
![]() pc, and (rescaled) average mass of
pc, and (rescaled) average mass of
![]() and average density of
and average density of
![]() cm-3. Their derived values are about
one order of magnitude smaller than the those derived by us, a difference most
likely due to the difference in luminosity of the two samples. Walsh et al. (2003) mapped
continuum emission at 1200, 850 and 450
cm-3. Their derived values are about
one order of magnitude smaller than the those derived by us, a difference most
likely due to the difference in luminosity of the two samples. Walsh et al. (2003) mapped
continuum emission at 1200, 850 and 450 ![]() m toward 71 fields of methanol masers.
A comparison of the maps at 1200, 850 and 450
m toward 71 fields of methanol masers.
A comparison of the maps at 1200, 850 and 450 ![]() m of the 14 sources in common between
this and our survey shows a very good agreement in the morphologies of the dust emission. Further, the flux density
dependence with frequency, in the range from 1200
m of the 14 sources in common between
this and our survey shows a very good agreement in the morphologies of the dust emission. Further, the flux density
dependence with frequency, in the range from 1200 ![]() m to 450
m to 450 ![]() m, are well fitted with power
law relationships of the form
m, are well fitted with power
law relationships of the form
![]() ,
with
,
with ![]() being in the range 3 to 4
with an average value of 3.5. This implies a power law index of the optical depth dependence with
frequency (see Sect. 3.2) of
being in the range 3 to 4
with an average value of 3.5. This implies a power law index of the optical depth dependence with
frequency (see Sect. 3.2) of
![]() ,
similar to those reported by Lis et al. (1998)
for Orion clouds.
,
similar to those reported by Lis et al. (1998)
for Orion clouds.
![\begin{figure}
\par\includegraphics[width=2.5in,height=2.5in,clip]{0755f013.eps}\end{figure}](/articles/aa/full/2004/40/aa0755/Timg105.gif) |
Figure 5: Histogram of the distribution of the number of sources per map. |
| Open with DEXTER | |
The dust temperatures of the sources in our sample (
![]() K) are similar to those derived
in other large scale surveys (Mueller et al. (2002),
K) are similar to those derived
in other large scale surveys (Mueller et al. (2002),
![]() K; Sridharan et al.
(2002),
K; Sridharan et al.
(2002),
![]() )
as well as in more limited surveys ( Molinari et al. (2000),
)
as well as in more limited surveys ( Molinari et al. (2000),
![]() K, Hunter (1997),
K, Hunter (1997),
![]() K). The derived temperatures are in good agreement with theoretical
calculations of temperature profiles of dust cocoons enshrouding UC HII regions
(Wolfire & Churchwell 1994).
K). The derived temperatures are in good agreement with theoretical
calculations of temperature profiles of dust cocoons enshrouding UC HII regions
(Wolfire & Churchwell 1994).
We have carried out a 1.2-mm continuum emission survey, using the bolometer
camera SIMBA at the SEST telescope, toward 146 galactic regions. Each mapped region
is about
![]() in size and is centered on an IRAS source
thought to be associated with a region of high-mass star formation. The main results are summarized as follows.
in size and is centered on an IRAS source
thought to be associated with a region of high-mass star formation. The main results are summarized as follows.
1.2-mm emission was detected toward all IRAS sources. We find that the 1.2-mm/IRAS objects, which are representative
of molecular cores harboring recently formed massive stars, have typically sizes of ![]() 0.4 pc, masses of
0.4 pc, masses of
![]() ,
densities of
,
densities of
![]() cm-3, dust temperatures of
cm-3, dust temperatures of ![]() 32 K, and luminosities of
32 K, and luminosities of ![]()
![]() .
.
The L/M ratios of the 1.2-mm/IRAS sources have an average value of 71
![]() .
We do not find statistically significant differences in the L/M ratios for
sources with and without detections in radio continuum surveys. We suggest that the difference in the
luminosity-to-mass ratio among the dust cores is related to the luminosity of the most massive star embedded within them
rather than being an indicator of the core evolutionary stage.
.
We do not find statistically significant differences in the L/M ratios for
sources with and without detections in radio continuum surveys. We suggest that the difference in the
luminosity-to-mass ratio among the dust cores is related to the luminosity of the most massive star embedded within them
rather than being an indicator of the core evolutionary stage.
Acknowledgements
We thank the SEST staff for the help in the observations, especially M. Nielbock for helping with the MOPSI software. S.F. thanks Fundación Andes for financial support. L.B., S.F. and J.M. acknowledge support by FONDECYT Grant 1010431. G.G. acknowledges support from the Chilean Centro de Astrofísica FONDAP 15010003.
![\begin{figure}
\par\includegraphics[width=2.5in,height=2.5in,clip]{0755f014.eps}
\end{figure}](/articles/aa/full/2004/40/aa0755/Timg329.gif) |
Figure 6:
Luminosity-to-mass ratio of the cores versus the luminosity of the most luminous star within the core. The equation
of the straight line, fitted using a robust estimator, is
|
| Open with DEXTER | |
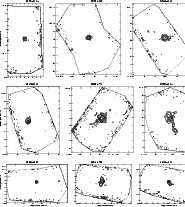 |
Figure 7:
Maps of the 1.2 mm emission IRAS name is given on top of each figure. Contour levels are |
| Open with DEXTER | |
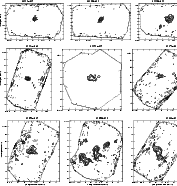 |
Figure 8:
Same as fig. 6. IRAS 12326-6245:
|
| Open with DEXTER | |
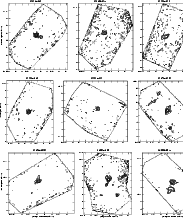 |
Figure 9:
Same as Fig. 6. IRAS 13295-6152:
|
| Open with DEXTER | |
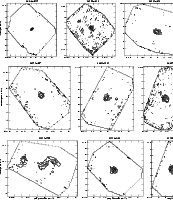 |
Figure 10: Same as Fig. 6. |
| Open with DEXTER | |
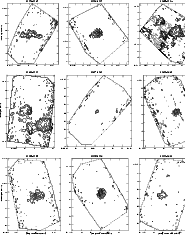 |
Figure 11:
Same as Fig. 6. IRAS 15384-5348:
|
| Open with DEXTER | |
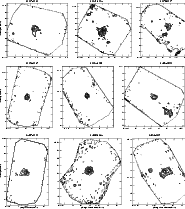 |
Figure 12:
Same as Fig. 6. IRAS 16060-5146 and 16065-5158:
|
| Open with DEXTER | |
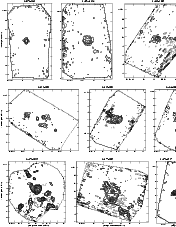 |
Figure 13:
Same as Fig. 6. IRAS 16071-5142:
|
| Open with DEXTER | |
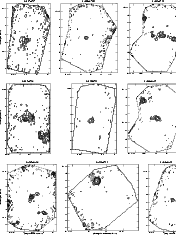 |
Figure 14:
Same as Fig. 6. IRAS 16304-4710:
|
| Open with DEXTER | |
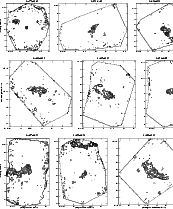 |
Figure 15:
Same as Fig. 6. IRAS 16372-4545:
|
| Open with DEXTER | |
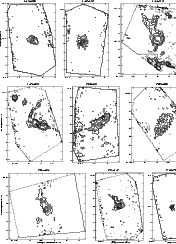 |
Figure 16:
Same than Fig. 6. IRAS 16562-3959 has
|
| Open with DEXTER | |
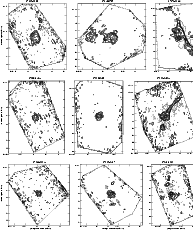 |
Figure 17:
Same as Fig. 6 IRAS 17175-3544, 17220-3609 and 17258-3637:
|
| Open with DEXTER | |
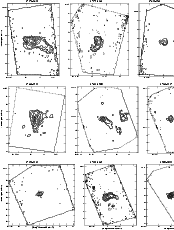 |
Figure 18:
Same as Fig. 6. IRAS 17439-2845, 17455-2800 and 17545-2357:
|
| Open with DEXTER | |
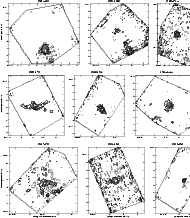 |
Figure 19:
Same as Fig. 6. IRAS 18075-2040:
|
| Open with DEXTER | |
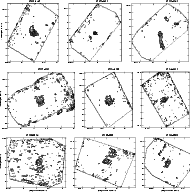 |
Figure 20:
Same as Fig. 6. IRAS 18290-0924:
|
| Open with DEXTER | |
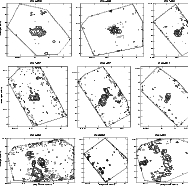 |
Figure 21: Same as Fig. 6. |
| Open with DEXTER | |
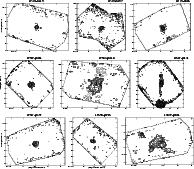 |
Figure 22:
Same as Fig. 6. IRAS 19078+0901:
|
| Open with DEXTER | |
 |
Figure 23: Same as Fig. 6. |
| Open with DEXTER | |