 |
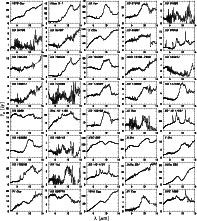
Figure 1:
The reduced 2.4-15 |
| Open with DEXTER | |
In the text
 |
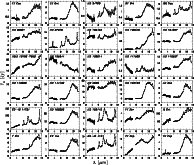
Figure 2:
The reduced 2-5-11.6 |
| Open with DEXTER | |
In the text
| |
Figure 3:
The reduced 5-15 |
| Open with DEXTER | |
In the text
 |
Figure 4: The PAH feature at 6.2 micron of HD 100546 in the SWS spectrum (dashed line) and in the PHT-S spectrum (full line). |
| Open with DEXTER | |
In the text
 |
Figure 5:
Diagram based on van Boekel et al. (2003). The ratio
|
| Open with DEXTER | |
In the text
 |
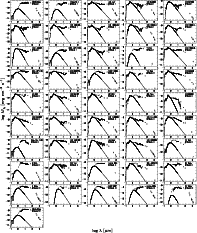
Figure 6: The spectral energy distributions of the sample stars. The squares are the observed photometric data from the literature with error bars. The solid line is the reddened Kurucz model for the stellar photosphere, fitted to the measured UV-optical photometry. The ISO spectra are plotted in the SEDs as well (noisy solid line). |
| Open with DEXTER | |
In the text
 |
Figure 7: The LF/CF ratio of PAH 7.7 micron versus PAH 6.2 micron. The filled diamonds with error bars indicate detected features, arrows represent upper limits. |
| Open with DEXTER | |
In the text
 |
Figure 8: Similar plot as Fig. 7. The LF/CFratio of PAH 6.2 micron versus PAH 3.3 micron. |
| Open with DEXTER | |
In the text
 |
Figure 9:
The logarithm of the ratio of the line fluxes of the PAH
features at 8.6 and 6.2 micron
|
| Open with DEXTER | |
In the text
 |
Figure 10: The LF/CF ratios of the amorphous 10 micron silicate feature (Si 9.7) versus the PAH 6.2 micron feature. Diamonds with error bars indicate detected features, arrows represent upper limits. Sources with the 10 micron feature in absorption have a negative LF/CF ratio. |
| Open with DEXTER | |
In the text
 |
Figure 11: The cumulative histogram of the PF/CF for the amorphous 10 micron silicate feature. The 24 sample stars in which this feature is in emission are included in this plot. The lower filled part of the bars represents group I sources, the upper part group II sources. |
| Open with DEXTER | |
In the text
 |
Figure 12:
Same type of plot as Fig. 9.
The logarithm of the ratio of the line fluxes of the PAH
features at 3.3 and 6.2 micron
|
| Open with DEXTER | |
In the text
 |
Figure 13:
The FWHM of the 11 micron feature versus the logarithm of
the ratio of the line fluxes of the features at 11 and 6.2 micron
|
| Open with DEXTER | |
In the text
 |
Figure 14:
The peak position of the detected 11 micron features versus
the ratio of the line fluxes of the 11 micron feature over the 6.2 PAH
feature
|
| Open with DEXTER | |
In the text
 |
Figure 15: The LF/CF ratios of the amorphous 10 micron silicate feature (Si 9.7) versus the 11 micron feature. Diamonds with error bars indicate detected features, arrows represent upper limits. Sources with the 10 micron feature in absorption have a negative LF/CF ratio. |
| Open with DEXTER | |
In the text
 |
Figure 16:
The inverted spectrum of Z CMa, and the emission band
spectra of HD 144432 and HD 163296. For Z CMa,
the figure shows the inverted continuum-divided, continuum-subtracted
flux
|
| Open with DEXTER | |
In the text
 |
Figure 17:
The Hertzsprung-Russel diagram for the sample stars. The
plotting symbols are proportional to the PAH luminosity. Filled
diamonds indicate detected emission, open symbols represent upper
limits. The full lines indicate the PMS evolutionary tracks of
stars with masses M = 1.5, 2, 3 and 5 |
| Open with DEXTER | |
In the text
 |
Figure 18: Similar plot as Fig. 17. The plotting symbols are proportional to the peak-over-continuum flux of the amorphous 10 micron silicate emission feature. |
| Open with DEXTER | |
In the text
 |
Figure 19:
The logarithm of the IR-excess luminosity
|
| Open with DEXTER | |
In the text
 |
Figure 20:
The PAH-over-UV luminosity
|
| Open with DEXTER | |
In the text
 |
Figure 21:
The PAH 7.7 micron luminosity
|
| Open with DEXTER | |
In the text
 |
Figure 22:
Similar plot as Fig. 5. The plotting symbols
are scaled proportional to the strength (
|
| Open with DEXTER | |
In the text
 |
Figure 23: Similar plot as Fig. 22 for the amorphous 10 micron silicate feature. The plotting symbols are scaled proportional to the LF/CF ratio of the feature. The filled diamonds indicate stars with a detected 10 micron emission feature, the open diamonds indicate upper limits. |
| Open with DEXTER | |
In the text
 |
Figure 24: Similar plot as Fig. 5. The filled symbols indicate UXORs, the open symbols are the other HAEBEs in this sample. The 3 UXOR stars that display clear PAH emission are VX Cas, HD 34282 and RR Tau. |
| Open with DEXTER | |
In the text
 |
Figure 25:
The amorphous 10 micron silicate band for 14 of the sample
stars. The figure shows the continuum-subtracted flux
|
| Open with DEXTER | |
In the text
 |
Figure 26:
The FWHM of the amorphous 10 micron silicate feature versus
the peak-over-continuum flux ratio PF/CF. Filled and open diamonds
refer to group I and group II sources respectively. The dashed line
represents the best fit to the data;
|
| Open with DEXTER | |
In the text