A&A 425, 1119-1124 (2004)
DOI: 10.1051/0004-6361:20040477
Detection of neutral sodium above Mercury during the transit on
2003 May 7
H. Schleicher 1 -
G. Wiedemann 2 -
H. Wöhl 1 -
T. Berkefeld 1 -
D. Soltau 1
1 - Kiepenheuer-Institut für Sonnenphysik,
Schöneckstr. 6, 79104 Freiburg, Germany
2 -
Hamburger Sternwarte,
Gojenbergsweg 112, 21029 Hamburg, Germany
Received 19 March 2004 / Accepted 1 June 2004
Abstract
The extent of the exosphere of Mercury above the planet's
limb could for the first time be observed by detecting an excess
absorption in the solar sodium line D2 during the transit of Mercury
across the solar disk on 2003 May 7. The observations were performed
with a 2d Fabry-Perot spectrograph of the Vacuum Tower Telescope at
Izaña, Tenerife. The absorption excess, blue-shifted by 13 pm
relative to the solar line, is mainly concentrated near the polar
regions. There, the absorption excess can be traced up to  700 km above the limb. Between the two polar regions, along the
eastern limb, a weaker absorption excess can be seen. A possible
streamer-like feature stretches more than 2000 km above the
northern region. Assuming the density to decrease exponentially with
height, we derive for the polar maxima vertical column densities of
700 km above the limb. Between the two polar regions, along the
eastern limb, a weaker absorption excess can be seen. A possible
streamer-like feature stretches more than 2000 km above the
northern region. Assuming the density to decrease exponentially with
height, we derive for the polar maxima vertical column densities of
 ,
volume densities at the surface of
,
volume densities at the surface of
 ,
and a density scale height of 150 km.
,
and a density scale height of 150 km.
Key words: planets and satellites: individual: Mercury
The existence of Mercury's exosphere has been known since the fly-by
of Mariner 10 (Bradfood et al. 1976). It was nevertheless a
surprise that Potter & Morgan (1985) detected narrow
emission lines at the sun-illuminated disk, superimposed on the solar
absorption resonance lines of sodium. In the meantime, the existence
of such emission has been established by several other observations,
not only in the sodium lines, but also in the resonance lines of
potassium (Potter & Morgan 1986) and calcium (Bida et al. 2000).
The line emission is seen on the illuminated part of the
planet's disk. Although ground-based observations are strongly
hampered by seeing effects, there are indications that the emission
varies in time and is not uniformly distributed over the surface, with
a preference of being concentrated near the polar regions (Potter et al. 1999). Killen et al. (1990) derived sodium
atom column densities of several
 .
The
atoms (other than H, He, O) forming the exosphere are
sputtered from the planet's surface by solar wind particles and/or by
solar EUV photons. An additional release mechanism might be
bombardment by meteorites. After ionization by the solar UV radiation, the ions interact with Mercury's magnetic field which might
explain the inhomogeneous nature of the exosphere. For models of the
exosphere see, e.g., Ip (1993), or Lammer et al. (2003).
.
The
atoms (other than H, He, O) forming the exosphere are
sputtered from the planet's surface by solar wind particles and/or by
solar EUV photons. An additional release mechanism might be
bombardment by meteorites. After ionization by the solar UV radiation, the ions interact with Mercury's magnetic field which might
explain the inhomogeneous nature of the exosphere. For models of the
exosphere see, e.g., Ip (1993), or Lammer et al. (2003).
In the above cited observations, the line emission is seen
projected on the illuminated part of the planet's disk. Here, we
report the first successful detection of absorption above
the limb of Mercury due to the planet's exosphere in the sodium
resonance line D2 (
 nm) on occasion of the transit on 2003 May 7.
2 Observation and data reduction
We observed the transit of Mercury across the solar disk on 2003 May 7 with the Vacuum Tower Telescope VTT (Schröter et al. 1985) at the Observatorio del Teide in Izaña at
Tenerife. Using the two-dimensional Fabry-Perot spectrograph TESOS
(Kentischer et al. 1998; Tritschler et al. 2002) we
scanned the central part of the Na D2 line, with a spectral resolution
of 2 pm and oversampling by a factor 2.2. Because of the telecentric
mounting of the etalons, the wavelength of transmission maximum does not
significantly vary over the field-of-view; residual effects are suppressed
when applying the standard CCD flat-field correction. Image degradation due
to seeing was compensated by the adaptive optics system KAOS (Soltau et al. 2002). Observational parameters are given in Table 1.
Table 1:
Observational parameters.
The sky was cloudless, the seeing varied between 2'' and 1''. Thanks to
the AO-system, the residual seeing effects were  0.5'', except
for instances of very bad seeing. The observations of the transit
started at 8 UT when the sun was
0.5'', except
for instances of very bad seeing. The observations of the transit
started at 8 UT when the sun was  above horizon, 10 min
after the planet had crossed the solar meridian. Since the transit
campaign was devoted to several topics, scans of the Na D2 line
were done for somewhat less than 1 h during the final two hours of
the transit, yielding 130 scans in total. However, in many scans
Mercury was near or even outside the field-of-view boundary of the
TESOS spectrograph because the planet had intentionally been offset several
times in order to test the performance of the AO system KAOS.
above horizon, 10 min
after the planet had crossed the solar meridian. Since the transit
campaign was devoted to several topics, scans of the Na D2 line
were done for somewhat less than 1 h during the final two hours of
the transit, yielding 130 scans in total. However, in many scans
Mercury was near or even outside the field-of-view boundary of the
TESOS spectrograph because the planet had intentionally been offset several
times in order to test the performance of the AO system KAOS.
For the search of an absorption excess, the best 22 scans were selected
according to the following criteria:
- planet center >12'' (one disk diameter) away from field-of-view
boundary;
- pointing stability during the scan <1'';
- contrast of solar granules above a sufficient threshold.
Each scan consists of a set of 92 filter images ("frames'') with
2 pm spectral resolution, the central wavelength increasing from
frame to frame by 0.89 pm because of the step-wise incrementation
of the plate separations of the three Fabry-Perot etalons. Hence,
from the set of 92 frames, the spectral information (here: the central
0.08 nm of the D2 line) can be obtained for each pixel inside the
field-of-view.
For each frame of a scan (hence, for each wavelength step) intensity counts
are extracted according to the following steps:
- Determination of the disk center (accuracy


 ));
));
- pixel-step sampling of counts along concentric circles with radii
increasing from 5.2'' to 10.8'', corresponding to distances
of -321 km to +1961 km away from Mercury's limb (the planet's
disk had an apparent radius of 6.0'');
- averaging over
 azimuthal bins to suppress noise.
In total, "local'' profiles of the Na D2 line for 65 radial distances r and for 24 azimuthal directions  are obtained for
each scan.
For each scan we construct a "reference profile'' by
averaging the profiles over the outmost 16 sampled circles (>9.5'' off
the planetary limb) and all azimuthal directions. Comparison of line
profiles from the near vicinity of Mercury's disk with the reference will
reveal any additional absorption produced by Mercury's exosphere. During the
transit the radial velocity of Mercury relative to the Earth was -4.6 km s-1,
while the radial velocity of the Sun (including gravitational redshift)
increased from +1.40 km s-1 to +2.29 km s-1 because of the increasing influence
of the solar rotation when Mercury was moving towards the western solar limb.
The additional absorption due to the exosphere, if present, should therefore
show up as a depression in the solar Na D2 profile, blue-shifted by
12.1-13.5 pm relative to the center of the the solar line.
Figure 1 shows a typical local line profile together with the
reference. The absorption excess at distance r and azimuth
is determined, after applying several corrections, as the relative
intensity difference between the reference profile
are obtained for
each scan.
For each scan we construct a "reference profile'' by
averaging the profiles over the outmost 16 sampled circles (>9.5'' off
the planetary limb) and all azimuthal directions. Comparison of line
profiles from the near vicinity of Mercury's disk with the reference will
reveal any additional absorption produced by Mercury's exosphere. During the
transit the radial velocity of Mercury relative to the Earth was -4.6 km s-1,
while the radial velocity of the Sun (including gravitational redshift)
increased from +1.40 km s-1 to +2.29 km s-1 because of the increasing influence
of the solar rotation when Mercury was moving towards the western solar limb.
The additional absorption due to the exosphere, if present, should therefore
show up as a depression in the solar Na D2 profile, blue-shifted by
12.1-13.5 pm relative to the center of the the solar line.
Figure 1 shows a typical local line profile together with the
reference. The absorption excess at distance r and azimuth
is determined, after applying several corrections, as the relative
intensity difference between the reference profile
 and local profile
 according to
The factor
 ,
derived from matching the wing
intensities of the two profiles, corrects the diminution of light
near the planet's disk due to scattering (the missing light is
scattered onto the disk). The "Doppler compensation''
,
derived from matching the wing
intensities of the two profiles, corrects the diminution of light
near the planet's disk due to scattering (the missing light is
scattered onto the disk). The "Doppler compensation''
 is applied to correct small wavelength shifts due to
large-scale solar velocity variability and is determined by matching
the very line cores of the profiles. As can be seen in Fig. 1, the extracted profiles exhibit a periodic intensity modulation in wavelength. This effect is caused by an imperfect plate of one of the three etalons of the spectrograph. The modulation
nearly cancels when taking the difference between the local and reference
profile; nevertheless, we cleaned all profiles by applying a suitable Fourier
filter.
is applied to correct small wavelength shifts due to
large-scale solar velocity variability and is determined by matching
the very line cores of the profiles. As can be seen in Fig. 1, the extracted profiles exhibit a periodic intensity modulation in wavelength. This effect is caused by an imperfect plate of one of the three etalons of the spectrograph. The modulation
nearly cancels when taking the difference between the local and reference
profile; nevertheless, we cleaned all profiles by applying a suitable Fourier
filter.
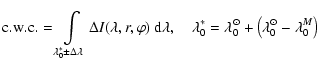
Finally, the equivalent widths
 are
computed by integrating the relative intensity differences over 14 wavelength
steps around the expected center of the Mercury absorption line and apply a
"core-width correction'':
are
computed by integrating the relative intensity differences over 14 wavelength
steps around the expected center of the Mercury absorption line and apply a
"core-width correction'':
| |
|
 |
(3) |
| |
|
 |
|
 and
and
 are the predicted line center
wavelengths of the Mercury absorption line and the solar line. The
core-width correction c.w.c. accounts for spatial
variability of the width of the line cores and is estimated by
integrating
are the predicted line center
wavelengths of the Mercury absorption line and the solar line. The
core-width correction c.w.c. accounts for spatial
variability of the width of the line cores and is estimated by
integrating
 in the red line
core over the wavelength interval of the Mercury feature, mirrored around
the center of the solar profile. This correction assumes that
the cores of the solar Na D2 line profiles are symmetric. It
should be mentioned that the "Doppler'' - and "core-width
correction'' are not essential regarding the qualitative
results. Applying these corrections reduces significantly the noise
of the data, however. The achieved accuracy of
is mainly limited by the spatial variability of the solar line profile. The local values obtained in
areas not influenced by Mercury are scattering around zero by
0.3 pm rms for single scans; the rms of the median over the
22 selected scans is 0.07 pm, with no systematic variation
along the azimuth. Figure 2
shows the difference between the local profile shown in Fig. 1 and its reference, normalized by the latter. Although the noise is substantial, the existence of an absorption
excess at the predicted wavelength is evident (brown area).
in the red line
core over the wavelength interval of the Mercury feature, mirrored around
the center of the solar profile. This correction assumes that
the cores of the solar Na D2 line profiles are symmetric. It
should be mentioned that the "Doppler'' - and "core-width
correction'' are not essential regarding the qualitative
results. Applying these corrections reduces significantly the noise
of the data, however. The achieved accuracy of
is mainly limited by the spatial variability of the solar line profile. The local values obtained in
areas not influenced by Mercury are scattering around zero by
0.3 pm rms for single scans; the rms of the median over the
22 selected scans is 0.07 pm, with no systematic variation
along the azimuth. Figure 2
shows the difference between the local profile shown in Fig. 1 and its reference, normalized by the latter. Although the noise is substantial, the existence of an absorption
excess at the predicted wavelength is evident (brown area).
![\begin{figure}
\par\includegraphics[width=8cm,clip]{0477fig1.eps} \end{figure}](/articles/aa/full/2004/39/aa0477-04/Timg37.gif) |
Figure 1:
Profile of Na D2 extracted 214 km above Mercury's limb in the
northern polar region. Black: original local profile,
green: Doppler compensated reference profile,
red: local profile, multiplied by a factor f (see Eq. (2)) to match the
wing intensities of the reference. Thered and green profile have
been cleaned as described in the text.
The vertical red line marks the predicted location ofthe line
center of the Mercury absorption feature, the vertical green line
is the predicted location of the line center of the solar line.
The green dashed line indicates the Doppler shift
between local
and reference profile. The excess absorption due to Mercury's
exosphere is the difference between the green and red profile
around the expected central wavelength and is emphasized by the
brown area. The red area in the red line wing is the
"core-width correction'' (see text). The vertical dashed brown
and red lines mark the integration boundaries used to retrieve
the equivalent width of the absorption excess and the
core-width correction. |
| Open with DEXTER |
![\begin{figure}
\par\includegraphics[width=8cm,clip]{0477fig2.eps} \end{figure}](/articles/aa/full/2004/39/aa0477-04/Timg38.gif) |
Figure 2:
Difference between the local and reference profile shown in
Fig. 1. The counts have been normalized by the
counts of the reference. Positive values indicate excess of
absorption. The brown area is proportional to the uncorrected
equivalent width W of the absorption excess.
The red area will be subtracted from W
to correct for
spatial variability of the width of the solar line
("core-width correction'', see text).
Around the center of the solar line, the values are very noisy
due to the low intensity level (dashed part of the difference
profile).
of the absorption excess.
The red area will be subtracted from W
to correct for
spatial variability of the width of the solar line
("core-width correction'', see text).
Around the center of the solar line, the values are very noisy
due to the low intensity level (dashed part of the difference
profile). |
| Open with DEXTER |
![\begin{figure}
\par\includegraphics[width=8cm,clip]{0477fig3.eps} \end{figure}](/articles/aa/full/2004/39/aa0477-04/Timg39.gif) |
Figure 3:
Same as Fig. 2, difference-profile averaged
in radial direction over 214 km (0.5'') and median averaged over
the 22 selected scans. |
| Open with DEXTER |
We can exclude several possible effects that might
produce artificial line depression of the kind seen in Figs. 1-3:
- An absorption blend of solar or telluric origin, if present at the
wavelengths in question, would be compensated for by the subtraction of
the local profile from the reference.
- Seeing influences produce scatter randomly distributed along the
profiles; of course, line profiles obtained near Mercury's limb are
more affected than the reference. For an individual profile scan,
seeing might produce an artificial distortion affecting several
wavelength steps in sequence. However, it is very unlikely that for
many scans always the same wavelength points are affected in the same
manner. Seeing is, however, an important source of the data noise.
- Differences between local and reference profile of solar origin
(center-to-limb variation, large-scale velocity field and temperature
inhomogeneities of the chromosphere) are compensated as described above
(correction terms
,
and c.w.c., Eqs. (2),
(4)); even when these corrections are neglected, the
results do not change qualitatively.
- Systematic variation of the general intensity level has been corrected
by the position dependent factor
,
Eq. (2).
This factor, determined in the line wings, includes effects of scattered
light (main effect) and gradients over the field-of-view due to the
solar center-to-limb variation, the latter is noticeable only for the
very last scans before the 3rd contact. Even if not been corrected
properly, the whole line profile would be affected, not just a few
wavelength steps, and large-scale variations over the field-of-view
should be seen, which is not the case.
![\begin{figure}
\par\includegraphics[width=13.7cm,clip]{0477fig4.eps} \end{figure}](/articles/aa/full/2004/39/aa0477-04/Timg40.gif) |
Figure 4:
Distribution of observed equivalent widths  above
Mercury's limb.
above
Mercury's limb.
 is the distance from the
planetary limb.
Inside the disk (
is the distance from the
planetary limb.
Inside the disk (
 ), the equivalent widths
are multiplied with the relative intensity distribution of the
scattered light. ), the equivalent widths
are multiplied with the relative intensity distribution of the
scattered light. |
| Open with DEXTER |
Figures 2 and 3 show the profile
differences at a location 215 km above the northern
planetary limb. Even for a single scan and no radial averaging
(Fig. 2) the signal for an excess absorption at the
predicted wavelengths is high (
 ). Since we
find an additional line depression of comparable strength only near
Mercury's limb, we are confident that this depression must be due to
excess absorption by the exosphere of the planet. In Fig. 3, where we have averaged the profile differences
over 0.5'' (about the achieved spatial resolution) and over all
selected scans, some non-significant deviations from zero are seen
around the center of the solar profile. We ascribe these deviations to
an artifact produced by a small over-estimation of the
"Doppler compensation'' (see Chap. 2). One must be
aware, that any small deviation of local and reference profile near
the solar line center is magnified strongly by the normalization with
the reference profile and due to the fact that the solar D2 line
is very dark in its center.
In Fig. 4 the spatial distribution of the
equivalent widths
). Since we
find an additional line depression of comparable strength only near
Mercury's limb, we are confident that this depression must be due to
excess absorption by the exosphere of the planet. In Fig. 3, where we have averaged the profile differences
over 0.5'' (about the achieved spatial resolution) and over all
selected scans, some non-significant deviations from zero are seen
around the center of the solar profile. We ascribe these deviations to
an artifact produced by a small over-estimation of the
"Doppler compensation'' (see Chap. 2). One must be
aware, that any small deviation of local and reference profile near
the solar line center is magnified strongly by the normalization with
the reference profile and due to the fact that the solar D2 line
is very dark in its center.
In Fig. 4 the spatial distribution of the
equivalent widths
 of the absorption excess is
shown. Here, and for all further discussion, the data are median values of the
22 selected scans. The zero-point of the azimuthal variable
is the
direction of the normal to Mercury's orbital plane which nearly coincides with
the direction of the rotation axis. We could determine the orientation
of the orbital plane in the spectrograph images to within
of the absorption excess is
shown. Here, and for all further discussion, the data are median values of the
22 selected scans. The zero-point of the azimuthal variable
is the
direction of the normal to Mercury's orbital plane which nearly coincides with
the direction of the rotation axis. We could determine the orientation
of the orbital plane in the spectrograph images to within  .
The results, as derived directly from
the observations, can be summarized as follows:
.
The results, as derived directly from
the observations, can be summarized as follows:
- 1.
- Above both polar regions an absorption excess of high significance is
seen. The maxima of excess absorption occur at azimuth angles
 and
and  west of the north and south direction, rsp.
- 2.
- The maximal equivalent width
at both polar regions of
1.5 pm occurs immediately at the planetary limb. The
southern absorption can be traced up to 700 km above the limb, where
approaches the detection limit of 0.1 pm.
- 3.
- At both polar regions the absorption is concentrated within two
azimuthal segments of
 (1900 km) along the limb.
- 4.
- No excess absorption above the detection limit is found along the eastern
planetary limb. A weak absorption with
 pm can be detected along the western limb,
connecting the two polar regions.
pm can be detected along the western limb,
connecting the two polar regions.
- 5.
- Above the northern maximum, at azimuth
 W, a streame-like
excess absorption with
W, a streame-like
excess absorption with
 pm is found which
can be traced in radial direction to the boundary of measurements,
1900 km above Mercury's limb. Since the strength of absorption is near
the detection limit, the reality of this feature is questionable,
however.
pm is found which
can be traced in radial direction to the boundary of measurements,
1900 km above Mercury's limb. Since the strength of absorption is near
the detection limit, the reality of this feature is questionable,
however.
- 6.
- The wavelength dependence of the excess absorption (see Fig. 3) can be approximated by a Gaussian profile

 with
with
 pm. Taking into account the spectral resolution
of the spectrograph, the intrinsic Doppler width is 3.1
0.1 pm,
corresponding to a velocity distribution along the line-of-sight
of 1.6
0.1 km s-1. No significant spatial variation of the
line widths is found.
pm. Taking into account the spectral resolution
of the spectrograph, the intrinsic Doppler width is 3.1
0.1 pm,
corresponding to a velocity distribution along the line-of-sight
of 1.6
0.1 km s-1. No significant spatial variation of the
line widths is found.
![\begin{figure}
\par\includegraphics[width=14.8cm,clip]{0477fig5.eps} \end{figure}](/articles/aa/full/2004/39/aa0477-04/Timg53.gif) |
Figure 5:
Height dependence of equivalent widths. The black, marked curves
are values observed above the northern pole. The non-vanishing
values for
 and
and
 km
can be ascribed to the "streamer'' feature. The unmarked curves
have been calculated, as described in the text. The used
combinations of scale height H and particle density km
can be ascribed to the "streamer'' feature. The unmarked curves
have been calculated, as described in the text. The used
combinations of scale height H and particle density
 are given in the legend, together with the resulting column densities
 and line center
optical depths along the grazing line-of-sight,
and line center
optical depths along the grazing line-of-sight,
 .
The red curve is the best fit
for .
The red curve is the best fit
for
 ,
see also Table 2. ,
see also Table 2. |
| Open with DEXTER |
Table 2:
Results of spectral analysis.
In order to derive the density distribution of the sodium atoms, the influence
of light scattering on the observed distribution of the equivalent widths
must be taken into account. We proceed as follows:
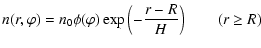
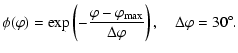
In the vicinity of the polar maxima the density distribution
 of the neutral sodium atoms in the ground state at distance r from Mercury's
center and azimuthal angle
is modeled by (R the radius of Mercury)
of the neutral sodium atoms in the ground state at distance r from Mercury's
center and azimuthal angle
is modeled by (R the radius of Mercury)
| |
|
 |
(4) |
| |
|
 |
|
The line absorption coefficient per volume:
| |
|
 |
(5) |
| |
|
 |
|
is integrated along each line-of-sight to obtain the optical depth
 ,
from which the relative intensity at
location
,
from which the relative intensity at
location
 is calculated:
 |
|
|
(6) |
This intensity distribution, affected by the exosphere, and the un-affected
solar intensity
are folded with a scattering function  ,
which we have constructed
by a weighted sum of two Gaussians and a flat distribution such that the
observed distribution of stray light inside Mercury's disk could be
reproduced. The resulting calculated intensity difference
,
which we have constructed
by a weighted sum of two Gaussians and a flat distribution such that the
observed distribution of stray light inside Mercury's disk could be
reproduced. The resulting calculated intensity difference
 |
|
|
(7) |
and the corresponding equivalent widths
are compared with the observed values. The free parameters n0 and H are chosen such to give a reasonable fit. For the Doppler width
 we set = 3.1 pm, as derived from the observed wavelength shape of the absorption excess (Fig. 3).
There is some ambiguity in the choice of n0 and H in the sense that a lower value for H can be compensated by a higher value for n0. Figure 5 shows the
height dependence of observed equivalence widths together with that of
synthetic ones for several combinations of H and n0.
The results of this analysis are given in Table 2 for four
locations along Mercury's limb.
we set = 3.1 pm, as derived from the observed wavelength shape of the absorption excess (Fig. 3).
There is some ambiguity in the choice of n0 and H in the sense that a lower value for H can be compensated by a higher value for n0. Figure 5 shows the
height dependence of observed equivalence widths together with that of
synthetic ones for several combinations of H and n0.
The results of this analysis are given in Table 2 for four
locations along Mercury's limb.
In this paper, we report on the first successful attempt to detect the
sodium exosphere of Mercury by a line absorption effect outside
the planet's limb. These observations are in several aspects
complementary to the observations of line emission at the
sun-illuminated side part of the disk. The emission displays the
two-dimensional distribution of the exospheric sodium, with the
height dimension being projected. In our case, we directly see the
height distribution of the absorbing matter, restricted to the
planet's terminator, however. The observed emission in the
Na D lines is mainly produced by resonance scattering, with some contribution
due to cascading following recombination of sodium ions, the latter depending
on the concentration of the sodium ions. The absorption detected by us
depends only on the number of neutral sodium atoms at ground state along the
line-of-sight. Unfortunately, transits are rare events (next will be
2006-Nov.-08). Stellar occultations can provide additional absorption
determinations, restricted, however, at two opposite azimuthal positions.
In view of the non-uniform distribution of the exospheric matter, occultations
may often fail to yield a positive absorption signal.
The observed concentration of the sodium exosphere above the polar
caps is a strong hint that the dipole-like magnetic field of Mercury
plays an important rôle for the formation of the exosphere, either
by directing the eroding solar wind towards the polar regions (Ip & Kopp 2002) or, more indirectly, by influencing transport mechanisms
of sodium, leading to an enhancement at the polar surfaces. Polar
concentrations have also frequently been observed in line emission (Potter &
Morgan 1990; Sprague et al. 1997, e.g.). Along the
western planetary limb (the sun rising terminator),
we find a sodium density 40% of that above the poles,
but no significant absorption could be detected along the eastern
planetary limb (the sun setting terminator). Differences between
morning - and evening terminator of the same sense were also found by
Sprague et al. (1997) from observations of line emission between
1985-1988. Several theoretical investigations on transport mechanisms
(Ip 1990, 1993; Sprague 1992) predict
enhancement of re-impacting sodium at the night-side surface of Mercury,
with subsequent "evaporation'' at sun rise.
For the column densities of neutral sodium above the polar caps we
find (3 
 ). This is lower
than typical values of several
derived
from emission line spectroscopy, but are within the range found by
Sprague et al. (1997). During the days before the
Mercury transit, the solar activity was at a relative low level
(relative sunspot numbers 65-93), and no geoeffective coronal mass
ejections were reported; a huge coronal hole existed at the southern
hemisphere producing a high speed wind. Observations of the line emission
at the sun illuminated part of Mercury's disk, although strongly influenced
by seeing, indicate considerable variability of the distribution and strength
of the emission (Potter et al. 1999; Killen et al. 2001). The exosphere of Mercury seems to be far from being static
and each individual observation gives only a snapshot of its physical state.
). This is lower
than typical values of several
derived
from emission line spectroscopy, but are within the range found by
Sprague et al. (1997). During the days before the
Mercury transit, the solar activity was at a relative low level
(relative sunspot numbers 65-93), and no geoeffective coronal mass
ejections were reported; a huge coronal hole existed at the southern
hemisphere producing a high speed wind. Observations of the line emission
at the sun illuminated part of Mercury's disk, although strongly influenced
by seeing, indicate considerable variability of the distribution and strength
of the emission (Potter et al. 1999; Killen et al. 2001). The exosphere of Mercury seems to be far from being static
and each individual observation gives only a snapshot of its physical state.
The Doppler width of the excess absorption profile corresponds to a rms
velocity of 1.6 km s-1 along the line-of-sight. If completely of thermal
origin, a kinetic temperature of the sodium atoms would be 3540 K, which is much larger than the 500 K derived from the width of emission lines
(Potter & Morgan 1985). Assuming
Tk = 500 K, a
non-thermal rms velocity of 1 km s-1 along the line-of-sight would explain
the observed width of the absorption feature.
The transit of a planet in front of its central star not only blocks
the integral stellar light in proportion to the occulting area of its
disk but also has a spectral signature in the strong resonance
lines, analogous to what we have seen during the recent Mercury
transit. Since spectral photometry, being a relative measurement, can
in principle be achieved with a much higher sensitivity than absolute
photometry, monitoring stars for such spectral changes is a tool to
study exosolar planets. Integrating the profile differences in an
annulus around Mercury and multiplying the result with the
area ratio of the sampling annulus to that of the solar disk (from a
view point at infinity) we find that at the central wavelength of the
Mercury absorption feature the disk-integrated solar Na D2 profile
would show an additional absorption dip of 10-6 of the
undisturbed intensity at this profile point.
Acknowledgements
The observations were done with the VTT on Tenerife, being operated by the
Kiepenheuer-Institut für Sonnenphysik
(Freiburg) at the Observatorio del Teide of the Instituto de Astrofísica
de Canarias. We thank Horst Balthasar (Astrophysikalisches Institut Potsdam)
for helpful discussions and the referee for comments leading to
improvements of the paper.
- Bida, T. A., Killen, R.
M., & Morgan, T. H. 2000, Nature, 404, 159 [NASA ADS] [CrossRef] (In the text)
- Bradfoot, A. L.,
Shemansky, D. E., & Kumar, S. 1976, Geophys. Res. Lett., 3,
577 [NASA ADS] (In the text)
- Ip, W.-H. 1990, ApJ, 356,
675 [NASA ADS] [CrossRef] (In the text)
- Ip, W.-H. 1993, ApJ, 418,
451 [NASA ADS] [CrossRef] (In the text)
- Ip, W.-H., & Kopp,
A. 2002, J. Geophys. Res., 107, 1348 [NASA ADS] (In the text)
- Kentischer, T., Schmidt,
W., Sigwarth, M., & v. Uexküll, M. 1998, A&A, 340,
569 [NASA ADS] (In the text)
- Killen, R. M., Potter,
A. E., & Morgan, T. H. 1990, Icarus, 85, 145 [NASA ADS] [CrossRef] (In the text)
- Killen, R. M.,
Potter, A. E., Reiff, P., et al. 2001, J. Geophys. Res., 106,
20509 [NASA ADS] [CrossRef] (In the text)
- Lammer, H., Wurz, P.,
Patel, M. R., et al. 2003, Icarus, 166, 238 [NASA ADS] [CrossRef] (In the text)
- Potter, A. E.,
& Morgan, T. H. 1985, Science, 229, 651 [NASA ADS] (In the text)
- Potter, A. E., &
Morgan, T. H. 1986, Icarus, 67, 336 [NASA ADS] [CrossRef] (In the text)
- Potter, A. E., &
Morgan, T. H. 1990, Science, 248, 835 [NASA ADS] (In the text)
- Potter, A. E.,
Killen, R. M., & Morgan, T. H. 1999, Planetary and Space
Science, 47, 1441 [NASA ADS] [CrossRef] (In the text)
- Schröter, E. H.,
Soltau, D., & Wiehr, E. 1985, Vistas in Astronomy, 28, 519 [NASA ADS] [CrossRef] (In the text)
- Sprague, A. L. 1992,
J. Geophys. Res., 97, 18257 [NASA ADS] (In the text)
- Sprague, A. L.,
Kozlowski, R. W. H., Hunten, D. M., et al. 1997, Icarus, 129,
506 [NASA ADS] [CrossRef] (In the text)
- Soltau, D., Berkefeld, T.,
v.d. Lühe, O., Wöger, F., & Schelenz, T. 2002,
Astron. Nachr., 323, 236 [NASA ADS] [CrossRef] (In the text)
- Tritschler, A., Schmidt, W.,
Langhans, K., & Kentischer, T. 2002, Sol. Phys., 211, 17 [NASA ADS] [CrossRef] (In the text)
Copyright ESO 2004
![\begin{figure}
\par\includegraphics[width=8cm,clip]{0477fig1.eps} \end{figure}](/articles/aa/full/2004/39/aa0477-04/img37.gif)
![\begin{figure}
\par\includegraphics[width=8cm,clip]{0477fig2.eps} \end{figure}](/articles/aa/full/2004/39/aa0477-04/img38.gif)
![\begin{figure}
\par\includegraphics[width=8cm,clip]{0477fig3.eps} \end{figure}](/articles/aa/full/2004/39/aa0477-04/img39.gif)
![\begin{figure}
\par\includegraphics[width=13.7cm,clip]{0477fig4.eps} \end{figure}](/articles/aa/full/2004/39/aa0477-04/img40.gif)
![\begin{figure}
\par\includegraphics[width=14.8cm,clip]{0477fig5.eps} \end{figure}](/articles/aa/full/2004/39/aa0477-04/img53.gif)