A&A 425, 671-681 (2004)
DOI: 10.1051/0004-6361:20035753
Chemical abundances of 10 metal-poor halo stars
G. S. Bai1 - G. Zhao1 - Y. Q. Chen1 - J. R. Shi1 - V. G. Klochkova2 - V. E. Panchuk2 - H. M. Qiu1 - H. W. Zhang1,3
1 - National Astronomical Observatories, Chinese Academy of Sciences, Beijing 100012, PR China
2 - Special Astrophysical Observatory, Russian Academy of Sciences,
Karachai-Cirkassian Republic, Nizhnij Arkhyz 369167, Russia
3 - Department of Astronomy, School of Physics, Peking University, Beijing 100871, PR China
Received 27 November 2003 / Accepted 3 May 2004
Abstract
We present observations of ten metal-poor halo stars
with the metallicity range -2.3 < [Fe/H] < -1.4 and derive
their stellar parameters, acquire some elemental abundances
relative to iron and discuss the relation between the abundance
ratio and the metallicity. It was found that oxygen abundances are
nearly constant at a level of 0.6 dex for our metal-poor halo
stars when the non-LTE correction is considered. The
 -elements (Mg, Si, Ca and Ti) are overabundant relative to
Fe and decrease with increasing metallicity. We also obtained a
significant underabundant non-LTE [Na/Fe] ratio
from Na I D lines which have a large deviation from the LTE assumption.
Scandium is marginally overabundant with respect to iron and tends
to decrease with increasing metallicity like the
-elements. A nearly solar value of [Cr/Fe] ratio and
underabundant [Mn/Fe] ratio are obtained.
-elements (Mg, Si, Ca and Ti) are overabundant relative to
Fe and decrease with increasing metallicity. We also obtained a
significant underabundant non-LTE [Na/Fe] ratio
from Na I D lines which have a large deviation from the LTE assumption.
Scandium is marginally overabundant with respect to iron and tends
to decrease with increasing metallicity like the
-elements. A nearly solar value of [Cr/Fe] ratio and
underabundant [Mn/Fe] ratio are obtained.
Key words: stars:
abundances - stars: fundamental parameters - Galaxy: abundances -
Galaxy: halo
Abundance analysis of the stellar atmosphere for different
population stars provides a constraint for the model of Galactic
evolution and nucleosynthesis. Specifically, the investigations of
chemical composition of low mass metal-poor stars (
 ,
[Fe/H] < -1.0) which have retained the initial
material they formed in the early Galaxy is important means of the
understanding an original Galactic formation. The overabundances
of -elements relative to iron observed in old stars (Zhao
& Magain 1990; Gratton et al. 1997, 2003) has been seen, but
different trends are obtained by other authors (Nissen et al. 1994; Stephens & Boesgaard 2002). Determination of oxygen
abundance is one of the most controversial and interesting topics,
especially the behavior of the [O/Fe] ratio in metal-poor halo
stars. There are several indicators of oxygen abundance for
metal-poor stars, but the different indicators give different
results: plateau-like [O/Fe] from [O I] lines, and rising
[O/Fe] from O I triplets or OH lines (see, e.g., Boesgaard
et al. 1999; Mishenina et al. 2000; Allende Prieto et al. 2001;
Nissen et al. 2002; Takeda 2003). [O I] lines are considered
more reliable indicators due to their
weak
,
[Fe/H] < -1.0) which have retained the initial
material they formed in the early Galaxy is important means of the
understanding an original Galactic formation. The overabundances
of -elements relative to iron observed in old stars (Zhao
& Magain 1990; Gratton et al. 1997, 2003) has been seen, but
different trends are obtained by other authors (Nissen et al. 1994; Stephens & Boesgaard 2002). Determination of oxygen
abundance is one of the most controversial and interesting topics,
especially the behavior of the [O/Fe] ratio in metal-poor halo
stars. There are several indicators of oxygen abundance for
metal-poor stars, but the different indicators give different
results: plateau-like [O/Fe] from [O I] lines, and rising
[O/Fe] from O I triplets or OH lines (see, e.g., Boesgaard
et al. 1999; Mishenina et al. 2000; Allende Prieto et al. 2001;
Nissen et al. 2002; Takeda 2003). [O I] lines are considered
more reliable indicators due to their
weak
 sensitivety as well as the general belief of the
validity for the assumption of LTE, while O I and OH lines
are less reliable because of the uncertainties involved in the
non-LTE correction (O I triplets) or with the effect of
atmospheric inhomogeneity (OH lines, Asplund &
García P
sensitivety as well as the general belief of the
validity for the assumption of LTE, while O I and OH lines
are less reliable because of the uncertainties involved in the
non-LTE correction (O I triplets) or with the effect of
atmospheric inhomogeneity (OH lines, Asplund &
García P
 rez 2001; Takeda 2003). In
this paper, we discuss [O/Fe] abundance using O I triplets
with the consideration of non-LTE corrections. The heavy elements
in the Universe have been synthesized by a variety of
nucleosynthesis processes. Fe-group elements are mainly produced
in supernovae with less massive progenitors (type Ia supernovae),
although a non-negligible amount can also be produced in type II
supernovae (Nomoto et al. 1984). All elements heavier than the
Fe-group are synthesized predominantly by neutron capture
reactions that have often referred to as s-process or r-process
elements (Wheeler et al. 1989). In recent years, the heavy element
abundance of very metal poor stars has been of special interest, as it
offers an opportunity to study the astrophysical neutron-capture
processes (e.g., Ryan et al. 1996; Norris et al. 2001).
rez 2001; Takeda 2003). In
this paper, we discuss [O/Fe] abundance using O I triplets
with the consideration of non-LTE corrections. The heavy elements
in the Universe have been synthesized by a variety of
nucleosynthesis processes. Fe-group elements are mainly produced
in supernovae with less massive progenitors (type Ia supernovae),
although a non-negligible amount can also be produced in type II
supernovae (Nomoto et al. 1984). All elements heavier than the
Fe-group are synthesized predominantly by neutron capture
reactions that have often referred to as s-process or r-process
elements (Wheeler et al. 1989). In recent years, the heavy element
abundance of very metal poor stars has been of special interest, as it
offers an opportunity to study the astrophysical neutron-capture
processes (e.g., Ryan et al. 1996; Norris et al. 2001).
Table 1:
The basic parameters and observational data of sample stars.
Although the abundances of halo stars have been studied in many extensive
papers (e.g., McWilliam et al. 1995; Gilmore & Wyse 1998) they are still
of high interest in studying the
accretion history of our Galaxy with companion galaxies.
Nissen & Schuster (1997) found a group of the reduced [/Fe] halo
stars which belong to the outer halo with the very large
 (the maximum distance from the Galactic center) and

 (the maximum
distance from the Galactic plane). Combined with the [Na/Fe] and [Ni/Fe] results,
they suggested that -poor halo stars have been accreted from dwarf galaxies
with a different chemical evolution history from the Milky Way.
Hanson et al. (1998) found that a total of 20
(the maximum
distance from the Galactic plane). Combined with the [Na/Fe] and [Ni/Fe] results,
they suggested that -poor halo stars have been accreted from dwarf galaxies
with a different chemical evolution history from the Milky Way.
Hanson et al. (1998) found that a total of 20 of
retrograde giant sample stars and 13
of all halo giant sample stars have low
[Na/Fe] ratios, and suggest that there may be a group of stars significantly
younger than the typical halo giants. In particular, recent abundances of
giant stars in dwarf galaxies (Shetrone et al. 2003) show that these stars have
underabundant [Na/Fe] and [Ni/Fe] and fit the [Na/Fe]-[Ni/Fe] relation found in
Nissen & Schuster (1997).
We thus investigate the abundance nature for 10 halo stars, most of which are
on retrograde orbits.
of
retrograde giant sample stars and 13
of all halo giant sample stars have low
[Na/Fe] ratios, and suggest that there may be a group of stars significantly
younger than the typical halo giants. In particular, recent abundances of
giant stars in dwarf galaxies (Shetrone et al. 2003) show that these stars have
underabundant [Na/Fe] and [Ni/Fe] and fit the [Na/Fe]-[Ni/Fe] relation found in
Nissen & Schuster (1997).
We thus investigate the abundance nature for 10 halo stars, most of which are
on retrograde orbits.
In this paper we analyze the chemical composition of 10 halo
stars based on the medium-resolution and high signal-to-noise ratio
spectra obtained with the 6 m telescope of the Special Astrophysical Observatory in Russia.
These sample stars with high proper motion and the low
mass (
)
contain information of chemical enrichment
history of the Milky Way. The abundance
analysis of -elements (O, Mg, Si, Ca, Ti), Na, Sc, iron-peak
elements (Cr and Mn) and the neutron capture element Ba are given.
Among these elements, we focused on a few elements, such as O, Na, Sc and Mn,
which are not well studied or have no definitive results in metal-poor stars.
2 Observations and data reduction
We selected a sample of 10 metal-poor stars with the metallicity
range -2.3 < [Fe/H] < -1.4 from Schuster & Nissen (1989). All of
these stars have high proper motions and slow rotatings
 that combine both kinematics and metallicity information of halo component (Nissen & Schuster 1991).
The sample stars were observed using the 6 m telescope of the Special Astrophysical Observatory with
the ECHELLE spectrometer PFES equipped with the CCD (
that combine both kinematics and metallicity information of halo component (Nissen & Schuster 1991).
The sample stars were observed using the 6 m telescope of the Special Astrophysical Observatory with
the ECHELLE spectrometer PFES equipped with the CCD (
 pixels, the pixel size
 m2). The spectral
wavelength coverage is of 4300-7980 Å with the resolving power of 15 000
and the signal-to-noise ratio is about 200. The basic parameters and
observational data are summarized in Table 1. The Cols. 3-8 list
the visual magnitude, colour indices and Hipparcos
parallaxes of sample stars from SIMBAD database. The final two columns
give the observational date and the signal-to-noise ratio.
m2). The spectral
wavelength coverage is of 4300-7980 Å with the resolving power of 15 000
and the signal-to-noise ratio is about 200. The basic parameters and
observational data are summarized in Table 1. The Cols. 3-8 list
the visual magnitude, colour indices and Hipparcos
parallaxes of sample stars from SIMBAD database. The final two columns
give the observational date and the signal-to-noise ratio.
The data reduction is processed with ECHELLE package of standard
ESO MIDAS routines for order identification, background
subtraction, flat-field correction, order extraction and
wavelength calibration. Then the spectrum was normalized by a
continuum function determined by fitting a spline curve to a set
of pre-selected continuum windows which were estimated from the
solar atlas after the correction for the radial velocity shift
measured from at least 20 lines. Finally, the equivalent widths (EW)
were measured by two methods: direct integration and Gaussian
profile fitting.
The accuracy of the equivalent widths is estimated by comparing them with
the other measurements for stars in common. Zhao & Magain (1990) observed BD +02 3375
at the European Southern Observatory 3.6 m telescope using CASPEC (
3375
at the European Southern Observatory 3.6 m telescope using CASPEC (
 ,
,
 ). Stephens & Boesgaard (2002) observed BD +422667
using the KPNO Mayall 4 m telescope with CASPEC (
). Stephens & Boesgaard (2002) observed BD +422667
using the KPNO Mayall 4 m telescope with CASPEC (
 ,
,
 ).
Figure 1 shows the comparisons of these two sets of data. The systematic difference
between the two sets of data are small and linear least squares fittings give:
).
Figure 1 shows the comparisons of these two sets of data. The systematic difference
between the two sets of data are small and linear least squares fittings give:
The standard deviations of the two relations are 3.04 mÅ (for 63 lines) and 3.52 mÅ (for 98 lines).
The scatter in Zhao & Magain (1990) measurements was 3 mÅ which is quoted as an upper limit on the
random errors. Stephens & Boesgaard (2002) gave the residuals less than 2.5 mÅ of scatter.
Therefore we estimate that the typical uncertainty of the EW measurements in this study is about 3 mÅ.
![\begin{figure}
\par\includegraphics[width=8.8cm,clip]{0753fg1a.eps}\par\vspace*{2mm}
\includegraphics[width=8.8cm,clip]{0753fg1b.eps}
\end{figure}](/articles/aa/full/2004/38/aa0753/Timg27.gif) |
Figure 1:
The comparison of equivalent widths with other works:
a) with Zhao & Magain (1990) for BD +023375,
b) with Stephens & Boesgaard (2002) for BD +422667. |
| Open with DEXTER |
3 Stellar atmospheric parameters and kinematics
For the establishment of the atmospheric
model, we need to derive the values of four stellar atmospheric
parameters: effective temperature, surface gravity,
metallicity and microturbulence. The effective temperature was
determined from the Strömgren photometric indices (b-y), c1and metallicity [Fe/H] using the calibration of Alonso et al. (1996). The typical error of effective
temperature is estimated to be about 100 K.
The gravities are determined from the
abundance analysis by requiring that FeI and FeII lines give the same
iron abundance. Another group of gravities calculated using
Hipparcos parallaxes following Nissen et al. (1997) are nearly similar
to these. Because the several program stars have large standard errors of Hipparcos parallaxes
 ,
we adopt the first group of gravities (Col. 3 of Table 2) and estimate the uncertainties
as 0.3 dex. The metallicity was
first derived from the Strömgren m1 index using the
calibrations of Schuster & Nissen (1989), but the final
metallicity was determined from the abundance analysis of Fe lines. The whole
procedure of determining
,
,
we adopt the first group of gravities (Col. 3 of Table 2) and estimate the uncertainties
as 0.3 dex. The metallicity was
first derived from the Strömgren m1 index using the
calibrations of Schuster & Nissen (1989), but the final
metallicity was determined from the abundance analysis of Fe lines. The whole
procedure of determining
,  and metallicity was
repeated until consistency was reached. Finally, the initial
microturbulence velocities for all stars were 1.5 km s-1 then
adjusted from the abundance analysis by requiring a zero slope of [Fe/H] vs. EW. Uncertainties in the adopted microturbulences are
likely to be about 0.3 km s-1. Stellar parameters of sample stars
are presented in Table 2.
and metallicity was
repeated until consistency was reached. Finally, the initial
microturbulence velocities for all stars were 1.5 km s-1 then
adjusted from the abundance analysis by requiring a zero slope of [Fe/H] vs. EW. Uncertainties in the adopted microturbulences are
likely to be about 0.3 km s-1. Stellar parameters of sample stars
are presented in Table 2.
Table 2:
The stellar parameters and kinematics.
As a check of the parameters used here, we compare our values with those determined by other studies.
Alonso et al. (1996) used the InfraRed Flux Method (IRFM, Blacwell et al. 1990) to determine the
mean
values from J, H and K band for a large number of stars.
Nissen et al. (1997) also determined
values for a large number
of stars using photometric indices (b-y). Fulbright (2000) adjusted
so that the Fe I lines
with high excitation potential (EP) give the same iron abundance as those with lower EPs. Tomkin et al. (1992)
adopted
values based on the red and near-infrared colors and the temperature-color calibration
of Peterson & Carney (1979), and their data are used by Takeda (2003) to
calculate non-LTE oxygen abundances.
Figure 2 shows the
comparison of this work with these studies.
Our
values agree well with the results of Nissen et al. (1997) and
almost accord with Alonso et al. (1996) except for two stars, which have
deviations larger than the standard deviation of calibration.
In Fulbright (2000), there are two common stars having a large deviation than us.
They determined
from the excitation balance of Fe I lines.
Takeda (2003) used systematically lower
values than ours in the
high temperature range.
The Cols. 8 to 10 of Table 2 list space velocities U, V and Wwith respect to the Local Standard of Rest (LSR), that are calculated
based on the method of Johnson & Soderblom (1987), and the total space
velocities
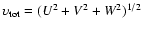 in Col. 11. In the Toomre diagram
Fig. 3 the location of sample stars are agreement with the criterion of Fuhrmann (2002)
for halo stars, i.e.
in Col. 11. In the Toomre diagram
Fig. 3 the location of sample stars are agreement with the criterion of Fuhrmann (2002)
for halo stars, i.e.
 km s-1 .
Moreover, most stars have
km s-1 .
Moreover, most stars have
 km s-1; they are related on retrograde orbits,
except for one star, BD +262606, which is a halo star with a thick-disk orbit.
Particularly, five stars show
km s-1; they are related on retrograde orbits,
except for one star, BD +262606, which is a halo star with a thick-disk orbit.
Particularly, five stars show
 km s-1 and are located
outside the
km s-1 and are located
outside the
 km s-1 circle in the Toomre diagram and they have definitively
retrograde orbits which are shown by filled circles in this figure and the following figures.
km s-1 circle in the Toomre diagram and they have definitively
retrograde orbits which are shown by filled circles in this figure and the following figures.
4 Model atmospheres and abundance determinations
The abundance analysis is based on
flux constant, homogeneous and LTE model atmospheres taken from Kurucz (1993).
The elemental abundances were
derived by requiring that the calculated equivalent widths
from the models should match the observed ones.
Some accurate atomic line data such as oscillator
strengths ( )
and enhancement factors (f6) are required. The oscillator
strengths used in this study are taken from the NIST database
(http://www.nist.gov), and the enhancement factors are taken from the
literatures (Chen et al. 2000, and see references therein).
All atomic line data used in the present work and the EW values of program stars
are available in electronic
form at the CDS via anonymous ftp to
cdsarc.u-strasbg.fr (130.79.128.5) or via
http://cdsweb.u-strasbg.fr/cgi-bin/qcat?J/A+A/425/671
)
and enhancement factors (f6) are required. The oscillator
strengths used in this study are taken from the NIST database
(http://www.nist.gov), and the enhancement factors are taken from the
literatures (Chen et al. 2000, and see references therein).
All atomic line data used in the present work and the EW values of program stars
are available in electronic
form at the CDS via anonymous ftp to
cdsarc.u-strasbg.fr (130.79.128.5) or via
http://cdsweb.u-strasbg.fr/cgi-bin/qcat?J/A+A/425/671
The abundance errors are mainly from two parts: the systematic
errors include the uncertainty of stellar parameters and
atmospheric models, the internal errors are derived from the
measurement of equivalent widths and atomic data uncertainties. We
estimate that the typical uncertainty of the EWs is about 3 mÅ that leads to an internal error of less than 0.1 dex on the derived
abundances. Table 3 presents the systematic error for a typical star
BD +422667.
![\begin{figure}
\par\includegraphics[width=8.8cm,clip]{0753fig2.eps}
\end{figure}](/articles/aa/full/2004/38/aa0753/Timg42.gif) |
Figure 2:
comparisons between this work and various literature studies.
Circles: Nissen et al. (1997); triangles: Alonso et al. (1996);
diamonds: Fulbright (2000); crosses: Takeda (2003). |
| Open with DEXTER |
![\begin{figure}
\par\includegraphics[width=8.8cm,clip]{0753fig3.eps}
\end{figure}](/articles/aa/full/2004/38/aa0753/Timg43.gif) |
Figure 3:
Toomre diagram:
(U2+W2)1/2 versus rotational velocity (V).
We divide sample stars to two groups: definitively regrograde orbit stars
with
 km s-1 (filled circles) and remaining stars with km s-1 (filled circles) and remaining stars with
 km s-1 (asterisks). km s-1 (asterisks). |
| Open with DEXTER |
Table 3:
Abundance errors from atmospheric parameters.
We list
the abundance comparison with other authors' results for eight common stars in Table 4.
It shows that there is an agreement in iron abundances between this work
and other works
except for HD 149414, BD +262606 and BD +342476, with differences reaching 0.2 dex. It might be partially caused by the different
parameters: lower microturbulent velocity for HD 149414 and lower temperature for BD +262606 adopted by Fulbright (2000, hereafter F00).
For BD +342476, our temperature is higher (about 130 K) than Stephens & Boesgaard (2002, hereafter S02)
who derived the effective temperature in the abundance versus excitation potential plot.
The [Mg/Fe] ratio in the present work is systematically lower than
others. We use two weak Mg I lines 4571 Å and 5711 Å and two medium-strong lines 4703 Å and 5528 Å, and these four lines give almost consistent Mg abundance. We believe
that these lower abundance of [Mg/Fe] is mainly caused by the higher oscillator strengths used in
this study. The other elemental abundances [Si/Fe], [Ca/Fe], [Ti/Fe] and [Cr/Fe] are generally
consistent with the compared data. The discrepancy can be explained by
different parameters adopted.
There are large deviations of Ba abundance between our study and F00 for stars HD 149414 and
BD +203603.
In our study, four Ba II lines used for HD 149414 and two Ba II lines used for
BD +203603 give almost consistent results.
For BD +203603, the largest deviation between
our [Ba/Fe] ratio and F00 is unexplained, but Carney et al. (1997) obtained
[Ba/Fe
![$]=-0.18\pm0.09$](/articles/aa/full/2004/38/aa0753/img51.gif) based on the
based on the  4554 line, and [Ba/Fe
![$]=-0.12\pm0.11$](/articles/aa/full/2004/38/aa0753/img53.gif) based
on the weaker Ba II lines. This result is closer to our [Ba/Fe] ratio than F00.
For the remaining common stars the agreements of [Ba/Fe] ratios with F00 are reasonable.
based
on the weaker Ba II lines. This result is closer to our [Ba/Fe] ratio than F00.
For the remaining common stars the agreements of [Ba/Fe] ratios with F00 are reasonable.
5 Results and discussions
The elements abundances in metal-poor stars
as a function of the early history of the Galaxy will be used in the
interpretation of Galactic evolution models and nucleosynthesis
theory. Table 5 summarized the derived abundances in this study.
Solar photospheric abundances were taken from Grevesse & Sauval
(1998). As shown in Fig. 3, to
investigate the abundance pattern for stars on retrograde orbits,
we present different symbols in the following figures.
Table 4:
The comparison of stellar parameters and abundances between this work and previous studies for common stars.
Table 5:
Elemental abundances.
The oxygen abundances of metal-poor stars are very important for our
understanding of stellar and Galactic evolution. The relation of [O/Fe]
vs. [Fe/H] has been presented and discussed in many papers using
different methods. All authors agree that [O/Fe] increases when [Fe/H] decreases from 0 to -1, but the slope of the
[O/Fe] versus [Fe/H] dependence and its behavior for metallicities
below -1 are inconsistent.
Abia & Rebolo (1989) derived oxygen abundance by analysis of the O I infrared triplets in 30 unevolved field stars with metallicities in
the range
 Fe/H
Fe/H
![$]\leq -0.2$](/articles/aa/full/2004/38/aa0753/img55.gif) and found that [O/Fe] reaches 1.0-1.2 at [Fe/H] =-2. That result is significantly higher than
those in dwarfs using the forbidden line 6300 Å by Spite & Spite (1991).
Recently, the study by Mishenina et al. (2000) derived oxygen
abundance through the O I 7774 Å triplets from the non-LTE
determination. The average [O/Fe] is
and found that [O/Fe] reaches 1.0-1.2 at [Fe/H] =-2. That result is significantly higher than
those in dwarfs using the forbidden line 6300 Å by Spite & Spite (1991).
Recently, the study by Mishenina et al. (2000) derived oxygen
abundance through the O I 7774 Å triplets from the non-LTE
determination. The average [O/Fe] is
 dex, and they
found a trend of increasing oxygen abundance with decreasing iron
abundance in the range -2.5 < [Fe/H]< -0.5.
However, Nissen et al. (2002) suggested a more or less flat trend of [O/Fe] in the metallicity range of -2.0 < [Fe/H]< -1.0 calculated
using the 6300 Å forbidden line based on the new generation
of 3D hydrodynamical model atmospheres (Asplund & García Pèrez 2001).
dex, and they
found a trend of increasing oxygen abundance with decreasing iron
abundance in the range -2.5 < [Fe/H]< -0.5.
However, Nissen et al. (2002) suggested a more or less flat trend of [O/Fe] in the metallicity range of -2.0 < [Fe/H]< -1.0 calculated
using the 6300 Å forbidden line based on the new generation
of 3D hydrodynamical model atmospheres (Asplund & García Pèrez 2001).
We have determined oxygen abundances from O I triplets at 7771, 7774
and 7775 Å by considering both LTE and non-LTE effects. The solar
abundance of O is taken from Grevesse & Sauval (1998):
 (O) = 8.83. We use oscillator strengths of
 ,
0.188 and -0.034 from the NIST database. The
non-LTE corrections for O I triplets are calculated by
Eq. (1) of Takeda (2003) using the EW and two
coefficients (a, b) for each combination of (
, ,
,
0.188 and -0.034 from the NIST database. The
non-LTE corrections for O I triplets are calculated by
Eq. (1) of Takeda (2003) using the EW and two
coefficients (a, b) for each combination of (
, ,
 )
which are summarized in Tables 4-6 of Takeda (2003). The
absolute mean value of the correction is less than 0.1 dex with a
maximum of 0.11 dex. The final results are given in Table 6.
Our non-LTE [O/Fe] ratios are generally lower than the results
ginven by Takeda (2003, Table 5) for the seven common stars (see Table 7).
This is due to the discrepancy in both iron abundances and O abundances.
Takeda (2003) used lower [Fe/H] but obtained large
(O) based on
the published equivalent-width data taken from the literature. We note that,
for four common stars, our equivalent widths of O I triplets are
significantly lower than those in Takeda (2003), as observed by Tomkin et al. (1992).
This is the main reason for the higher [O/Fe] ratios in Takeda (2003).
Figure 4 shows the spectra of the triplet for three program stars, and the comparison
with Zhang & Zhao (2003) for the common star HD 108177 observed using the 2.16 m telescope at
the National Astronomical Observatories (Xinglong, China).
Note that the O I triplet lines are detectable in our spectra except for the third line 7775.395 Å which is comparable with the noise level in the comtinuum at this region.
For HD 108177, the EWs of triplets from Zhang & Zhao (2003) are 33.5, 27.6 and 14.8 mÅ respectively. These values are close to ours.
On the other hand, different stellar parameters and
different line lists and oscillator strengths for iron
also might be a reason for the [O/Fe] ratio
deviation. Especially, the effective temperature adopted in this study is systematically
higher than Takeda (2003) by about 100 K. It will systematically decrease our [O/Fe] ratio by about 0.07 dex
(see Table 3).
)
which are summarized in Tables 4-6 of Takeda (2003). The
absolute mean value of the correction is less than 0.1 dex with a
maximum of 0.11 dex. The final results are given in Table 6.
Our non-LTE [O/Fe] ratios are generally lower than the results
ginven by Takeda (2003, Table 5) for the seven common stars (see Table 7).
This is due to the discrepancy in both iron abundances and O abundances.
Takeda (2003) used lower [Fe/H] but obtained large
(O) based on
the published equivalent-width data taken from the literature. We note that,
for four common stars, our equivalent widths of O I triplets are
significantly lower than those in Takeda (2003), as observed by Tomkin et al. (1992).
This is the main reason for the higher [O/Fe] ratios in Takeda (2003).
Figure 4 shows the spectra of the triplet for three program stars, and the comparison
with Zhang & Zhao (2003) for the common star HD 108177 observed using the 2.16 m telescope at
the National Astronomical Observatories (Xinglong, China).
Note that the O I triplet lines are detectable in our spectra except for the third line 7775.395 Å which is comparable with the noise level in the comtinuum at this region.
For HD 108177, the EWs of triplets from Zhang & Zhao (2003) are 33.5, 27.6 and 14.8 mÅ respectively. These values are close to ours.
On the other hand, different stellar parameters and
different line lists and oscillator strengths for iron
also might be a reason for the [O/Fe] ratio
deviation. Especially, the effective temperature adopted in this study is systematically
higher than Takeda (2003) by about 100 K. It will systematically decrease our [O/Fe] ratio by about 0.07 dex
(see Table 3).
Table 6:
Equivalent widths and abundances of O.
Figure 5a shows our non-LTE results with the mean value of [O/Fe
![$] = 0.61\pm0.05$](/articles/aa/full/2004/38/aa0753/img60.gif) .
It agrees well with Mishenina et al. (2000) but the trend is not consistent. In Fig. 5b,
we compare our results with other oxygen abundances derived from different investigations.
We can see that our stars (filled triangles) have nearly constant [O/Fe] of
.
It agrees well with Mishenina et al. (2000) but the trend is not consistent. In Fig. 5b,
we compare our results with other oxygen abundances derived from different investigations.
We can see that our stars (filled triangles) have nearly constant [O/Fe] of  0.6 dex in our metalicity range -2.3 < [Fe/H] < -1.4. This trend
supports the flat trend by Nissen et al. (2002), although the mean [O/Fe] ratio is
about 0.3 dex higher than theirs, and the metallicity coverage is not large enough.
0.6 dex in our metalicity range -2.3 < [Fe/H] < -1.4. This trend
supports the flat trend by Nissen et al. (2002), although the mean [O/Fe] ratio is
about 0.3 dex higher than theirs, and the metallicity coverage is not large enough.
The bulk of -elements was produced by type II supernovae
originating from massive stars (Arnett 1978). The nearly constant
ratios between the -elements and Fe in the metallicity
range
 Fe/H
Fe/H
![$] \leq -1.8$](/articles/aa/full/2004/38/aa0753/img63.gif) are observed by Nissen et al. (1994).
However, a more precise analysis of [/Fe] shows a
pronounced scatter in the metal-poor stars that has been
interpreted mostly as a consequence of the inhomogeneity of the
matter making up the stars rather than a result of poor
observational data (Audouze & Silk 1995). For all four -element ratios,
Stephens & Boesgaard (2002) found high values at low metallicities that
decrease to near-solar values at high metallicities for metal-poor halo dwarfs with
unusual orbital properties (e.g. stars coming from the outskirts of the halo
or stars on retrograde orbits).
are observed by Nissen et al. (1994).
However, a more precise analysis of [/Fe] shows a
pronounced scatter in the metal-poor stars that has been
interpreted mostly as a consequence of the inhomogeneity of the
matter making up the stars rather than a result of poor
observational data (Audouze & Silk 1995). For all four -element ratios,
Stephens & Boesgaard (2002) found high values at low metallicities that
decrease to near-solar values at high metallicities for metal-poor halo dwarfs with
unusual orbital properties (e.g. stars coming from the outskirts of the halo
or stars on retrograde orbits).
Table 7:
Oxygen abundance comparison with Takeda (2003).
![\begin{figure}
\par\includegraphics[width=8.8cm,clip]{0753fg4a.eps}\par\vspace*{2mm}
\includegraphics[width=8.8cm,clip]{0753fg4b.eps}
\end{figure}](/articles/aa/full/2004/38/aa0753/Timg66.gif) |
Figure 4:
The spectra of O I triplet for three sample stars, and spectra comparison with
Zhang & Zhao (2003) for HD 108177. |
| Open with DEXTER |
![\begin{figure}
\par\includegraphics[width=8.8cm,clip]{0753fg5a.eps}\par\vspace*{2mm}
\includegraphics[width=8.8cm,clip]{0753fg5b.eps}
\end{figure}](/articles/aa/full/2004/38/aa0753/Timg67.gif) |
Figure 5:
a): The [O/Fe] ratio vs. [Fe/H] of our sample stars.
b): Comparison with other studies. The open circles present the data from
Beosgaard et al. (1999) using OH lines. The open triangles present
O I triplets result from Mishenina et al. (2000), and the crosses present the
forbidden line [O I] 6300 Å result from Nissen et al. (2002). The diamonds
present reanalysed [O/Fe] ratio by Takeda (2003) for common stars. Our results are
presented by filled triangles. The common stars are connected with solid lines. |
| Open with DEXTER |
![\begin{figure}
\par\includegraphics[width=8.8cm,clip]{0753fig6.eps}
\end{figure}](/articles/aa/full/2004/38/aa0753/Timg68.gif) |
Figure 6:
Abundance patterns for -elements (Mg, Si, Ca and Ti). |
| Open with DEXTER |
Our results for the -elements (Mg, Si, Ca and Ti) are found to
be overabundant by
 ,
,
 ,
,
 ,
and
,
and
 dex
respectively. As seen in Fig. 6, all of the four -elements show a slightly decreasing
trend with increasing iron abundance [Fe/H] in our metallicity range with different
slope, and there are no significantly different pattern between the two groups
of halo stars with different kinematics, definitively retrograde stars (filled circles)
and remaining stars (asterisks). For silicon,
only fewer than five weak Si I lines are available and all EW values
less than 10 mÅ, in the metallicity range of [Fe/H] < -1.9 dex. Moreover, these Si lines have not
provided accurate oscillator strengths. This caused the larger scatter of
Si abundance than other -elements. Ca and Ti are measured with
more than 10 neutral lines, and the
abundances relative to iron show a consistant trend with smaller scatter.
dex
respectively. As seen in Fig. 6, all of the four -elements show a slightly decreasing
trend with increasing iron abundance [Fe/H] in our metallicity range with different
slope, and there are no significantly different pattern between the two groups
of halo stars with different kinematics, definitively retrograde stars (filled circles)
and remaining stars (asterisks). For silicon,
only fewer than five weak Si I lines are available and all EW values
less than 10 mÅ, in the metallicity range of [Fe/H] < -1.9 dex. Moreover, these Si lines have not
provided accurate oscillator strengths. This caused the larger scatter of
Si abundance than other -elements. Ca and Ti are measured with
more than 10 neutral lines, and the
abundances relative to iron show a consistant trend with smaller scatter.
The odd-Z element Na was thought to be synthesized in massive stars like the
-elements, but Na is primarily manufactured during supernova explosions (Timmes et al. 1995).
Therefore, the [Na/Mg] ratio declines as a near mirror image of the increase of [Mg/Fe]
with decreasing [Fe/H] in the disk and halo (Wheeler et al. 1989). Stephens & Boesgaard (2002)
also found out that the ratios of [Na/Fe] and [Mg/Fe] increase together. Previous analysis
of sodium under the assumption of LTE for metal-poor stars gave solar abundance (McWilliam et al. 1995).
Recently, Baumüller et al. (1998, hereafter B98) analyzed the full non-LTE line formation of sodium to
determine the non-LTE effect of neutral sodium. They derived the solar [Na/Fe] ratio by
LTE analysis and obtained a lower [Na/Fe] when non-LTE line formation is taken into account. For
the Na I D lines, the LTE abundances can be significantly different from their non-LTE with
differences reaching 0.6 dex in extreme cases.
In this study, we only measured the strong Na I D 5889/95 Å lines to calculate
sodium abundance. Their non-LTE corrections are calculated using profile fitting by the
synthesis program SIU (see Shi et al. 2004, for details).
The mean non-LTE correction
reached -0.40 dex that reduces the nearly solar [Na/Fe] ratios based on LTE analysis down to
underabundance (mean value
 dex) from nearly solar values.
Table 8 lists the non-LTE correction for Na I D lines. Note that the non-LTE corrections
increase significantly with effective temperature
,
and decrease with increasing
metallicity in the range [Fe/H] > -2.0, but appear opposite to [Fe/H] < -2.0, as mentioned
in Shi et al. (2004). This explains that the non-LTE effect of Na I D lines
is stronger for hot and metal-deficient stars in the range [Fe/H] > -2.0. Figure 7 shows our
non-LTE result of sodium abundance with B98's sample stars. It shows that there is no obvious trend
of the [Na/Fe] vs. [Fe/H] diagram in the metallicity range of -2.3 < [Fe/H] < -1.4. This is not
inconsistent with B98's study since we have no stars with [Fe/H] < -2.3: in B98, the tentative
decreasing [Na/Fe] with [Fe/H] appears at [Fe/H] < -2.5. However, the [Na/Fe] values in the
present work are statistically lower than that of B98 by order of 0.15 dex for the same metallicity
range of -2.3 < [Fe/H] < -1.4. But this result needs further investigation because we notice that
the non-LTE corrections between the present study and B98 are somewhat different although
both works adopt the same profile fitting method. Observationally the lower [Na/Fe] in retrograde stars
could be real.
It has been suggested by Hanson et al. (1998) that some retrograde giants
in the halo have low [Na/Fe] ratios (<-0.35 dex) which is confirmed in retrograde halo dwarfs by
the present study if the comparison of [Na/Fe] between the present work and B98 is internally consistent.
No obvious difference is found between definitive retrograde stars and the remaining stars
based on the present work.
dex) from nearly solar values.
Table 8 lists the non-LTE correction for Na I D lines. Note that the non-LTE corrections
increase significantly with effective temperature
,
and decrease with increasing
metallicity in the range [Fe/H] > -2.0, but appear opposite to [Fe/H] < -2.0, as mentioned
in Shi et al. (2004). This explains that the non-LTE effect of Na I D lines
is stronger for hot and metal-deficient stars in the range [Fe/H] > -2.0. Figure 7 shows our
non-LTE result of sodium abundance with B98's sample stars. It shows that there is no obvious trend
of the [Na/Fe] vs. [Fe/H] diagram in the metallicity range of -2.3 < [Fe/H] < -1.4. This is not
inconsistent with B98's study since we have no stars with [Fe/H] < -2.3: in B98, the tentative
decreasing [Na/Fe] with [Fe/H] appears at [Fe/H] < -2.5. However, the [Na/Fe] values in the
present work are statistically lower than that of B98 by order of 0.15 dex for the same metallicity
range of -2.3 < [Fe/H] < -1.4. But this result needs further investigation because we notice that
the non-LTE corrections between the present study and B98 are somewhat different although
both works adopt the same profile fitting method. Observationally the lower [Na/Fe] in retrograde stars
could be real.
It has been suggested by Hanson et al. (1998) that some retrograde giants
in the halo have low [Na/Fe] ratios (<-0.35 dex) which is confirmed in retrograde halo dwarfs by
the present study if the comparison of [Na/Fe] between the present work and B98 is internally consistent.
No obvious difference is found between definitive retrograde stars and the remaining stars
based on the present work.
Table 8:
Non-LTE corrections and results for Na I D lines.
![\begin{figure}
\par\includegraphics[width=8.8cm,clip]{0753fig7.eps}
\end{figure}](/articles/aa/full/2004/38/aa0753/Timg76.gif) |
Figure 7:
NLTE abundances of Sodium: filled symbols: this study, open triangles: Baumüller et al. (1998). |
| Open with DEXTER |
As an element between -elements and iron-peak elements,
scandium abundance provides some special constraints on nucleosynthesis theory.
However, the observational situation for scandium is not satisfactory at
present. Additionally, the significance of the hyperfine structure (HFS) of Sc lines
on the abundance pattern of Sc is not well established. Zhao & Magain (1990)
derived the overabundance of Sc relative to Fe without consideration of HFS in metal-poor
dwarfs. Gratton & Sneden (1991) considered HFS for Sc lines using synthetic
spectrum computations and found nearly solar [Sc/Fe] ratios in metal-poor dwarfs and
giants. A more detailed HFS effect for Sc lines is discussed by
Nissen et al. (2000). They found that the HFS has a small influence on weak Sc II lines. Their [Sc/Fe] declines from an overabundance (0.2) at [Fe/H] =-1.4to zero at solar metallicity, except for the group of low-
halo stars,
which tend to have low values of [Sc/Fe].
Fewer than five Sc I I lines are measured in this study including 4400.390, 4670.413,
5239.823, 5526.821 and 5657.880 Å. Figure 8 shows Sc abundance results with respect
to metallicity without considering the HFS effect. Our results also show that
the -elements keep the overabundance and tend to decrease with the
increasing metallicity in our range -2.3 < [Fe/H] < -1.4. This agrees with
the result of Zhao & Magain (1990) and supports the investigation of
Nissen et al. (2000) into the overabundances of metal-rich halo stars at [Fe/H] = -1.4.
With different
HFS data, Prochaska & McWilliam (2000) re-determined Sc abundances for stars in Nissen et al. (2000)
but the enhanced [Sc/Fe] is the same. The present result on [Sc/Fe] extends the Nissen et al. (2000)
work to lower metallicity until [Fe/H] = -2.3 and confirms a similar nucleosynthesis origin
as the -elements.
The Fe-group elements are mainly produced by explosion of Type I supernova.
Previous studies of chromium in stars with any metallicity have yielded the
same result: [Cr/Fe![$]\sim0.0$](/articles/aa/full/2004/38/aa0753/img78.gif) (Wheeler et al. 1989). Zhao & Magain
(1990) obtained nearly solar Cr abundance [Cr/Fe/
(Wheeler et al. 1989). Zhao & Magain
(1990) obtained nearly solar Cr abundance [Cr/Fe/
![$] = +0.01\pm0.08$](/articles/aa/full/2004/38/aa0753/img79.gif) using
six weak neutral lines for 20 metal-poor dwarfs. Gratton & Sneden (1991)
obtained a slight underabundance of [Cr/Fe
using
six weak neutral lines for 20 metal-poor dwarfs. Gratton & Sneden (1991)
obtained a slight underabundance of [Cr/Fe
![$] = -0.09\pm0.10$](/articles/aa/full/2004/38/aa0753/img80.gif) from
Cr I lines and [Cr/Fe
from
Cr I lines and [Cr/Fe
![$] = -0.04\pm0.05$](/articles/aa/full/2004/38/aa0753/img81.gif) from Cr I I lines
for the metal-poor dwarfs and giants. For the different
abundances of Cr I and Cr I I lines they suggested that some overionization of Cr occurs in these stars. Our result from Cr I lines also give nearly solar values
with mean [Cr/Fe
from Cr I I lines
for the metal-poor dwarfs and giants. For the different
abundances of Cr I and Cr I I lines they suggested that some overionization of Cr occurs in these stars. Our result from Cr I lines also give nearly solar values
with mean [Cr/Fe
![$]= +0.02\pm0.05$](/articles/aa/full/2004/38/aa0753/img82.gif) ,
but the Cr I I lines give overabundance results
that are higher than the Cr I result by 0.15 dex in extreme cases. We propose that the difference between
abundances provided by neutral and singly ionized Cr lines may be caused by the distribution of
the neutral and ionized Cr in different layers of the atmosphere, with different temperatures and gravities.
,
but the Cr I I lines give overabundance results
that are higher than the Cr I result by 0.15 dex in extreme cases. We propose that the difference between
abundances provided by neutral and singly ionized Cr lines may be caused by the distribution of
the neutral and ionized Cr in different layers of the atmosphere, with different temperatures and gravities.
Some of the early contributions to stellar abundance
studies suggested that the odd-Z elements of the Fe group (at
least V and Mn) are deficient in metal-poor stars (Wheeler et al. 1989).
It is confirmed by Gratton (1989); he derived a
constant [Mn/Fe] ratio for [Fe/H] < -1 with a mean
value of [Mn/Fe
![$] = -0.34\pm0.06$](/articles/aa/full/2004/38/aa0753/img83.gif) .
Recently, Nissen et al. (2000)
published a comprehensive study of [Mn/Fe] ratios for 129 dwarfs in the
range -1.4 < [Fe/H] < +0.1 and found the same significant underabundance of
[Mn/Fe
.
Recently, Nissen et al. (2000)
published a comprehensive study of [Mn/Fe] ratios for 129 dwarfs in the
range -1.4 < [Fe/H] < +0.1 and found the same significant underabundance of
[Mn/Fe
![$] \sim-0.5$](/articles/aa/full/2004/38/aa0753/img84.gif) dex at [Fe/H
dex at [Fe/H
![$] \sim-1.4$](/articles/aa/full/2004/38/aa0753/img85.gif) .
In this study,
we also obtained an underabundant of [Mn/Fe] ratio with
the mean value [Mn/Fe
.
In this study,
we also obtained an underabundant of [Mn/Fe] ratio with
the mean value [Mn/Fe
![$] = -0.31\pm0.11$](/articles/aa/full/2004/38/aa0753/img86.gif) (see Fig. 9). The HFS effect was not considered in
our study. For weak lines the HFS treatment is not so critical
because the lines are unsaturated (Prochaska & McWilliam 2000).
(see Fig. 9). The HFS effect was not considered in
our study. For weak lines the HFS treatment is not so critical
because the lines are unsaturated (Prochaska & McWilliam 2000).
![\begin{figure}
\par\includegraphics[width=8.8cm,clip]{0753fig9.eps}
\end{figure}](/articles/aa/full/2004/38/aa0753/Timg87.gif) |
Figure 9:
Iron peak elements ratios as a function of metallicity. |
| Open with DEXTER |
The elements heavier than iron are produced by neutron capture by two
main mechanisms according to the strength of the neutron flux.
Zhao & Magain (1995) have reduced barium
abundances from two Ba I I lines 5853 Å and 6496 Å obtained that
[Ba/Fe] values are 0.25 dex higher than solar for [Fe/H] > -1.8, then
goes down with decreasing metallicity for [Fe/H] < -1.8.
Mashonkina et al. (1999) analyzed
non-LTE effects of Ba and point out that [Ba/Fe] abundance ratios are approximately solar
above [Fe/H
![$]\sim -2.2$](/articles/aa/full/2004/38/aa0753/img89.gif) where they decrease rapidly by 0.5-0.6 dex, and
suggest s-process dominated Ba production, at least for the
metal-poor stars with [Fe/H] > -2.2.
We measured four Ba I I lines including 4554, 5853,
6141 and 6496 Å for our sample stars. For -2.1 < [Fe/H] < -1.4,
[Ba/Fe] abundance ratios remain constant within 0.05 dex, and decrease
rapidly from [Fe/H] < -2.1 to -0.4 dex in [Fe/H
where they decrease rapidly by 0.5-0.6 dex, and
suggest s-process dominated Ba production, at least for the
metal-poor stars with [Fe/H] > -2.2.
We measured four Ba I I lines including 4554, 5853,
6141 and 6496 Å for our sample stars. For -2.1 < [Fe/H] < -1.4,
[Ba/Fe] abundance ratios remain constant within 0.05 dex, and decrease
rapidly from [Fe/H] < -2.1 to -0.4 dex in [Fe/H![$]\sim-2.3$](/articles/aa/full/2004/38/aa0753/img90.gif) (the Fig. 10).
Note that HD 149414, which is a single-lined binary, has significantly
a higher [Ba/Fe] ratio than nearby stars. Probably it can be explained as a result
of mass transfer from its secondary.
(the Fig. 10).
Note that HD 149414, which is a single-lined binary, has significantly
a higher [Ba/Fe] ratio than nearby stars. Probably it can be explained as a result
of mass transfer from its secondary.
6 Conclusions
We obtained the chemical composition of 10 halo
stars for the 10 elements including -elements (O, Mg, Si,
Ca and Ti), Na, Sc, iron peak elements (Cr and Mn) and the neutron capture
element Ba. The overabundances of oxygen and other
-elements in halo stars are explained by the
interaction between the timescale of halo collapse and star
formation with the supernova of different original masses.
The kinematics indicate that most of the sample stars
are on retrograde orbits. The main conclusions are:
-
- (1)
- In connection with the recent discrepancy (flat or linear increase)
in [O/Fe] vs. [Fe/H] trend, we find that oxygen abundances from O I infrared triplets
at 7774 Å with non-LTE corrections suggest a flat [O/Fe]
with a metallicity for halo stars of -2.3 < [Fe/H] < -1.4.
- (2)
- We performed non-LTE calculations for Na I D lines
and indicated the underabundant [Na/Fe] ratios. Comparison of the [Na/Fe] ratios
with B98 shows a lower [Na/Fe] value for retrograde stars than those of normal halo stars
which is found by Hanson et al. (1998) for retrograde giants.
- (3)
- There is no special abundance pattern in
elements for
retrograde stars. The behaviour of [Sc/Fe] versus [Fe/H] follows the -elements with the enhanced value of
[Sc/Fe
![$] = 0.15\pm0.06$](/articles/aa/full/2004/38/aa0753/img91.gif) ,
and we attribute it as an -element.
,
and we attribute it as an -element.
- (4)
- The recent studies on Mn abundances are quite limited. We extend the
recent investigation of the [Mn/Fe] vs. [Fe/H] trend in Nissen et al. (2000)
to lower metallicity until [Fe/H dex.
- (5)
- There is no obvious difference between five stars definitively classified as retrograde
stars and the remaining stars in our sample. But three retrograde stars do show
lower [Mn/Fe] than the other stars at -2.3 < [Fe/H] < -1.8. Interestingly, the lower [Mn/Fe] has
been suggested as an important property of the thick disk stars (Nissen
2003). It will be important to investigate the connection between the formation of the thick disk
and these retrograde stars in future work.
Acknowledgements
We thank the referee Dr. Wako Aoki for useful suggestions.
This work is supported by NKBRSF G1999075406, the National
Natural Science Foundation of China under grant
No. 10203002 and the Russian Foundation for Basic Research 01-02-16093.
- Abia, C., & Rebolo,
R. 1989, ApJ, 347, 186 [NASA ADS] [CrossRef] (In the text)
- Allende Prieto, C.,
Lambert, D. L., & Asplund, M. 2001, ApJ, 556, 63 [NASA ADS] [CrossRef] (In the text)
- Alonso, A., Arribas,
S., & Martínez-Roger, C. 1996, A&A, 117, 227 [NASA ADS] (In the text)
- Alonso, A., Arribas,
S., & Martínez-Roger, C. 1996, A&A, 313, 873 [NASA ADS]
- Arnett, W. D. 1978,
ApJ, 219, 1008 [NASA ADS] [CrossRef] (In the text)
- Asplund, M., &
García P
 rez, A. E. 2001, A&A, 372, 601 [EDP Sciences] [NASA ADS] [CrossRef] (In the text)
 - Audouze, J., &
Slik, J. 1995, ApJ, 451, 49 [NASA ADS] (In the text)
- Baumüller, D.,
Butler, K., & Gehren, T. 1998, A&A, 338, 637 [NASA ADS] (In the text)
- Blackwell, D. E.,
Petford, A. D., Arribas, S., Haddock, D. J., & Selby, M. J.
1990, A&A, 232, 396 [NASA ADS]
- Boesgaard, A. M., King,
J. R., Deliyannis, C. P., & Vogt, S. S. 1999, AJ, 117, 492 [NASA ADS] [CrossRef] (In the text)
- Carney, B. W., Wright,
J. S., Sneden, C., et al. 1997, AJ, 114, 363 [NASA ADS] [CrossRef] (In the text)
- Chen, Y. Q., Nissen, P.
E., Zhao, G., Zhang, H. W., & Benoni, T. 2000, A&AS, 141,
491 [NASA ADS] (In the text)
- Fuhrmann, K. 2002, New
Astron., 7, 161 [NASA ADS] [CrossRef] (In the text)
- Fulbright, J. P. 2000,
AJ, 120, 1841 [NASA ADS] [CrossRef] (In the text)
- Gilmore, G., &
Wyse, R. F. G. 1998, AJ, 116, 748 [NASA ADS] [CrossRef] (In the text)
- Gratton, R. G. 1989,
A&A, 208, 171 [NASA ADS] (In the text)
- Gratton, R. G., &
Sneden, C. 1991, A&A, 241, 501 [NASA ADS] (In the text)
- Gratton, R. G.,
Clementini, G., & Sneden, C. 1997, hipp. Conf., 339
(In the text)
- Gratton, R. G.,
Carretta, E., Desidera, S., et al. 2003, A&A, 406, 131 [EDP Sciences] [NASA ADS] [CrossRef] (In the text)
- Grevesse, N., &
Sauval, A. J. 1998, SSRv, 85, 161 [NASA ADS] (In the text)
- Hanson, R. B., Sneden,
C., Kraft, R. P., & Fulbright, J. 1998, AJ, 116, 1286 [NASA ADS] [CrossRef] (In the text)
- Johnson, D. R. H.,
& Soderblom, D. R. 1987, AJ, 93, 864 [NASA ADS] [CrossRef] (In the text)
- Kurucz, R. L. 1993,
CD-ROM 13, ATLAS9 Stellar Atmosphere Programs and 2 km
s-1 Grid (Cambridge: SAO)
(In the text)
- Mashonkina, L., Gehren,
T., & Bikmaev, I. 1999, A&A, 433, 519 [NASA ADS] (In the text)
- McWilliam, A., Preston,
G., Sneden, C., & Searle, L. 1995, AJ, 109, 2757 [NASA ADS] [CrossRef] (In the text)
- Mishenina, T. V.,
Korotin, S. A., Klochkova, V. G., & Panchuk, V. E. 2000,
A&A, 353, 978 [NASA ADS] (In the text)
- Nissen, P. E., &
Schuster, W. J. 1991, A&A, 251, 457 [NASA ADS] (In the text)
- Nissen, P. E.,
Gustafsson, B., Edvardsson, B., & Gilmore, G. 1994, A&A,
285, 440 [NASA ADS] (In the text)
- Nissen, P. E.,
Høg, E., & Schuster, W. J. 1997, ESASP, 402, 225 [NASA ADS] (In the text)
- Nissen, P. E., &
Schuster, W. J. 1997, A&A, 326, 761 [NASA ADS] (In the text)
- Nissen, P. E., Chen, Y.
Q., Schuster, W. J., & Zhao, G. 2000, A&A, 353, 722 [NASA ADS] (In the text)
- Nissen, P. E., Primas,
F., Asplund, M., & Lambert, D. L. 2002, A&A, 390, 235 [EDP Sciences] [NASA ADS] (In the text)
- Nissen, P. E. 2003,
Carnegie Observatories Astrophysics Series, Vol. 4: Origin and
Evolution of the Elements
(In the text)
- Nomoto, K., Thielemann,
F. W., & Kiochi, Y. 1984, ApJ, 286, 644 [NASA ADS] [CrossRef] (In the text)
- Norris, J. E., Ryan, S.
G., & Beers, T. C. 2001, ApJ, 561, 1034 [NASA ADS] [CrossRef] (In the text)
- Peterson, R. C., &
Carney, B. W. 1979, ApJ, 231, 762 [NASA ADS] [CrossRef] (In the text)
- Prochaska, J. X., &
McWilliam, A. 2000, ApJ, 537, 57 [NASA ADS] [CrossRef] (In the text)
- Ryan, S. G., Norris, J.
E., & Beers, T. C. 1996, ApJ, 471, 254 [NASA ADS] [CrossRef] (In the text)
- Shetrone, M. D., Venn,
K. A., Tolstoy, E., et al. 2003, AJ, 125, 684 [NASA ADS] [CrossRef] (In the text)
- Schuster, W. J., &
Nissen, P. E. 1989, A&A, 221, 65 [NASA ADS] (In the text)
- Shi, J. R., Gehren, T.,
& Zhao, G. 2004, A&A, 423, 683 [EDP Sciences] [NASA ADS] [CrossRef] (In the text)
- Spite, M., & Spite,
F. 1991, A&A, 252, 689 [NASA ADS] (In the text)
- Stephens, A., &
Boesgaard, A. M. 2002, AJ, 123, 1647 [NASA ADS] [CrossRef] (In the text)
- Takeda, Y. 2003,
A&A, 402, 343 [EDP Sciences] [NASA ADS] [CrossRef] (In the text)
- Timmes, F. X., Woosley,
S. E., & Weaver, T. A. 1995, ApJS, 98, 617 [NASA ADS] [CrossRef] (In the text)
- Tomkin, J., Lemke, M.,
Lambert, D. L., & Sneden, C. 1992, AJ, 104, 1568 [NASA ADS] [CrossRef] (In the text)
- Wheeler, J. C., Sneden,
C., & Truran, J. W. 1989, ARA&A, 27, 279 [NASA ADS] (In the text)
- Zhang, H. W., &
Zhao, G. 2003, IAUS, 219, 11 [NASA ADS]
- Zhao, G., & Magain,
P. 1990, A&A, 238, 242 [NASA ADS] (In the text)
- Zhao, G., & Magain,
P. 1995, in ASP Conf. Ser., 81, 574
(In the text)
Copyright ESO 2004
![\begin{figure}
\par\includegraphics[width=8.8cm,clip]{0753fg1a.eps}\par\vspace*{2mm}
\includegraphics[width=8.8cm,clip]{0753fg1b.eps}
\end{figure}](/articles/aa/full/2004/38/aa0753/img27.gif)
![\begin{figure}
\par\includegraphics[width=8.8cm,clip]{0753fig2.eps}
\end{figure}](/articles/aa/full/2004/38/aa0753/img42.gif)
![\begin{figure}
\par\includegraphics[width=8.8cm,clip]{0753fig3.eps}
\end{figure}](/articles/aa/full/2004/38/aa0753/img43.gif)
![\begin{figure}
\par\includegraphics[width=8.8cm,clip]{0753fg4a.eps}\par\vspace*{2mm}
\includegraphics[width=8.8cm,clip]{0753fg4b.eps}
\end{figure}](/articles/aa/full/2004/38/aa0753/img66.gif)
![\begin{figure}
\par\includegraphics[width=8.8cm,clip]{0753fg5a.eps}\par\vspace*{2mm}
\includegraphics[width=8.8cm,clip]{0753fg5b.eps}
\end{figure}](/articles/aa/full/2004/38/aa0753/img67.gif)
![\begin{figure}
\par\includegraphics[width=8.8cm,clip]{0753fig6.eps}
\end{figure}](/articles/aa/full/2004/38/aa0753/img68.gif)
![\begin{figure}
\par\includegraphics[width=8.8cm,clip]{0753fig7.eps}
\end{figure}](/articles/aa/full/2004/38/aa0753/img76.gif)
![\begin{figure}
\par\includegraphics[width=8.8cm,clip]{0753fig8.eps}
\end{figure}](/articles/aa/full/2004/38/aa0753/img77.gif)
![\begin{figure}
\par\includegraphics[width=8.8cm,clip]{0753fig9.eps}
\end{figure}](/articles/aa/full/2004/38/aa0753/img87.gif)
![\begin{figure}
\par\includegraphics[width=8.8cm,clip]{0753fg10.eps}
\end{figure}](/articles/aa/full/2004/38/aa0753/img88.gif)