A&A 424, 935-950 (2004)
DOI: 10.1051/0004-6361:20040517
O. Kochukhov1 - N. A. Drake2,3 - N. Piskunov4 - R. de la Reza2
1 - Institut für Astronomie, Universität Wien, Türkenschanzstraße 17, 1180 Wien, Austria
2 - Observatório Nacional/MCT, Rua General Jose Cristino 77, 20921-400, Rio de Janeiro, Brazil
3 - Sobolev Astronomical Institute, St. Petersburg State University,
Universitetsky pr. 28, Petrodvorets, 198504, St. Petersburg, Russia
4 - Department of Astronomy and Space Physics, Uppsala University, Box 515, 751 20 Uppsala, Sweden
Received 25 March 2004 / Accepted 24 May 2004
Abstract
We investigate magnetic field geometry and surface distribution of chemical elements in the rapidly oscillating Ap star HR 3831. Results of the model atmosphere analysis of the spectra of this
star are combined with the Hipparcos parallax and evolutionary models to obtain new accurate
estimates of the fundamental stellar parameters:
![]() K,
K,
![]() ,
,
![]() and an inclination angle
and an inclination angle
![]() of the stellar axis of rotation. We find that
the variation of the longitudinal magnetic field of HR 3831 and the results of our analysis of the
magnetic intensification of Fe I lines in the spectrum of this star are consistent with a
dipolar magnetic topology with a magnetic obliquity
of the stellar axis of rotation. We find that
the variation of the longitudinal magnetic field of HR 3831 and the results of our analysis of the
magnetic intensification of Fe I lines in the spectrum of this star are consistent with a
dipolar magnetic topology with a magnetic obliquity
![]() and a polar strength
and a polar strength
![]() kG. We apply a multi-element abundance Doppler imaging inversion code for the analysis of
the spectrum variability of HR 3831, and recover surface distributions of 17 chemical elements, including Li, C, O, Na, Mg, Si, Ca, Ti, Cr, Mn, Fe, Co, Ba, Y, Pr, Nd, Eu. Our study represents the most thorough examination of the surface chemical structure in a magnetic Ap star and provides
important observational constraints for modelling radiative diffusion in magnetic stars.
The exceedingly high quality of some of our spectroscopic data allowed us to reconstruct unprecedented details of abundance distributions, demonstrating a high level of complexity in the surface structure down to the resolution limit of the Doppler maps.
The Doppler imaging analysis of HR 3831 forms a basis for subsequent detailed observational
investigations and theoretical modelling of non-radial oscillations in this star. We discuss the compound effect of the chemical nonuniformities and pulsational velocity field on the rapid line profile variations, and assess the possibility of identifying pulsation modes by using spatial
filtering produced by an inhomogeneous abundance distribution. The results of our study of the surface chemical structure suggest that differences in pulsational behaviour of lines of different
ions observed for HR 3831 are not a consequence of horizontal atmospheric inhomogeneities, but
predominantly a depth effect.
kG. We apply a multi-element abundance Doppler imaging inversion code for the analysis of
the spectrum variability of HR 3831, and recover surface distributions of 17 chemical elements, including Li, C, O, Na, Mg, Si, Ca, Ti, Cr, Mn, Fe, Co, Ba, Y, Pr, Nd, Eu. Our study represents the most thorough examination of the surface chemical structure in a magnetic Ap star and provides
important observational constraints for modelling radiative diffusion in magnetic stars.
The exceedingly high quality of some of our spectroscopic data allowed us to reconstruct unprecedented details of abundance distributions, demonstrating a high level of complexity in the surface structure down to the resolution limit of the Doppler maps.
The Doppler imaging analysis of HR 3831 forms a basis for subsequent detailed observational
investigations and theoretical modelling of non-radial oscillations in this star. We discuss the compound effect of the chemical nonuniformities and pulsational velocity field on the rapid line profile variations, and assess the possibility of identifying pulsation modes by using spatial
filtering produced by an inhomogeneous abundance distribution. The results of our study of the surface chemical structure suggest that differences in pulsational behaviour of lines of different
ions observed for HR 3831 are not a consequence of horizontal atmospheric inhomogeneities, but
predominantly a depth effect.
Key words: stars: chemically peculiar - stars: magnetic fields - stars: individual: HR 3831
HR 3831 (HD 83368, IM Vel) is a bright southern rapidly oscillating (roAp) cool magnetic chemically peculiar star. It pulsates with an amplitude of up to 10 mmag in a single distorted dipole non-radial mode and has a pulsation period of 11.67 min (Kurtz et al. 1997). In addition to the short-term pulsational changes the star shows variation of spectral line profiles, mean longitudinal magnetic field and brightness with a rotation period of 2.851976 days. These variations are interpreted in the framework of the oblique rotator model (Stibbs 1950). According to this phenomenological picture of the variability of magnetic stars, a strong global magnetic field is present at the stellar surface and its axis of symmetry does not coincide with the stellar rotation axis. The magnetic field alters the process of radiatively driven chemical diffusion (Michaud et al. 1981) and governs the formation of inhomogeneous distribution of chemical abundances at the stellar surface. Spectrum and magnetic variation of Ap stars is then ascribed to periodic rotational modulation of the geometrical aspect at which we observe stellar surface structures. A special Doppler mapping inversion technique has been developed and successfully used to reconstruct chemical (Piskunov & Rice 1993) and magnetic (Piskunov & Kochukhov 2002) maps of the surfaces of Ap stars using time-series observations of the line profile variability.
Non-radial pulsations in HR 3831 have been extensively studied photometrically (see Kurtz et al.
1997 and references therein) and were recently detected with time-resolved
spectroscopic observations (Baldry et al. 1998b; Kochukhov & Ryabchikova 2001b;
Balona 2002). The main photometric pulsational characteristics of this roAp star are well
described by the oblique pulsator model (Kurtz 1982). This supposes that the principal
axisymmetric dipole (![]() ,
m=0) non-radial mode is aligned with the axis of the oblique magnetic field of HR 3831, and that
the visibility of the surface pulsational fluctuations is modulated by the stellar rotation.
Despite certain observational successes of this simple model, continuing photometric and
spectroscopic monitoring of HR 3831 revealed a more complex structure of pulsational perturbations,
which could not be fully described by a single spherical harmonic. In a recent theoretical
development, which is yet to be verified observationally, Bigot & Dziembowski (2002)
suggested that non-radial pulsations in roAp stars can have an important contribution from
non-axisymmetric spherical harmonic components and that, in general, the pulsation axis is not
expected to be aligned with either magnetic or rotation axes.
,
m=0) non-radial mode is aligned with the axis of the oblique magnetic field of HR 3831, and that
the visibility of the surface pulsational fluctuations is modulated by the stellar rotation.
Despite certain observational successes of this simple model, continuing photometric and
spectroscopic monitoring of HR 3831 revealed a more complex structure of pulsational perturbations,
which could not be fully described by a single spherical harmonic. In a recent theoretical
development, which is yet to be verified observationally, Bigot & Dziembowski (2002)
suggested that non-radial pulsations in roAp stars can have an important contribution from
non-axisymmetric spherical harmonic components and that, in general, the pulsation axis is not
expected to be aligned with either magnetic or rotation axes.
Thus, despite recent observational and theoretical progress in studying p-mode roAp oscillations, there is a lack of understanding of the intricate relation between pulsational velocity field, global magnetic field and abundance inhomogeneities produced by chemical diffusion. Consequently, a satisfactory solution of the fundamental problem of the excitation and driving of the magneto-acoustic pulsations has so far proved elusive. We believe that many of these questions can be answered and that sufficiently strong observational constraints for the theoretical modelling of pulsations can be formulated by performing a detailed simultaneous investigation of the chemical and magnetic surface structures and stellar pulsations. We will carry out this comprehensive analysis using high-quality spectroscopic observations and applying advanced spectrum synthesis modelling and inversion techniques, such as Doppler imaging (DI). We have chosen HR 3831 as the primary target of our analysis. In comparison with other roAp stars, the high pulsation amplitude, pronounced rotational modulation of spectral line profiles and favourable orientation make this star an ideal object for Doppler imaging and a testbed for pulsation theories. Here we present a re-analysis of the magnetic geometry of HR 3831 and report results of the first Doppler mapping of the surface distribution of its chemical composition.
The main observational material used in our study of chemical structures in HR 3831 consists of 1860 very high-resolution spectra acquired in February 2001 with the Coudé Echelle Spectrograph (CES)
fibre-linked to the Cassegrain focus of the ESO 3.6-m telescope. The combination of the second
(medium resolution) CES image slicer and ESO CCD#61 provided a resolving power of
![]() .
Exposure times were limited to 70 s in order to resolve
pulsational spectroscopic variability of the star. A preliminary report on these time-resolved
spectra was published by Kochukhov & Ryabchikova (2001b).
.
Exposure times were limited to 70 s in order to resolve
pulsational spectroscopic variability of the star. A preliminary report on these time-resolved
spectra was published by Kochukhov & Ryabchikova (2001b).
During our CES observations we continuously monitored HR 3831 for about 8 h during each of the 6 nights with a break of 5 nights in the middle of the run. Such an observing strategy allowed us to obtain a very good coverage of the rotation period of HR 3831, with phase gaps not exceeding 8% of the rotation cycle. For the purpose of DI we averaged groups of 50-60 time-resolved CES spectra obtained within approximately 1 h, which gave us 36 spectra with a typical S/N in excess of 700:1 per pixel in a 1-D extracted spectrum. Th-Ar comparison spectra were recorded between each sequence of time-resolved stellar exposures.
The basic steps of spectrum reduction (bias subtraction, flat field correction, extraction of 1-D spectra and wavelength calibration) were performed with the set of IDL-based routines, specially
adapted for the reduction of CES spectra. The wavelength scale was established with an internal
accuracy of 8 ![]() 10-5 Å consistently for all comparison spectra using a set of 22 Th-Ar emission lines.
10-5 Å consistently for all comparison spectra using a set of 22 Th-Ar emission lines.
Observations with CES, albeit of a very high quality, cover only a 40 Å wavelength region centred at 6136 Å. To obtain more complete information about the surface chemical structures and to study
chemical species with lines outside this short interval we collected 12 additional observations of HR 3831 with the FEROS spectrograph at the 1.52-m ESO telescope at La Silla. These spectra, obtained on December 5-12, 2000, have a resolving power of
![]() ,
S/N of more than 150:1, and cover wavelengths from 3650 to 9270 Å. The reduction of these data was performed using a standard pipe-line reduction script available for the FEROS spectrograph.
,
S/N of more than 150:1, and cover wavelengths from 3650 to 9270 Å. The reduction of these data was performed using a standard pipe-line reduction script available for the FEROS spectrograph.
In addition, for DI in the 6710 Å region we used 7 high-resolution spectra
described by North et al. (1998). These observations were acquired in 1996 with the 1.4-m
Coudé Auxiliary Telescope and CES spectrograph, cover 6675-6732 Å wavelength region and
are characterized by
![]() and
and
![]() .
.
All our spectra of HR 3831 were phased together using the rotational ephemeris of Kurtz et al.
(1997):
| (1) |
We started our analysis by deriving the stellar parameters of HR 3831. The colours in the Strömgren photometric system were used to obtain the value of the surface gravity
![]()
![]() 0.2, metallicity
[M/H]=+0.5, and an initial estimate of the effective temperature. Then
0.2, metallicity
[M/H]=+0.5, and an initial estimate of the effective temperature. Then
![]() was refined by fitting the wings of the hydrogen H
was refined by fitting the wings of the hydrogen H![]() and H
and H![]() lines. Model atmospheres of HR 3831 were calculated with the ATLAS9 code of Kurucz (1993) and the hydrogen lines were synthesized using the SYNTH code (Piskunov 1992). A comparison of the theoretical calculations and the observed Balmer line profiles, extracted from the FEROS échelle spectra of HR 3831, is presented in Fig. 1. We find that
lines. Model atmospheres of HR 3831 were calculated with the ATLAS9 code of Kurucz (1993) and the hydrogen lines were synthesized using the SYNTH code (Piskunov 1992). A comparison of the theoretical calculations and the observed Balmer line profiles, extracted from the FEROS échelle spectra of HR 3831, is presented in Fig. 1. We find that
![]() K provides a satisfactory fit to the hydrogen H
K provides a satisfactory fit to the hydrogen H![]() and H
and H![]() line wings. This effective temperature is slightly lower than, but nevertheless consistent with, the
line wings. This effective temperature is slightly lower than, but nevertheless consistent with, the
![]() K adopted in other spectroscopic analyses of HR 3831 (Polosukhina et al. 2000).
K adopted in other spectroscopic analyses of HR 3831 (Polosukhina et al. 2000).
Table 1:
The log of the spectroscopic observations of HR 3831. The columns give
the heliocentric Julian Date and rotation phase of observation.
Information about telescope/spectrograph combination used to collect
the observations, spectral resolution (
![]() )
and wavelength range is also
provided.
)
and wavelength range is also
provided.
![\begin{figure}
\par\includegraphics[width=16cm,clip]{0517f1.eps}\end{figure}](/articles/aa/full/2004/36/aa0517-04/img31.gif) |
Figure 1:
Comparison of the observed spectrum of HR 3831 in the region of the hydrogen H |
| Open with DEXTER | |
The effective temperature of the star was determined using the phase-averaged profiles of the hydrogen lines. We also studied the variation of the Balmer lines by comparing their shapes at different rotation phases. No significant variability was detected, and possible changes of the
(surface-averaged)
![]() of HR 3831 do not exceed 100-150 K. Thus, our atmospheric parameters are
adequate through the whole rotation period of the star. Furthermore, the absence of any strong
rotational variability of the hydrogen lines suggests that possible local variations of the atmospheric structure make only a minor contribution to the rotational modulation of the metal lines. Therefore, we do not expect the abundance maps reconstructed for HR 3831 to be severely affected by local departures from the average atmospheric stratification that we adopted.
of HR 3831 do not exceed 100-150 K. Thus, our atmospheric parameters are
adequate through the whole rotation period of the star. Furthermore, the absence of any strong
rotational variability of the hydrogen lines suggests that possible local variations of the atmospheric structure make only a minor contribution to the rotational modulation of the metal lines. Therefore, we do not expect the abundance maps reconstructed for HR 3831 to be severely affected by local departures from the average atmospheric stratification that we adopted.
The accurate trigonometric parallax of HR 3831, ![]()
![]() 0.76 mas, available from the Hipparcos project (ESA 1997) enables us to determine the absolute visual magnitude
MV=1.95
0.76 mas, available from the Hipparcos project (ESA 1997) enables us to determine the absolute visual magnitude
MV=1.95 ![]() 0.02. Applying a bolometric correction (Flower 1996) corresponding to the
effective temperature of HR 3831 and using the well-known relations between stellar luminosity,
radius and bolometric magnitude we obtain
0.02. Applying a bolometric correction (Flower 1996) corresponding to the
effective temperature of HR 3831 and using the well-known relations between stellar luminosity,
radius and bolometric magnitude we obtain
![]()
![]() 0.010 and
0.010 and
![]()
![]() 0.082.
0.082.
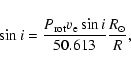
The stellar rotation period
![]() ,
the radius R, the inclination of the rotation axis i and the projected rotational velocity
,
the radius R, the inclination of the rotation axis i and the projected rotational velocity
![]() are related via the equation:
are related via the equation:
 |
(2) |
We can uniquely locate the position of HR 3831 in the theoretical H-R diagram and estimate a stellar
mass and age using the fundamental parameters determined in this section. The comparison of our
values of stellar luminosity and effective temperature with the predictions of the Schaller et al. (1992) evolutionary tracks yields a stellar mass M=1.769 ![]() 0.011
0.011 ![]() and an age
and an age
![]()
![]() 0.056 yrs. Thus, HR 3831 is a medium-age star with about 54% of its main sequence lifetime behind it.
0.056 yrs. Thus, HR 3831 is a medium-age star with about 54% of its main sequence lifetime behind it.
In Table 2 we summarize the fundamental characteristics of HR 3831 derived in our study.
Table 2: Basic physical parameters of HR 3831.
HR 3831 was identified as a magnetic variable by Thompson (1983), who detected variation of the
mean longitudinal field
![]() using photopolarimetric measurements in the wings of the H
using photopolarimetric measurements in the wings of the H![]() line.
Subsequently, additional metallic line spectropolarimetric observations of HR 3831 were collected by
Mathys (1991) and Mathys & Hubrig (1997). They measured the longitudinal field at 13
rotation phases and used the circular polarization observations to derive two other magnetic
observables, the crossover (Mathys 1995a) and the mean quadratic field (Mathys 1995b).
The longitudinal field of HR 3831 varies sinusoidally, with an amplitude of 725
line.
Subsequently, additional metallic line spectropolarimetric observations of HR 3831 were collected by
Mathys (1991) and Mathys & Hubrig (1997). They measured the longitudinal field at 13
rotation phases and used the circular polarization observations to derive two other magnetic
observables, the crossover (Mathys 1995a) and the mean quadratic field (Mathys 1995b).
The longitudinal field of HR 3831 varies sinusoidally, with an amplitude of 725 ![]() 69 G and a mean value close to zero (16
69 G and a mean value close to zero (16 ![]() 43 G). With the rotational ephemeris adopted in our study the positive extremum of the longitudinal field occurs at the rotation phase
43 G). With the rotational ephemeris adopted in our study the positive extremum of the longitudinal field occurs at the rotation phase
![]()
![]() 0.013. The stellar rotation period,
0.013. The stellar rotation period,
![]() d, was inferred by Mathys (1991) from the magnetic measurements. Within the error bars this value agrees with
d, was inferred by Mathys (1991) from the magnetic measurements. Within the error bars this value agrees with
![]()
![]() 0.00003 d derived from the photometric time-series
observations (Kurtz et al. 1997). Given the uncertainty of the rotation period and a 16 year offset between our spectroscopy and the magnetic observations of HR 3831, the mutual phasing of
the Doppler maps and magnetic geometry is accurate to within
0.00003 d derived from the photometric time-series
observations (Kurtz et al. 1997). Given the uncertainty of the rotation period and a 16 year offset between our spectroscopy and the magnetic observations of HR 3831, the mutual phasing of
the Doppler maps and magnetic geometry is accurate to within ![]() 0.06 of the rotation cycle.
0.06 of the rotation cycle.
Despite the relatively weak longitudinal field of HR 3831 Mathys (1995b) derived a very strong,
11 kG, mean quadratic field
![]() from his observations. This is compatible with a low amplitude of
the longitudinal field variation for a dipolar magnetic geometry in which the magnetic axis remains
almost perpendicular to the observer's line of sight in the course of stellar rotation (i.e., the
inclination angle i of the rotation axis is close to 90
from his observations. This is compatible with a low amplitude of
the longitudinal field variation for a dipolar magnetic geometry in which the magnetic axis remains
almost perpendicular to the observer's line of sight in the course of stellar rotation (i.e., the
inclination angle i of the rotation axis is close to 90![]() and the magnetic obliquity
and the magnetic obliquity
![]() is small). Such a dipolar magnetic topology was obtained for HR 3831 by Bagnulo et al.
(1999) who used Mathys's measurements of the magnetic moments and found
is small). Such a dipolar magnetic topology was obtained for HR 3831 by Bagnulo et al.
(1999) who used Mathys's measurements of the magnetic moments and found
![]()
![]()
![]() ,
,
![]()
![]()
![]() and a polar strength
and a polar strength
![]()
![]() 0.5 kG. In a later study Bagnulo et al. (2002) demonstrated that more complicated superpositions of dipolar and quadrupolar fields with i in the range of 57
0.5 kG. In a later study Bagnulo et al. (2002) demonstrated that more complicated superpositions of dipolar and quadrupolar fields with i in the range of 57![]() -87
-87![]() and
and
![]() -86
-86![]() can also describe the observed magnetic variation of HR 3831.
can also describe the observed magnetic variation of HR 3831.
In the present investigation we are interested in estimating the parameters of the simplest dipolar
magnetic geometry and will not consider combinations of dipole and quadrupole components, since
these complex topologies are poorly constrained by the available magnetic observables. We note that
a dipolar magnetic geometry with a large ![]() and small
and small ![]() is inconsistent with the surface abundance patterns and pulsational variation of HR 3831. Both the chemical maps found in our study and the results of the modelling of the photometric light curves of HR 3831 (e.g., Kurtz et al. 1997) favour large
is inconsistent with the surface abundance patterns and pulsational variation of HR 3831. Both the chemical maps found in our study and the results of the modelling of the photometric light curves of HR 3831 (e.g., Kurtz et al. 1997) favour large ![]() values. A plausible explanation of this discrepancy may be the influence of surface chemical inhomogeneities on the determination of the quadratic field by Mathys (1995b). This particular magnetic observable was obtained by considering subtle magnetic broadening effects and using moderate resolution low S/N spectra of HR 3831. To determine
values. A plausible explanation of this discrepancy may be the influence of surface chemical inhomogeneities on the determination of the quadratic field by Mathys (1995b). This particular magnetic observable was obtained by considering subtle magnetic broadening effects and using moderate resolution low S/N spectra of HR 3831. To determine
![]() Mathys (1995b) employed a set of 6-12 lines of Ca I, Na I, Si II and Fe I. Our high-resolution high S/N spectra of HR 3831 clearly show that all these absorption features are affected by strong surface abundance nonuniformities and exhibit pronounced rotational modulation of the line profile shapes. This modulation is not the same for weak and strong lines of the same ions and is clearly different for absorption features belonging to different chemical species. Consequently, a strong bias may be introduced in a multi-element quadratic field diagnostics of magnetic Ap stars with strong spectrum variability.
Mathys (1995b) employed a set of 6-12 lines of Ca I, Na I, Si II and Fe I. Our high-resolution high S/N spectra of HR 3831 clearly show that all these absorption features are affected by strong surface abundance nonuniformities and exhibit pronounced rotational modulation of the line profile shapes. This modulation is not the same for weak and strong lines of the same ions and is clearly different for absorption features belonging to different chemical species. Consequently, a strong bias may be introduced in a multi-element quadratic field diagnostics of magnetic Ap stars with strong spectrum variability.
A more accurate and robust estimate of the surface field strength
![]() can be obtained by careful
analysis of the magnetic intensification of the spectral lines of a selected chemical element. In order to obtain such field strength measurements we identified and determined
equivalent widths for 13 unblended Fe I lines in the FEROS spectra of HR 3831. These
lines were selected from the transitions with the most accurate oscillator strengths as listed in the VALD database (Piskunov et al. 1995; Kupka et al. 1999). Using two lines of Fe I with null magnetic sensitivity,
can be obtained by careful
analysis of the magnetic intensification of the spectral lines of a selected chemical element. In order to obtain such field strength measurements we identified and determined
equivalent widths for 13 unblended Fe I lines in the FEROS spectra of HR 3831. These
lines were selected from the transitions with the most accurate oscillator strengths as listed in the VALD database (Piskunov et al. 1995; Kupka et al. 1999). Using two lines of Fe I with null magnetic sensitivity, ![]() 5434.52 and 5576.09 Å, we found the average Fe abundance
5434.52 and 5576.09 Å, we found the average Fe abundance
![]() .
For the other 11 spectral lines of Fe I with mean
Landé factors in the range between 1.20 and 1.63 we computed equivalent widths using full
polarized radiative transfer spectrum synthesis with the SYNTHMAG code (Piskunov 1999).
Figure 2 illustrates the comparison of the observed phase-averaged equivalent widths with the results of the theoretical calculations for different values of the surface field. The best
agreement between computed and observed Fe I lines is achieved for
.
For the other 11 spectral lines of Fe I with mean
Landé factors in the range between 1.20 and 1.63 we computed equivalent widths using full
polarized radiative transfer spectrum synthesis with the SYNTHMAG code (Piskunov 1999).
Figure 2 illustrates the comparison of the observed phase-averaged equivalent widths with the results of the theoretical calculations for different values of the surface field. The best
agreement between computed and observed Fe I lines is achieved for
![]()
![]() 0.75 kG. Evidently, adopting
0.75 kG. Evidently, adopting
![]() kG results in a larger discrepancy between observations and theory and noticeably increases the scatter of the iron abundances determined from the equivalent widths of individual Fe I lines. Thus, we do not confirm the presence of a strong magnetic field at the surface of HR 3831 and suggest that the high
kG results in a larger discrepancy between observations and theory and noticeably increases the scatter of the iron abundances determined from the equivalent widths of individual Fe I lines. Thus, we do not confirm the presence of a strong magnetic field at the surface of HR 3831 and suggest that the high
![]() found by Mathys (1995b) is not related to the actual stellar magnetic topology but rather reflects intrinsic limitations of the particular magnetic diagnostics technique.
found by Mathys (1995b) is not related to the actual stellar magnetic topology but rather reflects intrinsic limitations of the particular magnetic diagnostics technique.
In our analysis we can take advantage of the new estimate of the inclination angle of the stellar
rotation axis,
![]()
![]()
![]() ,
derived in Sect. 3 independently of the
magnetic field analysis. Figure 3 shows the range of dipolar field parameters,
,
derived in Sect. 3 independently of the
magnetic field analysis. Figure 3 shows the range of dipolar field parameters, ![]() and
and ![]() ,
compatible with the longitudinal field variation for this inclination angle. We
conclude that the most probable polar strength and obliquity of the dipolar field in HR 3831 are
,
compatible with the longitudinal field variation for this inclination angle. We
conclude that the most probable polar strength and obliquity of the dipolar field in HR 3831 are
![]()
![]() 0.26 kG and
0.26 kG and
![]()
![]()
![]() .
Figure 4 shows the surface distribution of the field strength and orientation for the dipolar field geometry determined in our study. This magnetic model predicts variation of the field modulus between 1.59 and 1.94 kG,
which is consistent with the results of our investigation of the magnetic intensification of
Fe I spectral lines.
.
Figure 4 shows the surface distribution of the field strength and orientation for the dipolar field geometry determined in our study. This magnetic model predicts variation of the field modulus between 1.59 and 1.94 kG,
which is consistent with the results of our investigation of the magnetic intensification of
Fe I spectral lines.
![\begin{figure}
\par\includegraphics[width=8.8cm,clip]{0517f2.eps}\end{figure}](/articles/aa/full/2004/36/aa0517-04/img69.gif) |
Figure 2:
Illustration of the analysis of the magnetic intensification of the Fe I lines in the spectrum of HR 3831. The difference between theoretical and phase-averaged observed equivalent widths is plotted for several values of the mean field modulus,
|
| Open with DEXTER | |
![\begin{figure}
\par\includegraphics[width=8.8cm,clip]{0517f3.eps}\end{figure}](/articles/aa/full/2004/36/aa0517-04/img70.gif) |
Figure 3:
The range of dipolar model parameters, |
| Open with DEXTER | |
![\begin{figure}
\par\includegraphics[width=18cm,clip]{0517f4.eps}\end{figure}](/articles/aa/full/2004/36/aa0517-04/img71.gif) |
Figure 4:
Dipolar magnetic field geometry of HR 3831. The star is shown at five equidistant rotation
phases as indicated at the top of the figure. The aspect corresponds to the inclination angle
|
| Open with DEXTER | |
According to our model of the magnetic field geometry, the local field strength in HR 3831 changes
from 1.25 to 2.49 kG over the visible part of the stellar surface. The rapid rotation of the star
and the large inclination angle of its axis result in substantial Doppler broadening of the spectral lines and preclude direct observation of the Zeeman splitting. At the same time, the magnetic field produces moderate intensification of spectral lines. In the range of the field strengths typical for the atmosphere of HR 3831 this effect can be efficiently approximated with a pseudo-microturbulent
velocity (Ryabchikova & Piskunov 1986) introduced in the non-magnetic spectrum synthesis
calculations:
 |
(3) |
![\begin{figure}
\par\includegraphics[width=15cm,clip]{0517f5.eps}\end{figure}](/articles/aa/full/2004/36/aa0517-04/img79.gif) |
Figure 5: Comparison of the observed (thin lines) and computed (thick lines) variation of the Li I, C I, O I, Na I, Si II and Mg I line profiles in the spectrum of HR 3831. Observations shown in this figure were obtained with the FEROS and CAT/CES instruments. Spectra for consecutive rotation phases are shifted in the vertical direction. Rotation phases are indicated in the column to the left of the plot. The bar at the lower left shows the horizontal and vertical scale (1 Å and 5% of the continuum intensity respectively). |
| Open with DEXTER | |
![\begin{figure}
\par\includegraphics[width=16.2cm,clip]{0517f6.eps}\end{figure}](/articles/aa/full/2004/36/aa0517-04/img80.gif) |
Figure 6: Comparison of the observed (thin lines) and computed (thick lines) variation of the Ti II, Mn I, Cr I, Cr II, Co I, Co II, Y II, Pr III and Eu II line profiles in the spectrum of HR 3831 recorded with the FEROS spectrograph. |
| Open with DEXTER | |
![\begin{figure}
\par\includegraphics[width=18cm,clip]{0517f7.eps}\end{figure}](/articles/aa/full/2004/36/aa0517-04/img81.gif) |
Figure 7:
Surface distributions of Li, C, O, Na, Si and Mg reconstructed using the FEROS spectra of HR 3831. The star is shown at five equidistant rotation phases at the inclination angle
|
| Open with DEXTER | |
![\begin{figure}
\par\includegraphics[width=18cm,clip]{0517f8.eps}\end{figure}](/articles/aa/full/2004/36/aa0517-04/img82.gif) |
Figure 8: The same as Fig. 7 for the surface distributions of Ti, Mn, Cr, Co, Y, Pr and Eu reconstructed using the FEROS spectra of HR 3831. |
| Open with DEXTER | |
![\begin{figure}
\par\includegraphics[width=12cm,clip]{0517f9.eps}\end{figure}](/articles/aa/full/2004/36/aa0517-04/img83.gif) |
Figure 9: Comparison of the observed (thin lines) and computed (thick lines) variation of the Ca I, Si I, Fe I, Ba II and Nd III line profiles in the spectrum of HR 3831 recorded with the CES spectrograph. For illustrative purpose the spectra are shifted in the vertical direction according to their rotation phases. |
| Open with DEXTER | |
![\begin{figure}
\par\includegraphics[width=18cm,clip]{0517f10.eps}\end{figure}](/articles/aa/full/2004/36/aa0517-04/img84.gif) |
Figure 10: The same as Fig. 7 for the surface distributions of Ca, Fe, Ba and Nd reconstructed using the CES spectra of HR 3831. |
| Open with DEXTER | |
Stellar surface inhomogeneities, such as a nonuniform distribution of temperature or chemical composition, lead to characteristic distortions in the profiles of Doppler broadened stellar spectral lines. In the course of stellar rotation these distortions will move across the line profiles due to the changes in visibility and Doppler shifts of individual structures at the stellar surface. The Doppler imaging (DI) technique utilizes the information contained in the rotational modulation of the absorption line profiles and reconstructs features at the surfaces of stars by inverting a time series of high-resolution spectra into a map of the stellar surface. The Doppler mapping method was originally developed by Goncharsky et al. (1977) and was aimed at the analysis of the chemical structures on the surfaces of Ap stars (Piskunov & Rice 1993). The technique was later extended to temperature mapping of late-type active stars (Vogt et al. 1987) and recently applied to the imaging of magnetic fields in Ap stars (Piskunov & Kochukhov 2002).
For the investigation of the surface distribution of the chemical composition in HR 3831 we used the DI code INVERS12. The line profile modelling with this program is based on accurate spectrum synthesis
calculations using stellar model atmospheres. The INVERS12 code allows simultaneous imaging of several
chemical elements using spectroscopic data from blends and multiple wavelength intervals. Kuschnig
et al. (1999) and Lüftinger et al. (2003) described the application of an early
version of this code for the abundance mapping of the chemically peculiar stars CU Vir and
![]() UMa.
UMa.
Mathematically the inverse problem of Doppler imaging is solved by minimizing the error function:
Generally, spectral inversion is a fundamentally ill-posed problem. Uniqueness and
stability of the solution can only be achieved by including the regularization function
![]() in the total error function defined by Eq. (4) or by
adjusting the number of free parameters to ensure consistency between the surface grid resolution
and the information contained in the available observational data. The regularization
procedure ensures that the surface map
in the total error function defined by Eq. (4) or by
adjusting the number of free parameters to ensure consistency between the surface grid resolution
and the information contained in the available observational data. The regularization
procedure ensures that the surface map
![]() derived by a DI code is the simplest or
smoothest distribution among an infinite number of solutions providing an adequate fit to the available observational data. Papers by Vogt et al. (1987), Piskunov et al. (1990)
and Berdyugina (1998) discuss different versions of regularization but,
as demonstrated by Piskunov (1990), Strassmeier et al. (1991)
and Korhonen et al. (1999), the specific form of the regularization strategy becomes irrelevant when the rotational modulation of the stellar line profiles is large compared to the noise in observed spectra. In mapping the surface of HR 3831 we used the Tikhonov regularization functional (Tikhonov 1963):
derived by a DI code is the simplest or
smoothest distribution among an infinite number of solutions providing an adequate fit to the available observational data. Papers by Vogt et al. (1987), Piskunov et al. (1990)
and Berdyugina (1998) discuss different versions of regularization but,
as demonstrated by Piskunov (1990), Strassmeier et al. (1991)
and Korhonen et al. (1999), the specific form of the regularization strategy becomes irrelevant when the rotational modulation of the stellar line profiles is large compared to the noise in observed spectra. In mapping the surface of HR 3831 we used the Tikhonov regularization functional (Tikhonov 1963):
 |
(5) |
The surface structures enter the line profile synthesis through the integration of emergent spectra
over the visible stellar hemisphere, which for a given rotation phase and wavelength can be
written as
 |
(6) |
For the Doppler mapping of HR 3831 we adopted a 1800-element grid, dividing the stellar surface into
zones of
![]()
![]()
![]() .
This surface grid is consistent with the resolution of
.
This surface grid is consistent with the resolution of ![]()
![]() that we expect to achieve at the stellar rotational equator with the CES spectra of HR 3831.
that we expect to achieve at the stellar rotational equator with the CES spectra of HR 3831.
The projected rotational velocity of HR 3831,
![]()
![]() 0.5 km s-1, was determined using the CES spectra by optimizing the fit to the profile variability of the Ba II 6141.71 Å and Nd III 6145.07 Å lines.
0.5 km s-1, was determined using the CES spectra by optimizing the fit to the profile variability of the Ba II 6141.71 Å and Nd III 6145.07 Å lines.
This section presents results of our Doppler imaging analysis of the chemical structures at the surface of HR 3831. Atomic data used in the spectrum synthesis calculations with INVERS12 were primarily extracted from VALD (Piskunov et al. 1995; Kupka et al. 1999). In addition, line lists from the DREAM database (Biémont et al. 1999) were employed to improve the modelling of lines of rare-earth elements (REE), in particular Pr III and Nd III.
Some of the spectral lines showing interesting behaviour in HR 3831 are partially blended with telluric lines in our spectra. This problem concerns the C I 8335.15 Å and the Na I 5895.92 Å lines. Prior to analysing these spectral regions we used an atlas of telluric lines from Wallace et al. (2000) to model and subtract the contribution of the Earth atmosphere to the observed stellar spectra.
The results of mapping HR 3831 are presented graphically in figures comparing the observed and
computed variability of spectral lines (Figs. 5, 6 and 9) and in
corresponding spherical plots of chemical abundance distributions (Figs. 7,
8 and 10). In the latter figures the star is always displayed at five rotation
phases (![]() = 0.0, 0.2, 0.4, 0.6, 0.8) with vertically oriented rotation axis. The
darker areas in the greyscale images correspond to higher abundance and lighter areas show relative
depletion of a chemical element. The contour lines highlighting abundance structures are drawn
with a step of 1.0 dex.
= 0.0, 0.2, 0.4, 0.6, 0.8) with vertically oriented rotation axis. The
darker areas in the greyscale images correspond to higher abundance and lighter areas show relative
depletion of a chemical element. The contour lines highlighting abundance structures are drawn
with a step of 1.0 dex.
The following sections discuss the individual abundance maps recovered for HR 3831 in more detail.
The surface distribution of lithium was reconstructed using the total of 21 rotation phases of the FEROS and CAT/CES spectra. We modelled the resonance Li I doublet at ![]() 6708 Å taking into account its blending with the nearby variable line of Pr III 6706.70 Å. With the multi-element abundance imaging capability of INVERS12 both elements can be mapped simultaneously and in a self-consistent manner.
6708 Å taking into account its blending with the nearby variable line of Pr III 6706.70 Å. With the multi-element abundance imaging capability of INVERS12 both elements can be mapped simultaneously and in a self-consistent manner.
In previous investigations of the spectrum variability of HR 3831 (North et al. 1998) a remarkable rotational modulation of the Li I line was noted. Polosukhina et al. (2000) attempted to use information provided by this spectral feature in a trial-and-error analysis of the surface Li distribution. They suggested that a reasonably good description of the Li line profile variability can be achieved by assuming that the element is enhanced by ![]() 2.4 dex relative to the solar abundance in two circular spots (
2.4 dex relative to the solar abundance in two circular spots (
![]() )
located close to the magnetic poles. The results of our Doppler reconstruction of the lithium abundance map - the first Doppler mapping of
this element for a peculiar A star - are presented in Fig. 7 and generally confirm the Li map inferred by Polosukhina et al. (2000). Moreover, a more detailed nature of our analysis and, possibly, accounting for variable blending with the Pr III 6706.70 Å line yielded a higher contrast abundance map showing some deviations from a strictly axisymmetric distribution, as the shapes of the Li spots close to the positive and negative magnetic poles appear to be somewhat different. We find that Li is strongly concentrated at the magnetic poles, with
)
located close to the magnetic poles. The results of our Doppler reconstruction of the lithium abundance map - the first Doppler mapping of
this element for a peculiar A star - are presented in Fig. 7 and generally confirm the Li map inferred by Polosukhina et al. (2000). Moreover, a more detailed nature of our analysis and, possibly, accounting for variable blending with the Pr III 6706.70 Å line yielded a higher contrast abundance map showing some deviations from a strictly axisymmetric distribution, as the shapes of the Li spots close to the positive and negative magnetic poles appear to be somewhat different. We find that Li is strongly concentrated at the magnetic poles, with
![]() -20
-20![]() ,
and has much higher abundance in the spots,
,
and has much higher abundance in the spots,
![]() ,
compared to the outcome of the trial-and-error spectral modelling (
,
compared to the outcome of the trial-and-error spectral modelling (
![]() ,
Polosukhina et al. 2000).
,
Polosukhina et al. 2000).
The fit to the Li blend cannot be improved by including a contribution of the isotope 6Li. A
tentative upper limit for the concentration of the lighter lithium isotope, 6Li/7Li ![]() 0.05, has emerged from our analysis.
0.05, has emerged from our analysis.
The distributions of carbon and oxygen were studied with the neutral line C I 8335.15 Å and the O I IR triplet at ![]() 7771-7775 Å. For both elements we discovered a similar spectacular profile variability (see Fig. 5) with their lines changing from very strong to invisible. This happens twice during the rotation cycle, indicating a two-spot or a ring-like overabundance structure encircling the star at about the magnetic equator. The oxygen surface distribution in HR 3831 is very similar to the map of this element reconstructed for
7771-7775 Å. For both elements we discovered a similar spectacular profile variability (see Fig. 5) with their lines changing from very strong to invisible. This happens twice during the rotation cycle, indicating a two-spot or a ring-like overabundance structure encircling the star at about the magnetic equator. The oxygen surface distribution in HR 3831 is very similar to the map of this element reconstructed for
![]() UMa by Rice et al. (1997). In both stars the belt at the magnetic equatorial region is very sharp and is characterized by
UMa by Rice et al. (1997). In both stars the belt at the magnetic equatorial region is very sharp and is characterized by ![]() 1.0 dex overabundance of O relative to the sun, while the rest of the stellar surface is oxygen deficient (underabundance by 2.0-3.0 dex with respect to the solar chemical composition).
1.0 dex overabundance of O relative to the sun, while the rest of the stellar surface is oxygen deficient (underabundance by 2.0-3.0 dex with respect to the solar chemical composition).
The surface distribution of carbon was investigated here for the first time and was found to show
a strong resemblance to the oxygen map. Similar to O, C is enhanced in the two areas at the stellar
surface where the magnetic field lines are horizontal. However, this element also shows a tendency to concentrate towards the stellar rotational equator. In terms of the absolute abundance, we find
![]() 1.0 dex enhancement of carbon in spots and
1.0 dex enhancement of carbon in spots and ![]() 2.5 dex deficiency in the unspotted
photosphere.
2.5 dex deficiency in the unspotted
photosphere.
We used the resonance line of Na I 5895.92 Å and the Si II doublet at ![]() 6347.11 and 6371.37 Å to study the surface distribution of sodium and silicon
respectively. The spectral lines of these elements show a similar pronounced line profile modulation, with a distinct triangular line shape at the crossover phases (
6347.11 and 6371.37 Å to study the surface distribution of sodium and silicon
respectively. The spectral lines of these elements show a similar pronounced line profile modulation, with a distinct triangular line shape at the crossover phases (
![]() and 0.75). The surface images reconstructed for Na and Si (Fig. 7) are dominated by the structures in the subequatorial regions, where the overabundance reaches 2.5-3.0 dex relative to the normal concentration of these elements. On the other hand, the part of the HR 3831 surface above the rotational equator shows a 2-3 dex deficiency of sodium and silicon. There is a marginal tendency for Na and Si to exhibit higher abundance at the magnetic equator. We note that the surface distributions of both elements were mapped using fairly strong lines, which can be noticeably affected by vertical abundance stratification
(Ryabchikova et al. 2002). This can potentially introduce a spurious latitudinal variation of abundance in Doppler images and explain the prominent north-south asymmetry that is present in our Na and Si maps. Additional modelling using better quality data and analysis of lines from other spectral regions is required to resolve this issue.
and 0.75). The surface images reconstructed for Na and Si (Fig. 7) are dominated by the structures in the subequatorial regions, where the overabundance reaches 2.5-3.0 dex relative to the normal concentration of these elements. On the other hand, the part of the HR 3831 surface above the rotational equator shows a 2-3 dex deficiency of sodium and silicon. There is a marginal tendency for Na and Si to exhibit higher abundance at the magnetic equator. We note that the surface distributions of both elements were mapped using fairly strong lines, which can be noticeably affected by vertical abundance stratification
(Ryabchikova et al. 2002). This can potentially introduce a spurious latitudinal variation of abundance in Doppler images and explain the prominent north-south asymmetry that is present in our Na and Si maps. Additional modelling using better quality data and analysis of lines from other spectral regions is required to resolve this issue.
Reconstruction of the magnesium map was based on modelling the Mg I 5528.40 Å line in the FEROS observations of HR 3831. The surface distribution of Mg is dominated by the four sharp
overabundance features located at the rotational equator, where the abundance relative to the sun,
![]() ,
reaches
,
reaches ![]() 3 dex. Two of the magnesium spots coincide with the positions of the magnetic poles. The rest of the stellar surface appears to have an Mg abundance between roughly solar and 0.5-1.0 dex deficient.
3 dex. Two of the magnesium spots coincide with the positions of the magnetic poles. The rest of the stellar surface appears to have an Mg abundance between roughly solar and 0.5-1.0 dex deficient.
The calcium surface image was recovered using the Ca I 6122.22 Å line in our CES spectra of HR 3831. The observations are compared with the spectrum synthesis in Fig. 9, while Fig. 10 shows the spherical plot of the reconstructed Ca map. In mapping this element we took into account the blending contributions of several weak lines of Mn II, Cr II and Co I. The pattern of rotational modulation of the studied Ca line shows some similarities with the behaviour of the Na and Si lines. The surface distribution of Ca is fairly complex, without large overabundance or underabundance areas, which proves that the Ca lines in HR 3831 sample the whole stellar surface. We found an indication that Ca is accumulated along the magnetic equator in the northern stellar hemisphere, but this trend seems to be reversed in the southern hemisphere. The horizontal variation of the Ca abundance in HR 3831 is approximately ![]() 2 dex around the solar value.
2 dex around the solar value.
A single spectral line of titanium, Ti II 5188.68 Å, was used to recover the surface distribution of this element. According to our Fig. 8, Ti shows a tendency of near-solar concentration along the two belts around the magnetic poles. The other regions are characterized by Ti overabundance, which reaches up to 3 dex in the spot recovered with INVERS12 at the positive magnetic pole.
For both manganese and chromium we reconstructed complex high-contrast
distributions using FEROS spectra in the red region. The neutral Mn map is based on modelling a pair
of lines at ![]() 6016.67 and 6021.82 Å, in which blending by Fe I lines was accounted
for. Figure 8 demonstrates that the manganese abundance is close to solar over most part of
the HR 3831 surface, except for the three small equatorial spots where overabundance by up to 4 dex is
attained. Only one of these overabundance features coincides with the positive pole of the dipolar
magnetic field; the other two are displaced from the negative pole by roughly
6016.67 and 6021.82 Å, in which blending by Fe I lines was accounted
for. Figure 8 demonstrates that the manganese abundance is close to solar over most part of
the HR 3831 surface, except for the three small equatorial spots where overabundance by up to 4 dex is
attained. Only one of these overabundance features coincides with the positive pole of the dipolar
magnetic field; the other two are displaced from the negative pole by roughly ![]()
![]() in
longitude. The Cr map was inferred from a simultaneous analysis of the two chromium blends at
in
longitude. The Cr map was inferred from a simultaneous analysis of the two chromium blends at
![]() 5791 and 6882 Å, containing 8 and 4 Cr lines respectively. The Cr surface pattern is
qualitatively similar to that of Mn, although the Cr spots tend to be less constrained to the
stellar rotational equator. From the Cr spherical map shown in Fig. 8 it is clear that a
narrow ring of relative underabundance is found at the magnetic equator. This is the only region on
the surface of HR 3831 with a solar-like Cr concentration. On the rest of the stellar surface Cr is
enhanced by 2 dex in between the spots and up to 3.5 dex in the spotted areas.
5791 and 6882 Å, containing 8 and 4 Cr lines respectively. The Cr surface pattern is
qualitatively similar to that of Mn, although the Cr spots tend to be less constrained to the
stellar rotational equator. From the Cr spherical map shown in Fig. 8 it is clear that a
narrow ring of relative underabundance is found at the magnetic equator. This is the only region on
the surface of HR 3831 with a solar-like Cr concentration. On the rest of the stellar surface Cr is
enhanced by 2 dex in between the spots and up to 3.5 dex in the spotted areas.
Reconstruction of the iron surface map was carried out using the blend dominated by the
Fe I 6136.62 and 6137.70 Å spectral lines. The fairly complex variability of these spectral features, as observed in the CES spectra of HR 3831, suggests fine structuring of the Fe map. The distribution of this element is presented in Fig. 10, which reveals a stunning complexity of the horizontal abundance pattern and no obvious correlation with the magnetic field geometry. We infer that horizontal changes of the Fe concentration are typically constrained within ![]() 0.5 dex around the solar value, with occasional Fe abundance anomalies of up to
0.5 dex around the solar value, with occasional Fe abundance anomalies of up to ![]() 1.0 dex found in a few small spots.
1.0 dex found in a few small spots.
An interesting example of spectacular line profile modulation has been discovered here for the Co I and Co II lines in the spectrum of HR 3831. The variability of the strong line of singly ionized cobalt, 4660.62 Å, is illustrated in Fig. 6 and is reminiscent of the profile changes seen in the resonance doublet of Li I. This behaviour is confirmed by the red lines of Co I, such as ![]() 5352.05 Å, and discloses a two-spot abundance distribution. The first surface map of Co reconstructed with the DI technique (Fig. 8) shows that the position of the two large (
5352.05 Å, and discloses a two-spot abundance distribution. The first surface map of Co reconstructed with the DI technique (Fig. 8) shows that the position of the two large (
![]()
![]() )
spots coincides with the magnetic poles, where the abundance enhancement reaches
)
spots coincides with the magnetic poles, where the abundance enhancement reaches
![]() 4-5. Even in unspotted areas Co is typically overabundant by as much as 0.5-1.0 dex relative to the sun. The Co abundance anomaly is a typical spectroscopic signature of roAp stars (e.g., Ryabchikova et al. 2000a). Furthermore, the variability of the Co lines in another spotted roAp star, HD 24712 (Ryabchikova et al. 2000b), may correspond to a surface map very similar to the one we discovered in HR 3831.
4-5. Even in unspotted areas Co is typically overabundant by as much as 0.5-1.0 dex relative to the sun. The Co abundance anomaly is a typical spectroscopic signature of roAp stars (e.g., Ryabchikova et al. 2000a). Furthermore, the variability of the Co lines in another spotted roAp star, HD 24712 (Ryabchikova et al. 2000b), may correspond to a surface map very similar to the one we discovered in HR 3831.
The yttrium surface map was reconstructed using the Y II 5087.42 Å line and
spectra obtained with FEROS. The horizontal abundance pattern of this element is dominated by the
two spots (
![]() ), possibly associated with the magnetic poles, surrounded by
areas of nearly solar Y abundance. On the other hand, an enhancement of 0.5-1.0 dex compared to the
solar Y abundance is found along the magnetic equator.
), possibly associated with the magnetic poles, surrounded by
areas of nearly solar Y abundance. On the other hand, an enhancement of 0.5-1.0 dex compared to the
solar Y abundance is found along the magnetic equator.
Barium is another chemical element with outstanding spectroscopic variability in HR 3831. With
the high-quality CES data for the ![]() 6150 Å region we were able to study in detail the line profile changes of the 6141.71 Å line of Ba II and recover the first stellar surface map for this element. The rotational modulation of the Ba line is shown in Fig. 9 and indicates a very inhomogeneous surface structure. Indeed, the map recovered by INVERS12 (Fig. 10) shows a series of small (
6150 Å region we were able to study in detail the line profile changes of the 6141.71 Å line of Ba II and recover the first stellar surface map for this element. The rotational modulation of the Ba line is shown in Fig. 9 and indicates a very inhomogeneous surface structure. Indeed, the map recovered by INVERS12 (Fig. 10) shows a series of small (
![]() )
spots located at the stellar rotational equator. The Ba overabundance in the spots reaches a factor of 105, while the concentration of Ba in other surface regions does not differ from solar by more than
)
spots located at the stellar rotational equator. The Ba overabundance in the spots reaches a factor of 105, while the concentration of Ba in other surface regions does not differ from solar by more than ![]() 0.5 dex. Two of the main Ba spots occupy the negative and positive magnetic poles, the two smaller features are found at the intersection of the magnetic and rotational equators.
0.5 dex. Two of the main Ba spots occupy the negative and positive magnetic poles, the two smaller features are found at the intersection of the magnetic and rotational equators.
Doubly ionized praseodymium was studied with the two red lines, ![]() 6195.61 and
7030.39 Å. These spectral lines show pronounced doubling (see Fig. 6) close to the phases of the magnetic crossover. The first stellar surface abundance map of Pr (Fig. 8) reveals an overabundance of up to
6195.61 and
7030.39 Å. These spectral lines show pronounced doubling (see Fig. 6) close to the phases of the magnetic crossover. The first stellar surface abundance map of Pr (Fig. 8) reveals an overabundance of up to
![]() in the three spots. One of these features is found close to the expected position of the positive magnetic pole, while the other two are located on either side of the negative pole. This asymmetric structure in the recovered abundance map is not unexpected given the substantially different appearance of the Pr III line profile shapes at the rotation phases
in the three spots. One of these features is found close to the expected position of the positive magnetic pole, while the other two are located on either side of the negative pole. This asymmetric structure in the recovered abundance map is not unexpected given the substantially different appearance of the Pr III line profile shapes at the rotation phases
![]() and 0.5. The most prominent relative underabundance of Pr occurs in the magnetic equatorial regions. The Pr III concentration is inferred to be
and 0.5. The most prominent relative underabundance of Pr occurs in the magnetic equatorial regions. The Pr III concentration is inferred to be
![]() -2 there.
-2 there.
Doubly ionized neodymium lines exhibit asymmetric bumps around the phases of the best visibility of the magnetic equator. This behaviour is similar, but not identical to the rotational modulation of the Pr III lines. The high-quality spectroscopic data obtained with the CES for the Nd III 6145.07 Å line was employed in our analysis of the Nd surface distribution. In synthesizing this Nd III feature a minor blending contribution of the Si I 6145.04 Å line was included. The final Nd map is presented in Fig. 10 and shows a wide geometrical range of abundance patterns. First, there is a definite relative lack of Nd at the magnetic equator, where we find a close-to-solar abundance of this element. Secondly, the highest concentration of Nd III,
![]() ,
is detected in the two triangular
structures trailing behind the magnetic poles and constrained within latitudes of
,
is detected in the two triangular
structures trailing behind the magnetic poles and constrained within latitudes of ![]()
![]() .
.
The surface map of europium was derived from a well-known line of its first ion, Eu II 6645.10 Å. This and many other spectral lines of singly ionized Eu are affected by substantial hyperfine and isotope splitting. In modelling the Eu II 6645.10 Å line we explicitly took these effects into account by including 30 hfs and isotope (151Eu and 153Eu) components in the input line list. The relative strengths and positions of the components were estimated using the data from Lawler et al. (2001). The inferred Eu distribution is illustrated in Fig. 8 and can be approximated by a simple two-spot structure with
![]() and abundance in spots
and abundance in spots
![]() .
However, these spots are clearly displaced (by as much as
.
However, these spots are clearly displaced (by as much as
![]() for one of the spots) in longitude with respect to the stellar magnetic poles. On the other hand, the areas of maximum relative deficiency of Eu are characterized by
for one of the spots) in longitude with respect to the stellar magnetic poles. On the other hand, the areas of maximum relative deficiency of Eu are characterized by
![]() -0.5 and coincide with the position of the magnetic equator within the uncertainties of mutual phasing of our magnetic and abundance maps.
-0.5 and coincide with the position of the magnetic equator within the uncertainties of mutual phasing of our magnetic and abundance maps.
The inhomogeneous distribution of chemical abundances over the surfaces of magnetic Ap stars is
understood to be the result of a modification of the radiative diffusion processes by global stellar
magnetic fields. Theoretical studies of Michaud et al. (1981), Mégessier (1984) and
Babel & Michaud (1991) attempted to explain and predict horizontal abundance patterns using
a set of simplifying assumptions about the underlying physics and geometry of surface structures. These predictions are available for a few chemical elements only and have a limited range of applicability for stars of different
![]() and surface gravity. Hence, due to the absence of reliable up-to-date theoretical simulations of the surface diffusion processes in cool Ap stars, we are not able to compare the abundance maps reconstructed for HR 3831 with theoretical predictions. However, being by far the most detailed investigation of the stellar surface abundance geometry, our work can be used to set important constraints on the general observational framework that has to be considered by any theoretical models aimed at achieving a viable description of the surface phenomena in magnetic Ap stars.
and surface gravity. Hence, due to the absence of reliable up-to-date theoretical simulations of the surface diffusion processes in cool Ap stars, we are not able to compare the abundance maps reconstructed for HR 3831 with theoretical predictions. However, being by far the most detailed investigation of the stellar surface abundance geometry, our work can be used to set important constraints on the general observational framework that has to be considered by any theoretical models aimed at achieving a viable description of the surface phenomena in magnetic Ap stars.
The paradigm of an axisymmetric global magnetic field being the only phenomenon supporting and defining the geometry of the surface stellar structures was employed in numerous theoretical (e.g., Babel & Michaud 1991) and observational investigations (Landstreet 1988; Strasser et al. 2001). This led to a simple picture of chemical spots and rings, symmetric with respect to the magnetic field axis. The validity of this approach, which was, in fact, assumed rather than deduced from observations, was recently questioned by Kochukhov et al. (2002). They found that a multitude of chemical abundance structures in the magnetic Ap star ![]() CVn cannot be reduced to a system of spots and rings and that the distribution of some of the elements exhibits a clear asymmetry with respect to the dipolar magnetic field geometry of the star. Kochukhov et al. (2002) suggested that phenomena other than a magnetic field play a substantial role in determining the geometry of abundance structures. Stellar rotation, as well as its possible effect on magnetically confined mass loss, is likely to be a physical effect overlooked in theoretical models. The recent discovery of abundance inhomogeneities in the rapidly rotating non-magnetic Hg-Mn binary star
CVn cannot be reduced to a system of spots and rings and that the distribution of some of the elements exhibits a clear asymmetry with respect to the dipolar magnetic field geometry of the star. Kochukhov et al. (2002) suggested that phenomena other than a magnetic field play a substantial role in determining the geometry of abundance structures. Stellar rotation, as well as its possible effect on magnetically confined mass loss, is likely to be a physical effect overlooked in theoretical models. The recent discovery of abundance inhomogeneities in the rapidly rotating non-magnetic Hg-Mn binary star ![]() And (Adelman et al. 2002) and the observation of the coexistence of a very complex magnetic field and relatively simple abundance structures in 53 Cam (Kochukhov et al. 2004) corroborates this hypothesis.
And (Adelman et al. 2002) and the observation of the coexistence of a very complex magnetic field and relatively simple abundance structures in 53 Cam (Kochukhov et al. 2004) corroborates this hypothesis.
A comprehensive study of the surface chemical maps presented here for HR 3831 constitutes the most detailed investigation of the surface inhomogeneities in an Ap star. By this virtue our analysis provides a sufficient basis for some general conclusions which were not well substantiated by the results of previous DI studies of Ap stars, typically limited to 3-4 chemical species. The abundance maps of HR 3831 recovered in this work firmly establish numerous examples of surface patterns which do not follow the symmetry of the dipolar magnetic topology. Although for Li, C, O and, possibly, Co we derived highly symmetric maps with an obvious correlation with the magnetic field structure, this is shown to be an exception rather than a general rule. Furthermore, the exceedingly high quality of the CES spectra employed in our modelling of HR 3831 for the first time allowed us to probe the geometry of the surface abundance structures down to the fundamental resolution limit of DI. We find that structures in abundance maps exist even at the smallest scales, which is inconsistent with the global field being the only important effect for diffusion. Instead, it appears probable that we observe a complex and dynamic interaction of rotation, magnetic field and mass loss, with all these effects being equally important for most of the elements. Thus, we stress that the common idealized picture of abundance spots and rings tracing the symmetry of the underlying magnetic field structure is not confirmed and, therefore, cannot be assumed a priori in either empirical modelling or theoretical investigations of horizontal structures.
Another important conclusion which can be drawn from the abundance maps of HR 3831 is the large diversity of the surface chemical pattern geometries, which is found even for elements with similar atomic weights. For example, it is widely believed that all rare-earth elements are concentrated in localized areas around magnetic poles. This picture has emerged from a few early line profile studies of Eu II lines in hot Ap stars (e.g., Falk & Wehlau 1974). Our study demonstrates that Eu behaviour is not typical for other REEs. We find Eu to be concentrated in two small spots, which are substantially displaced from the magnetic poles of HR 3831, while Pr and Nd show a totally different surface pattern compared to that of Eu. In particular, the structures in the Nd abundance map are best described as spots of relative underabundance at the magnetic equator (present for other REEs as well) rather than conform to a standard "REEs at the poles'' hypothesis. Ironically, the most "REE-like'' behaviour in HR 3831 is found for Li and Co, but not for REEs themselves. Thus, there exist substantial differences between surface distributions of elements with similar atomic weights. Such discrepancies are also expected for abundance distributions of the same ions in different stars. Consequently, we emphasize that one should never extrapolate an abundance pattern found for a particular element in an Ap star to other chemical species and stars. However, we identified at least one pleasing exception from this bewildering picture: oxygen is consistently found in a ring at the magnetic equator in stars with a dipolar field (this work; Rice et al. 1997). Hence, at the moment, oxygen represents the most suitable chemical element for an in-depth investigation of the horizontal variation of the diffusion processes in magnetic Ap stars.
Since the first detections of p-mode pulsations in narrow wavelength regions (Baldry et al.
1998a) and individual spectral lines (Kanaan & Hatzes 1998) of roAp stars it became clear that the spectroscopic oscillation behaviour of magnetic pulsators is drastically different from that of ![]() Scuti stars which occupy almost the same region in the HR diagram. Whereas in classical dwarf non-radially pulsating stars all metal lines show synchronous radial velocity and line profile variations, roAp spectra are distinguished by a surprisingly diverse pulsational behaviour. Pulsation amplitude differences of up to a factor of 100 were found for some lines in roAp stars (notably,
Scuti stars which occupy almost the same region in the HR diagram. Whereas in classical dwarf non-radially pulsating stars all metal lines show synchronous radial velocity and line profile variations, roAp spectra are distinguished by a surprisingly diverse pulsational behaviour. Pulsation amplitude differences of up to a factor of 100 were found for some lines in roAp stars (notably, ![]() Equ, Kochukhov & Ryabchikova 2001a), sometimes accompanied by an antiphase radial velocity (RV) variation (Baldry et al. 1998a; Mkrtichian et al. 2003).
Equ, Kochukhov & Ryabchikova 2001a), sometimes accompanied by an antiphase radial velocity (RV) variation (Baldry et al. 1998a; Mkrtichian et al. 2003).
The observational aspect of the diverse pulsational properties of individual spectral lines was clarified by Savanov et al. (1999) and Kochukhov & Ryabchikova (2001a,b). In particular, the latter two studies convincingly demonstrated that previous claims of the detection of pulsations in the lines of iron-peak and light elements (Kanaan & Hatzes 1998) stem from an incorrect line identification and that all instances of high-amplitude pulsational variability in the spectra of ![]() Equ,
Equ, ![]() Cir and HR 3831 are invariably associated with pulsations in REE lines, such as Pr III, Nd II and Nd III. This discovery was confirmed by follow up time-resolved spectroscopic investigations in wide spectral regions and in other roAp stars (Balona 2002; Balona & Zima 2002; Kurtz et al. 2003).
Cir and HR 3831 are invariably associated with pulsations in REE lines, such as Pr III, Nd II and Nd III. This discovery was confirmed by follow up time-resolved spectroscopic investigations in wide spectral regions and in other roAp stars (Balona 2002; Balona & Zima 2002; Kurtz et al. 2003).
In the context of the present study of HR 3831 we note that the highest amplitude pulsational RV variability detected in our CES spectra is associated with the Nd III 6145.07 Å line (RV semi-amplitude of up to 1.8 km s-1), while Ca I, Fe I and Fe II lines do not show pulsation shifts above a few tens m s-1 (Kochukhov & Ryabchikova 2001b; Kochukhov 2003).
In the early stages of spectroscopic pulsational analysis of roAp stars it was expected that
considerations of the effects related to surface abundance inhomogeneities would provide an ultimate
explanation of the observed differences in pulsational behaviour. Furthermore, different sampling of
the stellar disk by lines of inhomogeneously distributed chemical species was appreciated as a tool for mode identification of roAp pulsations (Mkrtichian 1994). Indeed, our DI study of HR 3831 reveals several examples of vastly dissimilar surface abundance structures, which in theory could be used as spatial filters to constrain the surface geometry of pulsational fluctuations and eventually verify the alignment of pulsational and magnetic axes postulated by the oblique pulsator model (Kurtz 1982). For instance, a study of the differential RV variability of Li and O could be sufficient to distinguish ![]() from
from ![]() or 3 modes in HR 3831. Unfortunately, neither Li nor O, nor any other light or iron-peak element is known to show measurable pulsational shifts in HR 3831. Up to now variability is unambiguously detected only in REE lines, and this situation appears to be typical for the whole class of roAp pulsators. Thus, mode identification by means of spatial filtering by different surface abundance structures is unlikely to be a viable option for roAp stars.
or 3 modes in HR 3831. Unfortunately, neither Li nor O, nor any other light or iron-peak element is known to show measurable pulsational shifts in HR 3831. Up to now variability is unambiguously detected only in REE lines, and this situation appears to be typical for the whole class of roAp pulsators. Thus, mode identification by means of spatial filtering by different surface abundance structures is unlikely to be a viable option for roAp stars.
A similar failure is encountered by attempts to relate anomalous pulsational variability of REE lines to surface distributions of heavy elements. Some authors (e.g., Kanaan & Hatzes 1998; Baldry et al. 1998b; Balona 2002) suggested that high-amplitude pulsations of REE lines are explainable by accumulation of these elements at the magnetic poles, where pulsational fluctuations are expected to attain maximum amplitudes for the oblique ![]() pulsator model. Yet before the present work no DI maps of roAp stars were available. Hence, a relation of pulsational variability and abundance spots could not be confirmed or disproved. Here we presented the first maps of surface distribution of chemical elements, such as Pr III and Nd III, whose lines dominate the pulsational behaviour of roAp stars. However, as already discussed above, we do not detect high-contrast spots of these ions at the magnetic poles. Pr III and Nd III tend to avoid the magnetic equator regions, but sample other parts of
the stellar surface. Furthermore, the characteristics of the abundance patterns of many non-pulsating elements studied by us in HR 3831 cast doubt on any claims of the existence of a specific relation between horizontal abundance patterns and pulsational behaviour. One would need to invoke huge abundance inhomogeneities of, e.g., Ca and Fe, to explain the small pulsational amplitudes of the lines of these elements. For the dominant
pulsator model. Yet before the present work no DI maps of roAp stars were available. Hence, a relation of pulsational variability and abundance spots could not be confirmed or disproved. Here we presented the first maps of surface distribution of chemical elements, such as Pr III and Nd III, whose lines dominate the pulsational behaviour of roAp stars. However, as already discussed above, we do not detect high-contrast spots of these ions at the magnetic poles. Pr III and Nd III tend to avoid the magnetic equator regions, but sample other parts of
the stellar surface. Furthermore, the characteristics of the abundance patterns of many non-pulsating elements studied by us in HR 3831 cast doubt on any claims of the existence of a specific relation between horizontal abundance patterns and pulsational behaviour. One would need to invoke huge abundance inhomogeneities of, e.g., Ca and Fe, to explain the small pulsational amplitudes of the lines of these elements. For the dominant ![]() mode of HR 3831 all non-pulsating elements should be constrained to a narrow region around the magnetic equator and show a rotational line profile modulation similar to the one found for
the O I IR triplet. This picture is not confirmed by our spectra and abundance maps of HR 3831: Ca and Fe sample the whole stellar surface and do not avoid the magnetic poles. Thus, we conclude that horizontal abundance inhomogeneities cannot explain the differences in pulsational behaviour of lines in the HR 3831 spectrum. An effect of the abundance spots on RV amplitudes is marginal at most and is totally obscured by another phenomenon responsible for large pulsations of REE lines.
mode of HR 3831 all non-pulsating elements should be constrained to a narrow region around the magnetic equator and show a rotational line profile modulation similar to the one found for
the O I IR triplet. This picture is not confirmed by our spectra and abundance maps of HR 3831: Ca and Fe sample the whole stellar surface and do not avoid the magnetic poles. Thus, we conclude that horizontal abundance inhomogeneities cannot explain the differences in pulsational behaviour of lines in the HR 3831 spectrum. An effect of the abundance spots on RV amplitudes is marginal at most and is totally obscured by another phenomenon responsible for large pulsations of REE lines.
The absence of a clear causal connection of horizontal abundance structures and spectroscopic
pulsational variability of HR 3831 indirectly confirms an alternative explanation of the pulsational
behaviour of roAp stars. Several recent studies (Bagnulo et al. 2001; Ryabchikova et al.
2001,2003) have established the universal presence of significant vertical stratification of the chemical abundance in the atmospheres of cool Ap stars. Ryabchikova et al. (2002) carried out a comprehensive study of vertical abundance gradients in the atmosphere of the roAp star
![]() Equ. According to this LTE analysis all iron-peak and light elements are accumulated
deep in the atmosphere (
Equ. According to this LTE analysis all iron-peak and light elements are accumulated
deep in the atmosphere (
![]()
![]() -1), while REEs are levitated in the very high
atmospheric layers, above
-1), while REEs are levitated in the very high
atmospheric layers, above
![]()
![]() -7. The presence of REE enhancement high in the
atmospheres of cool pulsating Ap stars was first proposed by Ryabchikova et al. (2001) and was discussed in the context of pulsations in HR 3831 by Kochukhov & Ryabchikova (2001b)
and Kochukhov (2003). This empirical model explains the unexpectedly strong lines of doubly ionized REE lines (an anomaly found in
all roAp stars) and, at the same time, offers a reasonable framework for interpreting the
observed pulsational behaviour of REE features by suggesting that they originate in the layers
characterized by an extreme amplitude of pulsational motions. An observation of comparable pulsational signatures in Nd III lines and the Doppler core of H
-7. The presence of REE enhancement high in the
atmospheres of cool pulsating Ap stars was first proposed by Ryabchikova et al. (2001) and was discussed in the context of pulsations in HR 3831 by Kochukhov & Ryabchikova (2001b)
and Kochukhov (2003). This empirical model explains the unexpectedly strong lines of doubly ionized REE lines (an anomaly found in
all roAp stars) and, at the same time, offers a reasonable framework for interpreting the
observed pulsational behaviour of REE features by suggesting that they originate in the layers
characterized by an extreme amplitude of pulsational motions. An observation of comparable pulsational signatures in Nd III lines and the Doppler core of H![]() in
in ![]() Equ (Kochukhov 2003) corroborates this model.
Equ (Kochukhov 2003) corroborates this model.
Thus, it is a vertical abundance stratification, and not horizontal abundance variation, that holds the key to understanding roAp spectroscopic pulsation observables. As discussed by Kochukhov (2003), simultaneous consideration of the spatial filtering of pulsations by the vertical abundance profiles and assessment of the horizontal geometry of pulsational disturbances with various mode identification methods opens an exciting possibility of probing the 3-D structure of roAp pulsating cavities. Such detailed models of roAp pulsations will certainly help to harvest unique astrophysical information and to achieve a remarkable breakthrough in understanding the interplay between diffusion, magnetic field and p-mode pulsations in cool magnetic stars.
Acknowledgements
This work was supported by the Austrian Science Fund through the Lise Meitner fellowship to OK (project No. M757-N02) and has been partly funded by the Swedish National Research Council. N.A.D. acknowledges financial support of MCT (381.744/00-0) and computing support of FAPERJ (E-26/171.647/99).
We acknowledge extensive use of the SIMBAD database, operated at CDS, Strasbourg, France.
![\begin{displaymath}%
E = \sum_\varphi \sum_\lambda \left[ I^\star_{\rm calc}(\la...
...right]^2/\sigma^2_{\rm obs}(\lambda,\varphi) + R(\varepsilon),
\end{displaymath}](/articles/aa/full/2004/36/aa0517-04/img86.gif)