| (1) |
A&A 422, 1113-1121 (2004)
DOI: 10.1051/0004-6361:20040141
Y. Zhang - Y. Zhao
National Astronomical Observatories, Chinese Academy of Sciences, Beijing 100012, PR China
Received 6 May 2003 / Accepted 4 March 2004
Abstract
Data mining is an important and challenging problem for the efficient analysis of large astronomical databases and will become even more important with the development of the Global Virtual Observatory. In this study, learning vector quantization (LVQ), single-layer perceptron (SLP) and support vector machines (SVM) were used for multi-wavelength data classification. A feature selection technique was used to evaluate the significance of the considered features for the results of classification. We conclude that in the situation of fewer features, LVQ and SLP show better performance. In contrast, SVM shows better performance when considering more features. The focus of the automatic classification is on the development of an efficient feature-based classifier. The classifiers trained by these methods can be used to preselect AGN candidates.
Key words: methods: data analysis - methods: statistical - astronomical data bases: miscellaneous - catalogs
Today, there are many impressive archives painstakingly constructed from observations associated with a given instrument. The Hubble Space Telescope (HST), the Chandra X-ray Observatory, the Sloan Digital Sky Survey (SDSS), the Two Micron All Sky Survey (2MASS) and the Digitized Palomar Observatory Sky Survey (DPOSS) are examples of this. Regular advances in electronics bring new instruments, doubling the amount of data we collect each year. For example, approximately a gigapixel is present on all telescopes today, and new gigapixel instruments are under construction. This trend is bound to continue. Astronomy is facing a "data avalanche" (Szalay & Gray 2001). How to organize, use, and make sense of the enormous amounts of data generated is an important consequence of this. It is very time consuming and demands high quality human resources. Therefore, better features and better classifiers are required. Expert systems are also useful to extract quantitative information.
One solution to such a problem is given by Neural Networks (NNs), because they permit application of expert knowledge and experience through network training. Astronomical object classification based on neural networks requires no priori assumptions or knowledge of the data to be classified, as some conventional methods need. Neural networks, over the years, have proven to be a powerful tool capable of extracting reliable information and patterns from large amounts of data even in the absence of models describing the data (cf. Bishop 1995) and have a wide range of applications in the astronomical community: catalogue extraction (Andreon et al. 2000), star/galaxy classification (Odewahn et al. 1992; Naim et al. 1995; Miller & Coe 1996; Mähönen & Hakala 1995; Bertin & Arnout 1996; Bazell & Peng 1998), galaxy morphology (Storrie-Lombardi et al. 1992; Lahav et al. 1996), classification of stellar spectra (Bailer-Jones et al. 1998; Allende Prieto et al. 2000; Weaver 2000). See also the important recent contribution by Andreon et al. (2000) covering a large number of neural algorithms.
In this work, a class of supervised neural networks called learning vector quantization (LVQ) is proposed. LVQ shares the same network architecture as the Kohonen self-organizing map (SOM), although it uses a supervised learning algorithm. Bazell & Peng (1998) pioneered the use of it in astronomical applications. Another class of supervised neural networks called multi-layer perceptrons (MLP) is presented. Goderya & McGuire (2000) summarized the progress made in the development of automated galaxy classifiers using neural networks including MLP. Qu et al. (2003) compared multi-layer perceptrons (MLP), the radial basis function (RBF), and support vector machines (SVM) classifiers for solar-flare detection. Meanwhile, an automated algorithm called support vector machines (SVM) for classification was introduced. The approach was originally developed by Vapnik (1995). Wozniak et al. (2001) and Humphreys et al. (2001) pioneered the use of SVM in astronomy. Wozniak et al. (2001) evaluated SVM, K-means and Autoclass for automated classification of variable stars and compared their effectiveness. Their results suggested the very high efficiency of SVM in isolating a few best defined classes from the rest of the sample, and good accuracy for all classes considered simultaneously. Humphreys et al. (2001) used different classification algorithms including decision trees, K-nearest neighbor and support vector machines to classify the morphological type of the galaxy.
Celestial objects radiate energy over an extremely wide range of wavelengths from radio waves to infrared, optical to ultraviolet, X-ray and even gamma rays. Observations in each of these wavelengths carry important information about the nature of the objects observed. Different physical processes show different properties in different bands. Based on these, we apply learning vector quantization (LVQ), single-layer perceptron (SLP) and support vector machines (SVM) to classify AGNs, stars and normal galaxies with data from optical, X-ray and infrared bands. We present the principles of LVQ, SLP and SVM in Sect. 2. In Sect. 3, we discuss the sample selection and analyze the distribution of parameters. In Sect. 4 the computed results and discussion are given. In Sect. 5 we conclude this paper with a discussion of the general technique and its applicability.
Our adopted learning vector quantization (LVQ) algorithm is based upon the LVQ_PAK routines developed at the Laboratory of Computer and Information Sciences, Helsinki University of Technology, Finland. Their software can be obtained via the WWW from www.cis.hut.fi/research/lvq_pak/. For application of LVQ in astronomy, see the papers of Bazell & Peng (1998) and Cortiglioni et al. (2001).
The LVQ method was developed by Kohonen (1989) who also developed the popular unsupervised classification technique known as self-organizing map or topological map neural networks (Kohonen 1989, 1990). SOM performs a mapping from an n-dimensional input vector onto a two-dimensional array of nodes that is usually displayed in a rectangular or hexagonal lattice. The mapping is performed in such a way as to preserve the topology of the input data. This means that input vectors that are similar to each other are mapped to neighboring regions of the two-dimensional output lattice. Each node in the output lattice has an n-dimensional reference vector of weights associated with it, one weight for each element of the input vector. The SOM functions compare the distance, in a suitable form, between each input vector and each reference vector in an iterative manner. With each iteration, the reference vectors are moved around in the output space until their positions converge to a stable state. When the reference vector that is closest to a given input vector is found (the winning reference vector), that reference vector is updated to more closely match the input vector. This is the learning step.
LVQ uses the same internal architecture as SOM: a set of n-dimensional input vectors are mapped onto a two-dimensional lattice, and each node of the lattice has an n-dimensional reference vector associated with it. The learning algorithm for LVQ, i.e., the method of updating the reference vectors, is different from that of SOM. Because LVQ is a supervised method, during the learning phase the input data are tagged with their correct class. We define the input vector x as:
| (1) |
| (2) |
 |
(3) |
| (4) |
| (5) |
| (6) |
| (7) |
 |
(8) |
Given some training data
| (9) |
| (10) |
 |
(11) |
![\begin{displaymath}L(\omega,b,\alpha)=\frac{1}{2}\omega \cdot \omega -\sum_{i=1}^{l}
{\alpha}_i\left([(\omega \cdot x_i)+b]y_i-1\right),
\end{displaymath}](/articles/aa/full/2004/30/aa3942/img17.gif) |
(12) |
The saddle point is defined as follows:
 |
(13) |
 |
(14) |
 |
(15) |
 |
(16) |
| (17) |
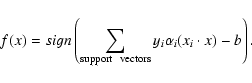
To generalize to non-linear classification, we replace the dot product with a kernel [![]() ]. For the binary classification, see Stitson et al. (1996) and Gunn (1998). For the multi-class classification, see Weston & Watkins (1998).
]. For the binary classification, see Stitson et al. (1996) and Gunn (1998). For the multi-class classification, see Weston & Watkins (1998).
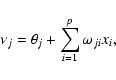
Multi-layer perceptrons (MLP) are feedforward neural networks trained with the standard backpropagation algorithm. If no hidden layers are present, MLP are also called single-layer perceptrons. They are supervised networks, so they require a desired response to be trained. They learn how to transform input data into a desired response, so they are widely used for pattern classification. With one or two hidden layers, they can approximate virtually any input-output map. They have been shown to approximate the performance of optimal statistical classifiers in difficult problems. Most neural network applications involve MLP.
The basic MLP unit is a model of an artificial neuron. The unit computes the weighted sum of the inputs plus the threshold weight and passes this sum through the activation function (usually sigmoid) (18) and (19):
 |
(18) |
 |
(19) |
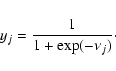 |
(20) |
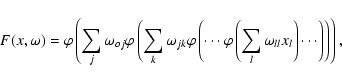
A multilayer perceptron represents a nested sigmoidal scheme (18); its form for a single output neuron is
 |
(21) |
Usually, astronomical object classification is based on the properties of spectra, photometry, multiwavelength measurements and so on. To check the effectiveness and the efficiency of our methods, we classified objects with data from X-ray (ROSAT), optical (USNO-A2.0) and infared (2MASS) bands. By positional cross-correlation of ROSAT, USNO-A2.0 and 2MASS databases, we obtain the multi-wavelength data.
The ROSAT All-Sky survey (RASS) uses an imaging X-ray Telescope (Trümper 1983) and the data are well suited for investigating the X-ray properties of astronomical objects. The RASS Bright Source Catalogue (RBSC) includes 18 811 sources, with a limiting ROSAT PSPC countrate of 0.05 counts s-1 in the 0.1-2.4 keV energy band. The typical positional accuracy is 30''. Similarly, the RASS Faint Source Catalogue (RFSC) contains 105 924 sources and represents the faint extension to the RBSC. The RBSC and RFSC catalogues contain the ROSAT name, position in equatorial coordinates, the positional error, the source countrate (![]() )
and error, the background countrate, exposure time, hardness-ratios
)
and error, the background countrate, exposure time, hardness-ratios ![]() and
and ![]() and errors, extent (
and errors, extent (![]() )
and likelihood of extent (
)
and likelihood of extent (
![]() ), and likelihood of detection. The two hardness ratios
), and likelihood of detection. The two hardness ratios ![]() and
and ![]() represent X-ray colors. From the count rate A in the 0.1-0.4 keV energy band and the count rate B in the 0.5-2.0 keV energy band,
represent X-ray colors. From the count rate A in the 0.1-0.4 keV energy band and the count rate B in the 0.5-2.0 keV energy band, ![]() is given by:
is given by:
![]() .
.
![]() is determined from the count rate C in the 0.5-0.9 keV energy band and the count rate D in the 0.9-2.0 keV energy band by:
is determined from the count rate C in the 0.5-0.9 keV energy band and the count rate D in the 0.9-2.0 keV energy band by:
![]() .
.
![]() is the ROSAT total count rate in counts s-1. The parameters of
is the ROSAT total count rate in counts s-1. The parameters of ![]() and
and
![]() are the source extent in arcseconds and the likelihood of the source extent in arcseconds, respectively.
are the source extent in arcseconds and the likelihood of the source extent in arcseconds, respectively. ![]() is the amount by which the source image exceeds the point spread function. The parameters of
is the amount by which the source image exceeds the point spread function. The parameters of ![]() and
and
![]() reflect whether sources are point sources or extent sources. For example, stars or quasars are point sources; galaxies or galaxy clusters are extented sources. Thus
reflect whether sources are point sources or extent sources. For example, stars or quasars are point sources; galaxies or galaxy clusters are extented sources. Thus ![]() and
and
![]() are useful for classification of objects.
are useful for classification of objects.
The USNO-A2.0 (Monet et al. 1998) is a catalog of 526 280 881 stars over the full sky, compiled by the US Naval Observatory, which contains stars down to about 20 mag over the whole sky. Its astrometric precision is non-uniform, depending on positions on Schmidt plates, typically better than 1''. USNO-A2.0 presents right ascension and declination (J2000, epoch of the mean of the blue and red plate) and the blue and red magnitude for each star.
The infrared data is the first large incremental data release from the Two Micron All Sky Survey (2MASS). This release covers 2483 square degrees of the northern sky observed from the 2MASS facility at Mt. Hopkins, AZ. The catalogue contains 20.2 million point and 73 980 extended sources, and includes three band magnitudes J (1.25 ![]() m), H (1.65
m), H (1.65 ![]() m) and
m) and ![]() (2.17
(2.17 ![]() m).
m).
For supervised methods, the input sample must be tagged with known classes. We choose known AGNs from the catalog of Véron-Cetty & Véron (2000), which contains 13 214 quasars, 462 BL Lac objects and 4428 active galaxies (of which 1711 are Seyfert 1). Stars include all spectral classes, dwarfs and variable stars, adopted from the SIMBAD database. Normal galaxies are from Third Reference Catalogue of Bright Galaxies (RC3; de Vaucouleurs et al. 1991).
Studying the clustering properties of astronomical objects in a multidimensional parameter space needs catalogue cross-correlation to get multi-wavelength parameters for all sources. Firstly, within a search radius of 3 times the RBSC and RFSC positional error, we positionally cross-identified the catalogue of USNO-A2.0 with the RBSC and RFSC X-ray sources, and then cross-matched the data from X-ray and optical bands with infared sources in the 2MASS first release database within a 10 arcsec radius. Secondly, we similarly cross-identified the data from three bands with the catalogues of AGNs, stars and normal galaxies within a 5 arcsec radius. Only considering the unique entries, the total sample contains 1656 (29.9%) AGNs, 3718 (67.0%) stars and 173 (3.1%) normal galaxies.
The obtained data of AGNs, stars and galaxies with catalogue counterparts are divided into four subclasses, (i) unique entries, (ii) multiple entries, (iii) the same entries, (iv) no entries. Unique entries refer to the objects that have only one catalogue entry in the various catalogues, or that have a unique identification in private catalogues. Multiple entries refer to the objects that have more than one catalogue entry in various catalogues. The same entries point to the two or three kinds of objects that have the same catalogue counterparts. The sample here is obtained by multi-wavelength cross-identification. Due to positional errors, some sources unavoidably match the unrelated sources. Thus we only consider the unique entries. Certainly, we need to compute the probability of identifications of the counterparts such as Mattox et al. (1997) and Rutledge et al. (2000) for cross-association.
Our method is based on optical classification, X-ray characteristics like hardness ratios and extent parameter, and infrared classification (Stocke et al. 1991; Motch et al. 1998; Pietsch et al. 1998; He et al. 2001). According to the results of the Einstein Medium Sensitivity Survey (EMSS; Stocke et al. 1991), the X-ray-to-optical flux ratio,
![]() ,
was found to be very different for different classes of X-ray emitters. Motch et al. (1998) stated that, for source classification, the most interesting parameters are flux ratios in various energy bands, including the conventional X-ray hardness ratios,
,
was found to be very different for different classes of X-ray emitters. Motch et al. (1998) stated that, for source classification, the most interesting parameters are flux ratios in various energy bands, including the conventional X-ray hardness ratios,
![]() ratios as well as optical colors. They also stated that, although stars and AGNs have similar X-ray colors, their mean X-ray to optical ratios are obviously quite different and they are well separated in the
ratios as well as optical colors. They also stated that, although stars and AGNs have similar X-ray colors, their mean X-ray to optical ratios are obviously quite different and they are well separated in the
![]() vs.
vs.
![]() diagram. Cataclysmic variables exhibit a large range of X-ray colors and
diagram. Cataclysmic variables exhibit a large range of X-ray colors and
![]() ratios and can be somewhat confused with both AGNs and the most active part of the stellar population. However, the addition of a B-V or U-B optical index would allow further discrimination between these overlapping populations. He et al. (2001) stated that galactic stars usually have bright optical magnitudes and weak X-ray emission, galaxies have fainter optical magnitudes and median X-ray emission, and AGNs have the faintest magnitudes and strongest X-ray emission. In their Fig. 1 of
ratios and can be somewhat confused with both AGNs and the most active part of the stellar population. However, the addition of a B-V or U-B optical index would allow further discrimination between these overlapping populations. He et al. (2001) stated that galactic stars usually have bright optical magnitudes and weak X-ray emission, galaxies have fainter optical magnitudes and median X-ray emission, and AGNs have the faintest magnitudes and strongest X-ray emission. In their Fig. 1 of
![]() vs. mV, AGNs and non-AGNs occupy different zones. Pietsch et al. (1998) used a conservative extent criterion (
vs. mV, AGNs and non-AGNs occupy different zones. Pietsch et al. (1998) used a conservative extent criterion (
![]() and
and
![]() )
as an indicator that the X-ray emission does not originate from a nuclear source. Since the corresponding parameter spaces overlap significantly for different classes of objects, an unambiguous identification based on one band of data alone is not possible. To classify sources, we consider the data from optical, X-ray and infrared bands. The chosen parameters from different bands are B-R (optical index),
)
as an indicator that the X-ray emission does not originate from a nuclear source. Since the corresponding parameter spaces overlap significantly for different classes of objects, an unambiguous identification based on one band of data alone is not possible. To classify sources, we consider the data from optical, X-ray and infrared bands. The chosen parameters from different bands are B-R (optical index),
![]() (optical-X-ray index),
(optical-X-ray index), ![]() ,
,
![]() (X-ray index),
(X-ray index), ![]() (X-ray index),
(X-ray index), ![]() ,
,
![]() ,
J-H (infrared index),
,
J-H (infrared index),
![]() (infrared index),
(infrared index),
![]() (infrared-X-ray index). Motch et al. (1998) showed that the X-ray to optical flux ratio can be approximately
(infrared-X-ray index). Motch et al. (1998) showed that the X-ray to optical flux ratio can be approximately
![]() ,
assuming an average energy conversion factor of 1 PSPC cts s-1 for a 10-11 erg cm-2 s-1 flux in the range of 0.1 to 2.4 keV. Thus
,
assuming an average energy conversion factor of 1 PSPC cts s-1 for a 10-11 erg cm-2 s-1 flux in the range of 0.1 to 2.4 keV. Thus
![]() can be viewed as an X-ray-to-optical flux ratio, similarly,
can be viewed as an X-ray-to-optical flux ratio, similarly,
![]() is an X-ray-to-infrared flux ratio.
is an X-ray-to-infrared flux ratio.
The mean values of parameters for the sample are given in Table 1. Table 1 indicates that some mean values have rather large scatters. The B-R value of normal galaxies is obviously larger than those of AGNs and stars; the ![]() value of AGNs is higher than those of stars and normal galaxies. For the mean values of
value of AGNs is higher than those of stars and normal galaxies. For the mean values of ![]() ,
which subdivides the hard range, there are only marginal differences between the individual classes of objects. This applies to the total sample. There is a trend that galaxies seem to have somewhat higher
,
which subdivides the hard range, there are only marginal differences between the individual classes of objects. This applies to the total sample. There is a trend that galaxies seem to have somewhat higher
![]() values than AGNs and stars. AGNs and stars have on average a lower
values than AGNs and stars. AGNs and stars have on average a lower ![]() ,
i.e., they have a softer spectral energy distribution (SED). A significantly harder SED is found for normal galaxies with
,
i.e., they have a softer spectral energy distribution (SED). A significantly harder SED is found for normal galaxies with
![]() .
This is indeed what is expected for this class of objects which exhibits a rather hard intrinsic spectrum caused by thermal bremsstrahlung from a hot (
107-108 K) plasma (cf. e.g., Böhringer 1996). The mean values of
.
This is indeed what is expected for this class of objects which exhibits a rather hard intrinsic spectrum caused by thermal bremsstrahlung from a hot (
107-108 K) plasma (cf. e.g., Böhringer 1996). The mean values of ![]() and
and
![]() of normal galaxies are apparently larger than AGNs and stars. Furthermore, those of AGNs are larger than stars. As Table 1 shows, galaxies are not only 0.76 mag in J-H, but they also have H-K values, 0.37 mag, redder than stars. Likewise, AGNs are redder than stars, too. We also find that the mean
of normal galaxies are apparently larger than AGNs and stars. Furthermore, those of AGNs are larger than stars. As Table 1 shows, galaxies are not only 0.76 mag in J-H, but they also have H-K values, 0.37 mag, redder than stars. Likewise, AGNs are redder than stars, too. We also find that the mean
![]() and
and
![]() values of AGNs are much higher than those of stars and galaxies. This can be explained by the fact that AGNs are strong X-ray emitters.
values of AGNs are much higher than those of stars and galaxies. This can be explained by the fact that AGNs are strong X-ray emitters.
![\begin{figure}
\par\includegraphics[width=7.3cm]{1.eps}\hspace*{4mm}
\includegra...
...dth=7.5cm]{7.eps}\hspace*{4mm}
\includegraphics[width=7.4cm]{8.eps}
\end{figure}](/articles/aa/full/2004/30/aa3942/img58.gif) |
Figure 1: Results of the analysis of RBSC and RFSC sources for 1656 AGNs (solid line) and 3891 S&G (dotted line). |
| Open with DEXTER | |
![\begin{figure}\par\includegraphics[width=7.6cm]{9.eps}\hspace*{4mm}
\includegraphics[width=7.5cm]{10.eps}
\end{figure}](/articles/aa/full/2004/30/aa3942/img59.gif) |
Figure 1: continued. |
| Open with DEXTER | |
Table 1: The mean values of parameters for the samples.
To see the difference, we plot the histograms as in Voges et al. (1999). In Fig. 1 we present the distributions of ten parameters of AGNs and S&G (stars and normal galaxies). From the distributions of B-R,
![]() ,
J-H, H-K,
,
J-H, H-K,
![]() ,
it is obvious that AGNs are different from stars and galaxies. While for the distributions of
,
it is obvious that AGNs are different from stars and galaxies. While for the distributions of ![]() ,
,
![]() ,
,
![]() ,
,
![]() ,
,
![]() ,
AGNs overlap with stars and galaxies. In other words,
,
AGNs overlap with stars and galaxies. In other words,
![]() and
and
![]() are the most important attributes to be used for classification. B-R, J-H and H-K are also important. The others contribute little. To determine the best combination of parameters for discrimination of AGNs, stars and galaxies, we probe 2-dimensional, 5-dimensional and ten-dimensional spaces.
are the most important attributes to be used for classification. B-R, J-H and H-K are also important. The others contribute little. To determine the best combination of parameters for discrimination of AGNs, stars and galaxies, we probe 2-dimensional, 5-dimensional and ten-dimensional spaces.
Since
![]() and
and
![]() may be important features, we select
may be important features, we select
![]() and
and
![]() as classification criteria to discriminate stars and galaxies from AGNs. If
as classification criteria to discriminate stars and galaxies from AGNs. If
![]() ,
the objects belong to AGNs, otherwise, to stars and galaxies. Similarly, if
,
the objects belong to AGNs, otherwise, to stars and galaxies. Similarly, if
![]() ,
the objects belong to AGNs, otherwise, to stars and galaxies. The situation is divided into three phases: only considering
,
the objects belong to AGNs, otherwise, to stars and galaxies. The situation is divided into three phases: only considering
![]() ,
only considering
,
only considering
![]() and considering both criteria. The results of the classification are presented in Table 2. The accuracy for each situation is 94.0%, 96.5% and 94.9%, respectively. The results are comparable for the three situations.
and considering both criteria. The results of the classification are presented in Table 2. The accuracy for each situation is 94.0%, 96.5% and 94.9%, respectively. The results are comparable for the three situations.
Table 2: Result of classification for three situations.
Table 3: Result of classification by LVQ.
To understand which parameter combination is best, we explore the bidimensional space composed of
![]() and
and
![]() ,
the 5D space composed of
,
the 5D space composed of
![]() ,
B-R, J-H, H-K and
,
B-R, J-H, H-K and
![]() ,
and the 10D space composed of the ten parameters. Randomly dividing the sample into two parts, one as the training set and another as the test set, we use different methods to train the training set and get different classifiers. Then with the test set, we check the classifiers when used for classification. If good, the classifiers can be used for predicting the unknown sources. First, we apply learning vector quantization (LVQ) to classify AGNs from stars and normal galaxies. The results are given in Table 3. In 2D, 5D and 10D spaces, the total accuracy is 97.66%, 97.69% and 97.80%, respectively. Secondly, we employ support vector machines (SVM) in different spaces. The computed results are shown in Table 4; the total accuracy amounts to 75.52%, 98.09% and 98.31%, respectively. We compare the results with those by single-layer perceptron (SLP) in Table 5. We train a perceptron with two input neurons, one output neuron and no hidden neurons for 1000 epochs. In 2D, 5D, 10D spaces, the total accuracy is 97.69%, 98.09%, 98.05%, respectively.
,
and the 10D space composed of the ten parameters. Randomly dividing the sample into two parts, one as the training set and another as the test set, we use different methods to train the training set and get different classifiers. Then with the test set, we check the classifiers when used for classification. If good, the classifiers can be used for predicting the unknown sources. First, we apply learning vector quantization (LVQ) to classify AGNs from stars and normal galaxies. The results are given in Table 3. In 2D, 5D and 10D spaces, the total accuracy is 97.66%, 97.69% and 97.80%, respectively. Secondly, we employ support vector machines (SVM) in different spaces. The computed results are shown in Table 4; the total accuracy amounts to 75.52%, 98.09% and 98.31%, respectively. We compare the results with those by single-layer perceptron (SLP) in Table 5. We train a perceptron with two input neurons, one output neuron and no hidden neurons for 1000 epochs. In 2D, 5D, 10D spaces, the total accuracy is 97.69%, 98.09%, 98.05%, respectively.
From the results by LVQ, SVM and SLP, it is obvious that the performances are comparable. In low dimensional spaces, LVQ and SLP is better than SVM, but in high dimensional spaces, SVM is better. Comparing LVQ and SLP, SLP is better. Considering enough attributes for classification, the automated methods are superior to the simple physical cutoff. Moreover, the high accuracy suggests that useful features for classification can be extracted by the method of histograms, i.e. it may be used as the applicable feature selection technique.
Table 4: Result of classification by SVM.
Table 5: Result of classification by SLP.
Table 2 shows that the efficiency of classification is rather high, more than 90% when only considering the important features. It is simple to choose a few good features for classification. But compared to the results by the automated algorithms, such a method is inefficient. The method is limited and loses information by considering only a few features. Sometimes it is very difficult to find good features. Using other tools, such as principal component analysis (Folkes et al. 1996; Zhang et al. 2003), we can find the principal features. If the number of principal components is more than 3, it is not appliable to use a simple cutoff for visualization. As a result, it is better to apply automatic approaches in such situations.
For LVQ and SLP, as shown by Tables 3 and 5, the results are rarely affected by the number of spacial dimensions when the space contains the important features. But for SVM, in contrast, the result of Table 4 is closely connected with the number of spacial dimensions even including the important features. Moreover, the more parameters considered, the higher the accuracy. The statistics listed in Tables 3-5 give a view of how well the algorithms perform in classifying AGN and non-AGN objects. These statistics tell us how effective a given method is at correctly identifying a true AGN as an AGN or a true non-AGN as a non-AGN. In other words, how often does the method misidentify objects? If the number of AGN objects identified as non-AGNs were zero, the classified accuracy of AGNs would be 100%. Conversely, if the number of non-AGNs identified as AGNs were zero, the classified accuracy of stars and normal galaxies would be 100%. The generally lower values of the classified accuracy of AGNs compared to those of stars and normal galaxies may be a result of the smaller sample size for AGNs (1656 vs. 3891). This suggests that it would be useful to run these tests again with a larger sample, a larger number of samples of each type of object would be necessary to distinguish between classes. Comparing the results, we conclude that LVQ, SVM and SLP are effective methods to classify sources with multi-wavelength data. This also indicates that the chosen parameters are good feature vectors to separate AGNs from stars and normal galaxies. The performance will increase if the data are complete or the quality and quantity of data improve. Moreover, these methods can be used to preselect AGNs from large numbers of sources in large surveys. The three supervised learning methods we investigated here gave comparable results in a number of situations. Generally, the more features considered, the better results SVM gave; however, the results of LVQ and SLP were considerable with different numbers of attributes. Also, the different methods, while giving different quality results in a number of cases, were comparable for most of the samples we examined. However, our results suggest that the parameters we chose did not adequately pick out characteristics of the objects in all cases. Other parameters added from more bands that effectively summarize the features of sources, such as from the radio band, appear to do better (Krautter et al. 1999). Thus we can improve the classified accuracy of AGNs or stars and normal galaxies, even classify different types of AGNs. Moreover, these methods can be used for other types of data, such as spectral data and photometric data.
SVM embodies the Structural Risk Minimization (SRM) principle, which is superior to Empirical Risk Minimization (ERM) principle that conventional neural networks employ. Most neural networks including LVQ and SLP are designed to find a separating hyperplane. This is not necessarily optimal. Many neural networks start with a random line and move it, until all training points are on the right side of the line. This inevitably leaves training points very close to the line in a non-optimal way. However, in SVM, a large margin classifier, i.e. a line approaching the optimal, is sought. As a result, SVM shows better performance than LVQ and SLP in high dimensional space.
Source classification depends on the quality and amount of real-time data and on the algorithm used to extract generalized mappings. Availability of high-resolution multi-wavelength data is increasing. The best possible use of this observational information requires efficient processing and generalization of high-dimensional input data. Moreover, good feature selection techniques, as well as good data mining methods, are in great demand. A very promising algorithm that combines the power of the best nonlinear techniques and tolerance to very high-dimensional data is the support vector machines (SVM) algorithm. In this work we have used the histogram as the feature selection technique and applied LVQ, SLP and SVM to multi-wavelength astronomy to separate AGNs from stars and normal galaxies. We conclude that the features selected by the histogram are useful and the performance of SVM models can be comparable or superior to that of the NN-based models in the high dimensional space. The advantages of the SVM-based techniques are expected to be much more pronounced in future large multi-wavelength surveys, which will incorporate many types of high-dimensional, multi-wavelength input data once real-time availability of this information becomes technologically feasible. All these methods can be used for astronomical object classification, data mining and preselecting AGN candidates for large surveys, such as the Large Sky Area Multi-Object Fiber Spectroscopic Telescope (LAMOST). Various data types, incuding morphology, photometry, spectral data and so on, can be applied to train the methods and obtain classifiers to classify astronomical objects or preselect intresting objects. When lacking training sets, we would explore some unsupervised methods or outlier finding algorithms to find unusual, rare, or even new types of objects and phenomena. With the development of the Virtual Observatory, these methods will be part of the toolkit of the International Virtual Observatory.
Acknowledgements
We are very grateful to anonymous referee for comments and suggestions. We would like to thank LAMOST staff for their help. This research has made use of the SIMBAD database, operated at CDS, Strasbourg, France. Simultaneously, this paper has also made use of data products from the Two Micron All Sky Survey, which is a joint project of the University of Massachusetts and the Infrared Processing and Analysis Center/California Institute of Technology, funded by the National Aeronautics and Space Administration and the National Science Foundation. This research is supported by National Natural Science Foundation of China under Grant No.10273011.