 |
Figure 1: Example for the correction of the curvature of the spectra in y-direction. Top: the raw but cosmic corrected two dimensional spectrum of the galaxy A18 (slit No. 18 of setup A) of MS 1008-12. Center: the same spectrum after applying the rectification. Bottom: the fully reduced and wavelength calibrated spectrum. A18 is an early-type galaxy and a member of MS 1008-12 (z=0.3111). Please note that the figures are expanded in y-direction for a better illustration of the curvature. |
| Open with DEXTER | |
In the text
 |
Figure 2:
Illustration of our observed data by means of one galaxy from Setup B
of the cluster MS 1008-12 (ID = B5). Left:
the spatially resolved |
| Open with DEXTER | |
In the text
 |
Figure 3:
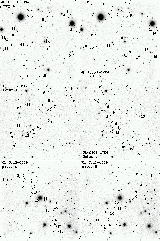
Finding charts of all MOS setups. Top: MS 1008-12.
Center: Cl 0303+17. Bottom: Cl 0413-65.
In all cases we show the full FORS 6
|
| Open with DEXTER | |
In the text
![\begin{figure}
\par\includegraphics[width=14cm,clip]{0937f4.eps}
\end{figure}](/articles/aa/full/2004/30/aa0937/Timg49.gif) |
Figure 4: Position velocity diagrams of galaxies in the field of MS 1008-12. Galaxies which entered the TF diagram presented in Paper I are labeled (TF). The solid line represents the projected best fitting model profile. See Tables 6-8 for comparison. |
| Open with DEXTER | |
In the text
![\begin{figure}
\par\includegraphics[width=13cm,clip]{0937f5.eps}
\end{figure}](/articles/aa/full/2004/30/aa0937/Timg50.gif) |
Figure 5: Position velocity diagrams of galaxies in the field of Cl 0303+17. Galaxies which entered the TF diagram presented in Paper I are labeled (TF). The solid line represents the projected best fitting model profile. See Table 9 for comparison. |
| Open with DEXTER | |
In the text
![\begin{figure}
\par\includegraphics[width=13cm,clip]{0937f6.eps}
\end{figure}](/articles/aa/full/2004/30/aa0937/Timg51.gif) |
Figure 6: Position velocity diagrams of galaxies in the field of Cl 0413-65. Galaxies which entered the TF diagram presented in Paper I are labeled (TF). The solid line represents the projected best fitting model profile. See Tables 10 and 11 for comparison. |
| Open with DEXTER | |
In the text