A&A 422, 1013-1021 (2004)
DOI: 10.1051/0004-6361:20040253
P. Harmanec1,2 - K. Uytterhoeven3 - C. Aerts3
1 -
Astronomical Institute of the Charles University,
V Holesovickách 2, 18000 Praha 8, Czech Republic
2 -
Astronomical Institute, Academy of Sciences,
25165 Ondrejov, Czech Republic
3 -
Instituut voor Sterrenkunde, Katholieke Universiteit Leuven,
Celestijnenlaan 200 B, 3001 Leuven, Belgium
Received 12 February 2004 / Accepted 11 April 2004
Abstract
A new reduction and a new analysis of a rich series of high-S/N
spectra of the bright star ![]() Sco is carried out to test
the technique of spectral disentangling in the case when one of the components
is a non-radial oscillator. We improve the orbital elements of the system and
find the basic physical properties of the binary to be
Sco is carried out to test
the technique of spectral disentangling in the case when one of the components
is a non-radial oscillator. We improve the orbital elements of the system and
find the basic physical properties of the binary to be
![]() = 24 500 K,
masses of 10.7-11.9
= 24 500 K,
masses of 10.7-11.9 ![]() and 9.6-10.7
and 9.6-10.7 ![]() and the primary
radius and rotational period of 7-8
and the primary
radius and rotational period of 7-8 ![]() and 3
and 3
![]() 56-3
56-3
![]() 68, respectively.
This also implies log g = 3.70-3.78 [cgs].
KOREL disentangling is applied and we find
that it worked properly and was not misled by the complex line-profile
variability of the pulsating primary. Moreover, the pulsational frequencies
are detected via the period search in the line intensities and radial-velocity
residuals of the primary derived by KOREL
and in the time series of residual spectra in the rest frame of the primary
after KOREL disentangling. This constitutes a much better starting point
to interpret the complex pixel-by-pixel variations of the disentangled
profiles of the primary in terms of stellar oscillations and/or additional
rotational modulation than the original spectra before disentangling.
68, respectively.
This also implies log g = 3.70-3.78 [cgs].
KOREL disentangling is applied and we find
that it worked properly and was not misled by the complex line-profile
variability of the pulsating primary. Moreover, the pulsational frequencies
are detected via the period search in the line intensities and radial-velocity
residuals of the primary derived by KOREL
and in the time series of residual spectra in the rest frame of the primary
after KOREL disentangling. This constitutes a much better starting point
to interpret the complex pixel-by-pixel variations of the disentangled
profiles of the primary in terms of stellar oscillations and/or additional
rotational modulation than the original spectra before disentangling.
Key words: stars: binaries: spectroscopic -
stars: oscillations - line: profiles - stars: individual: ![]() Sco
Sco
Large RV variations, exceeding the range of ![]() Cep oscillations, were
reported by Moore et al. (1916) and again by
Buscombe & Morris (1960). Referring to their own and
Buscombe & Morris observations, Lomb & Shobbrook (1975) concluded
that the star is a spectroscopic binary. Comparing line-profiles of
Cep oscillations, were
reported by Moore et al. (1916) and again by
Buscombe & Morris (1960). Referring to their own and
Buscombe & Morris observations, Lomb & Shobbrook (1975) concluded
that the star is a spectroscopic binary. Comparing line-profiles of ![]() Sco with
synthetic ones, Heasley et al. (1982) remarked that the observed
profiles are peculiar and that the object might be a double-lined
spectroscopic binary. It was only De Mey (1997) who found that
the RVs vary with a period of 195
Sco with
synthetic ones, Heasley et al. (1982) remarked that the observed
profiles are peculiar and that the object might be a double-lined
spectroscopic binary. It was only De Mey (1997) who found that
the RVs vary with a period of 195
![]() 8 and derived the first orbital elements.
8 and derived the first orbital elements.
A detailed study of the orbital as well as rapid spectral variations, based on more than 400 high-resolution electronic spectra of Si III 4552 and 4567 Å lines secured between 1988 and 1997, was published by Uytterhoeven et al. (2001) - Paper A hereafter. The principal results of that study are:
The initial motivation of this study was to use the technique of line-profile disentangling (Hadrava 1995,1997) to derive not only the RV curves of both binary components and improved orbital elements but also to analyze the residual spectra from KOREL disentangling in the rest frame of the primary to arrive at a better description of the line-profile changes. This study is meant to be a test case of how powerful the disentangling technique can be in application to complex line-profile variability that occurs in many early-type binaries. We also hoped to clarify the question of whether the secondary also is a line-profile variable. However, after the first attempts at KOREL disentangling, we encountered problems and we finally decided to re-investigate the original spectrograms. Since their continua have often a complicated wavy character and are strongly tilted in the outer parts of the spectrum, we carried out a new rectification interactively using the SPEFO program (see Horn et al. 1996; Skoda 1996). Each newly rectified spectrum was immediately compared to a sample spectrum to ensure the most uniform rectification. Only then we did apply KOREL and repeated analyses of the rapid periodic variations of integrated quantities, such as the radial velocity and line intensity. These results are reported in this paper. In a subsequent study, we will analyse the complex short-period line-profile variability of the primary after the KOREL disentangling in full detail and we will identify the oscillation modes (Uytterhoeven et al., in preparation).
Table 1:
Journal of available RVs of ![]() Sco.
Sco.
The observational material used in this study consists of a homogeneous set of 699 high-resolution CCD spectra obtained at ESO, La Silla, with the Coudé Auxiliary Telescope (CAT) and Coudé Echelle Spectrometer (CES). They were used by Uytterhoeven et al. (2001). They are well distributed in the orbital phase. All spectra contain the Si III triplet near 4560 Å. However, the Si III 4575 Å line is much noisier and on a number of spectra it is also affected by bad pixels of the CCD. For that reason, our analyses were restricted to Si III 4552 and Si III 4567 Å lines only.
Table 2: Exploratory orbital solutions: All epochs are given in HJD-2 400 000, the rms errors of the solutions are rms errors of 1 observation of unit weight and the systemic velocities are identified by the observatory codes from Table 1.
As mentioned above, the studies of three earlier sets of RVs of ![]() Sco are
published, and fortunately all sets are available. Combined, they
cover the whole range of RV variation over the 195
Sco are
published, and fortunately all sets are available. Combined, they
cover the whole range of RV variation over the 195
![]() 6 period, although on the
rising branch only. We therefore decided to use them for the determination of
a more accurate value of the orbital period which could then be kept fixed
in all subsequent analyses.
6 period, although on the
rising branch only. We therefore decided to use them for the determination of
a more accurate value of the orbital period which could then be kept fixed
in all subsequent analyses.
The journal of available RVs is given in Table 1. For RVs published by Campbell & Moore (1928) we used mean RVs where the same plate was measured several times. Note also the misprint in Table IV of Lomb & Shobbrook (1975): The correct time of the mid-exposure of the second RV is HJD 2 440 765.0375, not HJD 2 440 765.0875, as we have verified with the help of their Fig. 6.
To take widely different dispersions and resolutions of different spectrograms into account, we assigned weights to individual RVs which are directly proportional to spectral resolution.
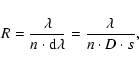
The spectral resolution is basically given by the FWHM (full width at half
maximum) of the projected slit of the spectrograph. It can also be expressed as
Considering this, we adopt a value of s=0.020 mm and n=2 for the photographic spectra and estimate their spectral resolution from formula (1), adopting 4340 Å for their approximate central wavelength. For electronic spectra, we adopt their mean resolution of 57 000 (see Paper A).
We assigned weights to all RVs according to the formula
To derive various trial and then final orbital solutions, we used the latest
version of the computer program FOTEL, developed by Hadrava
(1990)![]() . FOTEL estimates
the errors of the elements on the basis of a covariance matrix and allows
determination of individual systemic velocities as elements of the solution.
. FOTEL estimates
the errors of the elements on the basis of a covariance matrix and allows
determination of individual systemic velocities as elements of the solution.
First we derived the orbital solution for all 752 RVs already used in Paper A (53 Reticon and 699 CCD spectra). In Table 2 we compare this solution to the one given in Paper A, obtained with the Léhmann-Filhés method. This gives some idea of what the differences between different codes for RV solution can be. Keeping the eccentricity from the FOTEL solution fixed, we then derived a solution for the older RVs from photographic spectra. This solution is also given in Table 2. Note that we derived a joint systemic velocity for both Mt. Stromlo instruments. The practical reason for this is that the spectra from the 1.88-m reflector cover only one night of observations and would not be of any value for constraining the period if allowed to have their own zero point. We verified, however, that our approach is fully justified. Running a trial solution in which allowance for individual systemic velocities was made, we found both Mt. Stromlo instruments to have nearly identical zero points, the difference being 0.6 km s-1, well below the errors of both values.
Taken at face value, the comparison of the solutions for the older and more recent data seems to indicate apsidal advance and also an increase of the orbital period. However, considering the small number of older observations, their heterogeneity and also the fact that rapid line-profile variations affect the measured RVs, we adopt a conservative approach here and assume that the orbit has remained constant over the time interval covered by the data.
The RV maxima and RV minima are obviously the best defined time instants in the
observed RV curve of ![]() Sco. It is easy to verify that within the errors of the
epochs for the older and more recent data, separated for 106 orbital cycles, the
time difference between RV maxima calls for values of the orbital period between
195
Sco. It is easy to verify that within the errors of the
epochs for the older and more recent data, separated for 106 orbital cycles, the
time difference between RV maxima calls for values of the orbital period between
195
![]() 40 and 195
40 and 195
![]() 48 and the difference between the minima for values between
195
48 and the difference between the minima for values between
195
![]() 37 and 195
37 and 195
![]() 47. (Note that one-year aliases for 105 and 107 orbital cycles
would be 193
47. (Note that one-year aliases for 105 and 107 orbital cycles
would be 193
![]() 6 and 197
6 and 197
![]() 3 which are values safely excluded by the electronic
spectra.) This simple exercise indicates that both data sets can be combined to
derive a more accurate value of the orbital period. It is clear, however, that
to obtain a reasonable balance between the older and much more numerous recent
data, one should not use the RVs as they are. Only for the purpose of
determination of a new value of the orbital period we therefore replaced the
original data set of RVs by the nightly normals, keeping however their
original weights assigned to individual data. This solution is given as the
fourth one in Table 2 and the corresponding RV curve is shown in
Fig. 1. It is clearly seen that the older and more recent data can indeed be
well reconciled with a constant period.
3 which are values safely excluded by the electronic
spectra.) This simple exercise indicates that both data sets can be combined to
derive a more accurate value of the orbital period. It is clear, however, that
to obtain a reasonable balance between the older and much more numerous recent
data, one should not use the RVs as they are. Only for the purpose of
determination of a new value of the orbital period we therefore replaced the
original data set of RVs by the nightly normals, keeping however their
original weights assigned to individual data. This solution is given as the
fourth one in Table 2 and the corresponding RV curve is shown in
Fig. 1. It is clearly seen that the older and more recent data can indeed be
well reconciled with a constant period.
There is another complication in this particular case, however, because the
amplitude of the line-profile variations is comparable to the strength of the
line profile of the secondary. This leads to a situation that the sum
of squares of residuals of the KOREL solution varies very slowly with the binary
mass ratio, passing through a number of local minima of comparable depths.
![\begin{figure}
\par\includegraphics[width=8.5cm,clip]{0253f1.eps}
\end{figure}](/articles/aa/full/2004/30/aa0253-04/img30.gif) |
Figure 1:
The radial-velocity curve of |
| Open with DEXTER | |
![\begin{figure}
\par\includegraphics[width=8.7cm,clip]{0253f2a.eps}\par\vspace*{4mm}
\includegraphics[width=8.7cm,clip]{0253f2b.eps}
\end{figure}](/articles/aa/full/2004/30/aa0253-04/img31.gif) |
Figure 2:
The radial-velocity curve of |
| Open with DEXTER | |
![\begin{figure}
\par\includegraphics[width=8.5cm,clip]{0253f3a.eps}\par\vspace*{2mm}
\includegraphics[width=8.5cm,clip]{0253f3b.eps}
\end{figure}](/articles/aa/full/2004/30/aa0253-04/img32.gif) |
Figure 3: The spectrum obtained at one elongation on HJD 2 450 742.4691 is first compared with the disentangled Si III line profile of the primary shifted in RV for +52.8 km s-1 ( upper panel). The residual spectrum after subtraction of the disentangled profile of the primary is compared with the disentangled profile of the secondary shifted for -58.5 km s-1 ( bottom panel). |
| Open with DEXTER | |
![\begin{figure}
\par\includegraphics[width=8.5cm,clip]{0253f4a.eps}\par\vspace*{2mm}
\includegraphics[width=8.5cm,clip]{0253f4b.eps}
\end{figure}](/articles/aa/full/2004/30/aa0253-04/img33.gif) |
Figure 4: The spectrum obtained at the other elongation on HJD 2 450 194.9224 is first compared with the disentangled Si III line profile of the primary shifted in RV for -56.1 km s-1 ( upper panel). The residual spectrum after subtraction of the disentangled profile of the primary is compared with the disentangled profile of the secondary shifted for +62.0 km s-1 ( bottom panel). |
| Open with DEXTER | |
We ran a number of trial solutions mapping the parameter space. It turned out that the mass ratio must be higher than the one estimated in Paper A. The most satisfactory fits were obtained for solutions leading to mass ratios between about 0.9 and 1.1 and we finally arrived at a solution which is given (for comparison) as the fifth one in Table 2. The corresponding RV curves are shown in Fig. 2. Some larger residuals from the RV curve of the secondary are not surprising. KOREL derives the velocities via cross-correlation of individual line profiles with the disentangled ones. In cases when a subfeature with a strength comparable to that of the secondary line profile appears near the position of the secondary line, the code is fooled and returns an incorrect RV for the secondary.
Nevertheless, to illustrate the good overall performance of KOREL, we show the comparison of the disentangled profiles with the observed ones for two opposite elongations of the binary in Figs. 3 and 4.
Johnson et al. (1966) give the following mean ![]() values:
V =2
values:
V =2
![]() 41,
41, ![]() = -0
= -0
![]() 21 and
21 and ![]() = -0
= -0
![]() 88. The Hipparcos photometry
transformed to the Johnson V via Harmanec's (1998) transformation
formula gives V = 2
88. The Hipparcos photometry
transformed to the Johnson V via Harmanec's (1998) transformation
formula gives V = 2
![]() 386, in excellent agreement with the Geneva photometry
mean value V = 2
386, in excellent agreement with the Geneva photometry
mean value V = 2
![]() 382. Adopting these latter values and Johnson et al.'s
colour indices, one obtains the following dereddened values:
V0=2
382. Adopting these latter values and Johnson et al.'s
colour indices, one obtains the following dereddened values:
V0=2
![]() 284,
284, ![]() 0=-0
0=-0
![]() 242 and
242 and ![]() 0=-0
0=-0
![]() 903. These are normal values
for a B1.5III star (cf., e.g., Golay 1974) and
Popper's (1980) calibration implies
903. These are normal values
for a B1.5III star (cf., e.g., Golay 1974) and
Popper's (1980) calibration implies
![]() = 24 500 K.
= 24 500 K.
Combining the definition of the effective temperature
![]()
Adopting the Hipparcos parallax of p = 0
![]() 00703
00703 ![]() 0
0
![]() 00073 after
Perryman et al. (1997) and the above values, one arrives at a stellar
radius of 7.6
00073 after
Perryman et al. (1997) and the above values, one arrives at a stellar
radius of 7.6 ![]() ,
the range given by the parallax error being
6.9-8.5
,
the range given by the parallax error being
6.9-8.5 ![]() .
For comparison, using
.
For comparison, using
![]() = 23 400 K (to have some idea
about possible colour effects of a fainter secondary on the observed
= 23 400 K (to have some idea
about possible colour effects of a fainter secondary on the observed
![]() magnitudes) would lead to a very similar
radius: 8.0 (7.3-8.9)
magnitudes) would lead to a very similar
radius: 8.0 (7.3-8.9) ![]() .
According to Harmanec's (1988)
tabulation, a normal mass range for these effective temperatures
would be (8.8-9.7)
.
According to Harmanec's (1988)
tabulation, a normal mass range for these effective temperatures
would be (8.8-9.7) ![]() .
The problem of these estimates is that they
represent only an upper limit of the radius of the
.
The problem of these estimates is that they
represent only an upper limit of the radius of the ![]() Sco primary since
we do not know the contribution of the secondary to the luminosity of
the system. However, one can also estimate the lower limit of the radius
of the primary, assuming that both stars are equally bright in
the V passband, i.e. assuming the V magnitude of
the primary to be for 2.5 log 2 = 0
Sco primary since
we do not know the contribution of the secondary to the luminosity of
the system. However, one can also estimate the lower limit of the radius
of the primary, assuming that both stars are equally bright in
the V passband, i.e. assuming the V magnitude of
the primary to be for 2.5 log 2 = 0
![]() 752 fainter than the dereddened V magnitude of the system. For
752 fainter than the dereddened V magnitude of the system. For
![]() = 24 500 K and the observed parallax
this leads to the radius of the primary of 5.4 (4.9-6.0)
= 24 500 K and the observed parallax
this leads to the radius of the primary of 5.4 (4.9-6.0) ![]() ,
which is
still larger than the normal main-sequence radius of a star with such
effective temperature which, according to Harmanec's (1988)
tabulation, is 4.6
,
which is
still larger than the normal main-sequence radius of a star with such
effective temperature which, according to Harmanec's (1988)
tabulation, is 4.6 ![]() .
Notably, the range of possible values of
the primary radius is not too wide, especially if one considers
that the primary is probably the brighter of the two.
.
Notably, the range of possible values of
the primary radius is not too wide, especially if one considers
that the primary is probably the brighter of the two.
The orbital solution from KOREL leads to
![]()
![]() and
and
![]()
![]() .
The inclination of the oscillation symmetry axis of 40
.
The inclination of the oscillation symmetry axis of 40![]() estimated in Paper A from line-profile modelling seems unacceptably
low since it would imply masses over 35
estimated in Paper A from line-profile modelling seems unacceptably
low since it would imply masses over 35 ![]() .
.
In Fig. 6 we compare the probable radius and
![]() of the primary
with Schaller's et al. (1992) evolutionary models.
One can see that the most probable range of the mass of the primary
is between about 10 and 12
of the primary
with Schaller's et al. (1992) evolutionary models.
One can see that the most probable range of the mass of the primary
is between about 10 and 12 ![]() which in turn implies that the orbital inclination should not
be smaller than about 75
which in turn implies that the orbital inclination should not
be smaller than about 75![]() .
Available Hipparcos photometry does not cover phases near the upper
conjunction of the binary. We, therefore, cannot exclude the
presence of at least partial eclipses and 90
.
Available Hipparcos photometry does not cover phases near the upper
conjunction of the binary. We, therefore, cannot exclude the
presence of at least partial eclipses and 90![]() remains a practical
upper limit on the inclination. This leaves us with a range 10.7-11.9
remains a practical
upper limit on the inclination. This leaves us with a range 10.7-11.9 ![]() for the primary and 9.6-10.7
for the primary and 9.6-10.7 ![]() for the secondary.
The difference in masses is certainly sufficient for the assumption
that (due to a strong dependence of the main-sequence lifetime
on the mass) the secondary is still a luminosity class V object with
a radius significantly smaller than the primary.
for the secondary.
The difference in masses is certainly sufficient for the assumption
that (due to a strong dependence of the main-sequence lifetime
on the mass) the secondary is still a luminosity class V object with
a radius significantly smaller than the primary.
A comparison of disentangled line profiles with the synthetic spectra
indicates projected rotational velocities of the binary
components ![]() = 100 km s-1 and
= 100 km s-1 and ![]() = 170 km s-1.
Assuming that the equatorial plane of the primary and
the orbital plane coincide, and that the primary star contributes 90 per cent
of the total light in the V passband, one has a range of
= 170 km s-1.
Assuming that the equatorial plane of the primary and
the orbital plane coincide, and that the primary star contributes 90 per cent
of the total light in the V passband, one has a range of
![]() also for the inclination of the rotational
axis of the primary. For
also for the inclination of the rotational
axis of the primary. For
![]() = 24 500 K and the Hipparcos parallax,
formula (5) gives R1 = 7.28
= 24 500 K and the Hipparcos parallax,
formula (5) gives R1 = 7.28 ![]() .
The corresponding range of the the rotational period of the primary
is then between 3
.
The corresponding range of the the rotational period of the primary
is then between 3
![]() 56 and 3
56 and 3
![]() 68. This brackets the value of 3
68. This brackets the value of 3
![]() 56
detected in the WIRE photometry by Cuypers et al. (2004). This is
why we believe that the observed 3
56
detected in the WIRE photometry by Cuypers et al. (2004). This is
why we believe that the observed 3
![]() 56 period can probably be identified
with the rotational period of the
56 period can probably be identified
with the rotational period of the ![]() Sco primary. Note also that a spin-orbit
synchronization at periastron would require a rotational period of the primary
of some 56 days. Clearly, the system is far from the spin-orbit
synchronization at periastron.
Sco primary. Note also that a spin-orbit
synchronization at periastron would require a rotational period of the primary
of some 56 days. Clearly, the system is far from the spin-orbit
synchronization at periastron.
In passing we note that ![]() Sco is obviously a good target for interferometric
observations. In the optimal case, not only the orbital inclination but also
the relative luminosities of the components could be derived and this in turn
would allow a much more accurate determination of the component masses and
radii. On the other hand, with its relatively short and accurately enough
known orbital period, it could become a good calibration target
for future interferometers.
Sco is obviously a good target for interferometric
observations. In the optimal case, not only the orbital inclination but also
the relative luminosities of the components could be derived and this in turn
would allow a much more accurate determination of the component masses and
radii. On the other hand, with its relatively short and accurately enough
known orbital period, it could become a good calibration target
for future interferometers.
![\begin{figure}
\par\includegraphics[width=8.8cm,clip]{0253f5.eps}
\end{figure}](/articles/aa/full/2004/30/aa0253-04/img54.gif) |
Figure 5: Residual line profiles from the spectra taken during the night of 20 July 1997 (HJD 2 450 650) after KOREL disentangling. The left ( right) panel shows the profiles in the rest frame of the primary (secondary). The disentangled Si III profile of the primary (secondary) is shown at the bottom of the panel. Time runs from the bottom to the top. |
| Open with DEXTER | |
![\begin{figure}
\par\includegraphics[width=8.4cm,clip]{0253f6.eps}
\end{figure}](/articles/aa/full/2004/30/aa0253-04/img55.gif) |
Figure 6: The maximum and minimum radius of the primary estimated from the Hipparcos parallax are compared with Schaller's et al. (1992) evolutionary models. Masses of the models for the zero-age and terminal-age main sequence are given. |
| Open with DEXTER | |
To answer the remaining questions concerning the preservation of the line-profile variability of the primary in the spectra after KOREL disentangling, we need to have a closer look at the residual spectra in the rest frame of the primary (secondary), which are provided by the KOREL disentangling: the disentangled line profiles of the primary and secondary, properly shifted in velocity, are subtracted by the program from each individual spectrum.
To visualise the character of the rapid variations of the primary, we show
in the left panel of Fig. 5 the residual spectra in the rest frame
of the primary for the night series obtained on 20 July 1997 (HJD 2 450 650).
One can see that the line-profile variations have varying global line
asymmetry as well as very complicated structures of subfeatures.
A clear pattern of subfeatures is moving from the blue to the red across
the residuals. We note that similar moving features are seen in
the residual spectra of other hot line-profile variables, perhaps
the best example being the archetype line-profile variable ![]() Persei (cf. De Cat et al. 2000, and references
therein).
Persei (cf. De Cat et al. 2000, and references
therein).
A Lomb-Scargle period search of the RV (computed as the first
velocity moment in the description by Aerts et al. 1992) calculated from
the residual spectra in the rest frame of the primary, detects a dominant
period close to the 0
![]() 19983 period. Moreover, in the prewhitened RV data
we also detect the 0
19983 period. Moreover, in the prewhitened RV data
we also detect the 0
![]() 20543 period. The two intrinsic (pulsational)
periods reported by Lomb & Shobbrook (1972, 1975) appear clearly in the
residual spectra in the rest frame of the primary after KOREL
disentangling.
20543 period. The two intrinsic (pulsational)
periods reported by Lomb & Shobbrook (1972, 1975) appear clearly in the
residual spectra in the rest frame of the primary after KOREL
disentangling.
As a comparison, we show in the right panel of Fig. 5 the
residual spectra in the rest frame of the secondary for the same series
of spectra (HJD 2 450 650). It is clear that the residuals are much noisier
and that no clear pattern of moving features is seen there. No periodicity
is found in the RV derived from the residual profiles in the rest frame of
the secondary and a search for variations near the 0
![]() 19983 period
was negative. This shows that we cannot find signs of the intrinsic
variability of the primary nor of any other periodicity in the lines of
the secondary. This finding corroborates our earlier conclusion that the
line-profile variations are associated with the primary. It also shows that
KOREL disentangling is a powerful tool to safely disentangle
the individual spectra of binary components even in situations when one of
the components is a line-profile variable. We find that
the intrinsic variations of the primary do not leave a signature
in the disentangled residual profiles of the weak secondary.
19983 period
was negative. This shows that we cannot find signs of the intrinsic
variability of the primary nor of any other periodicity in the lines of
the secondary. This finding corroborates our earlier conclusion that the
line-profile variations are associated with the primary. It also shows that
KOREL disentangling is a powerful tool to safely disentangle
the individual spectra of binary components even in situations when one of
the components is a line-profile variable. We find that
the intrinsic variations of the primary do not leave a signature
in the disentangled residual profiles of the weak secondary.
Next, we analyzed the intrinsic variability of ![]() Sco
in the scalar quantities obtained from the KOREL disentangling.
Sco
in the scalar quantities obtained from the KOREL disentangling.
![\begin{figure}
\par\includegraphics[width=8.6cm,clip]{0253f7.eps}
\end{figure}](/articles/aa/full/2004/30/aa0253-04/img57.gif) |
Figure 7:
Stellingwerf's (1978) |
| Open with DEXTER | |
In Fig. 7 we present periodograms of three scalar quantities (RV,
photometry and line intensities). One can see that all three suffer from strong
aliasing problems. Yet, one can note differences between
individual periodograms. The periodogram of the KOREL-recovered
"light'' variations in the bottom panel indicates the presence
of a frequency close to 5.004 c d-1, which corresponds to the
known 0
![]() 19983 photometric period. In contrast, the deepest peak
in the periodogram of the RV residuals from the orbit of the
primary (affected by line-profile variations) shows a deepest
minimum at frequency of 4.9992 c d-1, i.e. for a period of
0
19983 photometric period. In contrast, the deepest peak
in the periodogram of the RV residuals from the orbit of the
primary (affected by line-profile variations) shows a deepest
minimum at frequency of 4.9992 c d-1, i.e. for a period of
0
![]() 20003, significantly different from the photometric period.
No clear conclusion can be drawn from the periodogram of Hipparcos
photometry although we expect that the photometric period should be
present in this data set. We therefore show in Fig. 8
the KOREL line photometry converted to magnitudes and the Hipparcos
photometry, plotted for the ephemeris based on a sinusoidal fit to the
KOREL line photometry. One can see a sinusoidal variation of line intensity
variation which has a minimum at the same phase as the much less numerous
Hipparcos photometry. The latter is remarkable in the following: the light
curve has two clearly defined boundaries: a constant maximum level and an
envelope at the bottom, corresponding to light decreases with the largest
amplitude
20003, significantly different from the photometric period.
No clear conclusion can be drawn from the periodogram of Hipparcos
photometry although we expect that the photometric period should be
present in this data set. We therefore show in Fig. 8
the KOREL line photometry converted to magnitudes and the Hipparcos
photometry, plotted for the ephemeris based on a sinusoidal fit to the
KOREL line photometry. One can see a sinusoidal variation of line intensity
variation which has a minimum at the same phase as the much less numerous
Hipparcos photometry. The latter is remarkable in the following: the light
curve has two clearly defined boundaries: a constant maximum level and an
envelope at the bottom, corresponding to light decreases with the largest
amplitude![]() . It is known
that the amplitude of the light curve for the 0
. It is known
that the amplitude of the light curve for the 0
![]() 19983 period varies with a beat
period of 7
19983 period varies with a beat
period of 7
![]() 33. This means that a simple folding of photometric data obtained
over an interval of several years cannot give a clean light curve. However, for
oscillations with one frequency and variable amplitude one would expect the
observations to be distributed more or less symmetrically around the mean light
level. The impression from the Hipparcos light curve instead is that one
observes occassional light decreases of a different amount from a constant
maximum level, i.e. something seems to shield the stellar radiation
during the main oscillation cycle. We admit, however, that this statement
is based on very limited Hipparcos data.
33. This means that a simple folding of photometric data obtained
over an interval of several years cannot give a clean light curve. However, for
oscillations with one frequency and variable amplitude one would expect the
observations to be distributed more or less symmetrically around the mean light
level. The impression from the Hipparcos light curve instead is that one
observes occassional light decreases of a different amount from a constant
maximum level, i.e. something seems to shield the stellar radiation
during the main oscillation cycle. We admit, however, that this statement
is based on very limited Hipparcos data.
![\begin{figure}
\par\includegraphics[width=8.6cm,clip]{0253f8a.eps}\par\vspace*{2mm}
\includegraphics[width=8.6cm,clip]{0253f8b.eps}
\end{figure}](/articles/aa/full/2004/30/aa0253-04/img58.gif) |
Figure 8:
The Hipparcos |
| Open with DEXTER | |
We also carried out a period search in the line-photometry residuals
after their prewhitening for the 0
![]() 199828 period. The next best period
between 0
199828 period. The next best period
between 0
![]() 15 and 0
15 and 0
![]() 21 is a period of 0
21 is a period of 0
![]() 1756326, clearly identical to
one of the periods detected in the WIRE photometry.
1756326, clearly identical to
one of the periods detected in the WIRE photometry.
A detailed analysis and interpretation of the pixel-by-pixel variations in the residual disentangled profiles of the primary and identification of the oscillation modes is beyond the scope of the current paper and will be presented in a follow-up study (Uytterhoeven et al., in preparation).
The result presented here is probably the first application of the method of "line photometry'' (Hadrava 1997) to the detection of light variations with a period different from the respective orbital period from spectroscopy without absolute flux calibration.
Figure 9 shows a phase plot of the velocity residuals
from the primary orbit vs. phase of the sinusoidal line fit
for the best detected period near 0
![]() 20003.
Within the accuracy of their determination,
the best fit periods from KOREL line photometry and from velocity
residuals fulfil exactly the following relation:
20003.
Within the accuracy of their determination,
the best fit periods from KOREL line photometry and from velocity
residuals fulfil exactly the following relation:

![\begin{figure}
\par\includegraphics[width=8.5cm,clip]{0253f9.eps}
\end{figure}](/articles/aa/full/2004/30/aa0253-04/img60.gif) |
Figure 9:
The RV |
| Open with DEXTER | |
Another important conclusion from the KOREL disentangling is that
the observed line-profile variability of ![]() Sco is entirely due to
physical variability of the primary star. We shall devote a follow-up study
(Uytterhoeven et al., in preparation) to the detailed interpretation of the
pixel-to-pixel line-profile variability in terms of oscillations and/or
rotational modulation aiming at a unique identification of the observed
modes of oscillations. We have already shown here that the scalar quantities
derived by KOREL, the RV residuals of the primary from the orbit
and the "line intensity", measuring continuum variations, clearly
vary with the main known oscillation period of the star and also
show some hints of a few other known short periods.
Sco is entirely due to
physical variability of the primary star. We shall devote a follow-up study
(Uytterhoeven et al., in preparation) to the detailed interpretation of the
pixel-to-pixel line-profile variability in terms of oscillations and/or
rotational modulation aiming at a unique identification of the observed
modes of oscillations. We have already shown here that the scalar quantities
derived by KOREL, the RV residuals of the primary from the orbit
and the "line intensity", measuring continuum variations, clearly
vary with the main known oscillation period of the star and also
show some hints of a few other known short periods.
Spectral disentangling is now a well-recognised modern and powerful technique
applied to binary-star spectral observations (see Hilditch et al. 2004
for a recent overview of developments in this area).
Here, we have shown that KOREL, one of the most elaborate disentangling
programs currently available, is remarkably well suited to analyse
complex line-profile variations in spectroscopic binaries.
Indeed, applying KOREL to a rich set of high dispersion and high-S/N
spectroscopic observations of a complicated line-profile
variable ![]() Cep star
Cep star ![]() Sco, we found that KOREL was able to recover
rapid line-profile variations of the primary in the residual spectra
derived in the rest frame of this component. This provides an excellent
opportunity to carry out a time series analysis of the residual spectra
prewhitened for the orbital variations in an objective way.
Moreover, all available spectra, not only long night series of observations,
become usable for such analyses. The fact that KOREL succeeds in
such a situation is by no means obvious since line-profile variability
violates one of the principles on which this algorithm is built.
Sco, we found that KOREL was able to recover
rapid line-profile variations of the primary in the residual spectra
derived in the rest frame of this component. This provides an excellent
opportunity to carry out a time series analysis of the residual spectra
prewhitened for the orbital variations in an objective way.
Moreover, all available spectra, not only long night series of observations,
become usable for such analyses. The fact that KOREL succeeds in
such a situation is by no means obvious since line-profile variability
violates one of the principles on which this algorithm is built.
We deliberately tested KOREL on ![]() Sco because of its very complex and so far
poorly understood line-profile variations (Uytterhoeven et al. 2001).
For this star, the orbital and the intrinsic periods differ mutually for three
orders of magnitude. Moreover, the RV amplitudes of the intrinsic variations
are for more than one order of magnitude smaller than the orbital one.
Such a situation occurs for several other pulsating stars in spectroscopic
binaries but certainly not for all of them. It remains to be seen
whether KOREL can do an equally good job for systems for which the
intrinsic variability occurs on a time scale comparable to the orbital
period and/or with an RV amplitude comparable to orbital RV changes.
Conceivably, a still more stringent test would be the case of line-profile
variations characterised by large profile asymmetries, such as occur in
slow rotators, rather than by moving subfeatures. A first attempt to apply
disentangling in such a case was carried out by De Cat et al. (2004)
for the double-lined slowly pulsating B star HD 123515.
Sco because of its very complex and so far
poorly understood line-profile variations (Uytterhoeven et al. 2001).
For this star, the orbital and the intrinsic periods differ mutually for three
orders of magnitude. Moreover, the RV amplitudes of the intrinsic variations
are for more than one order of magnitude smaller than the orbital one.
Such a situation occurs for several other pulsating stars in spectroscopic
binaries but certainly not for all of them. It remains to be seen
whether KOREL can do an equally good job for systems for which the
intrinsic variability occurs on a time scale comparable to the orbital
period and/or with an RV amplitude comparable to orbital RV changes.
Conceivably, a still more stringent test would be the case of line-profile
variations characterised by large profile asymmetries, such as occur in
slow rotators, rather than by moving subfeatures. A first attempt to apply
disentangling in such a case was carried out by De Cat et al. (2004)
for the double-lined slowly pulsating B star HD 123515.
Acknowledgements
We acknowledge the use of the recent versions of the programs FOTEL and KOREL written by Dr. P. Hadrava. This study was initiated thanks to the senior fellowship awarded to P. Harmanec by the Research Council of the Catholic University of Leuven which allowed his three-month stay at the Institute of Astronomy in the Department of Physics and Astronomy. His research was also supported from the research plans J13/98: 113200004 of Ministry of Education, Youth and Sports and AV 0Z1 003909 and project K2043105 of the Academy of Sciences of the Czech Republic. K. Uytterhoeven is supported by the Fund for Scientific Research - Flanders (FWO) under project G.0178.02. Finally, we wish to thank the referee, Dr. M. Friedjung, for a careful reading and for suggestions which helped to improve the clarity of the presentation.