 |
Figure 1: Mosaic images of the SMC region in the 0.5-3.0 keV energy band. The left image is the combined observations of XMM-Newton Rev's 157, 247 and 433, while the right panel is an image of Rev 156. Individual remnants are indicated. The out-of-time events from IKT 22 can be seen. |
| Open with DEXTER | |
In the text
 |
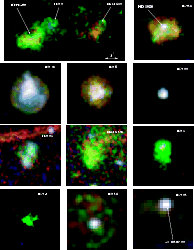
Figure 2: Details of the remnants in our sample. Red, green and blue represents the 0.5-0.7 keV, 0.7-1.0 and 1.0-3.0 keV energy bands. All the images are on the same plate scale, as indicated in the upper left image. |
| Open with DEXTER | |
In the text
 |
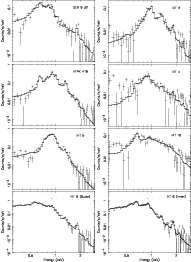
Figure 3: Combined EPIC (i.e. EPIC-pn+EPIC-MOS) background-subtracted spectra of individual SNRs. The crosses represent the data points and error bars and the solid histogram represent the best fit models (i.e. Sedov model for all spectra appearing in Table 4, and the single temperature NEI model for the rest). |
| Open with DEXTER | |
In the text
 |
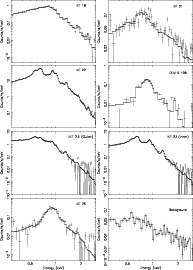
Figure 4: Same as for Fig. 3. The lower right panel represents a typical background spectrum. |
| Open with DEXTER | |
In the text
![\begin{figure}
\par\resizebox{8.8cm}{!}{\includegraphics[angle=-90]{0156fig5.ps}}\end{figure}](/articles/aa/full/2004/27/aa0156/Timg54.gif) |
Figure 5: RGS spectrum of IKT 22 ( top) and IKT 23 ( bottom). The most prominent emission lines are labeled. |
| Open with DEXTER | |
In the text
![\begin{figure}
\par\resizebox{8.8cm}{!}{\includegraphics[angle=-90]{0156fig6.ps}}\end{figure}](/articles/aa/full/2004/27/aa0156/Timg67.gif) |
Figure 6: Average SMC abundances. The average abundance values obtained from fits to IKT 6 IKT 18 and IKT 23 are represented by diamonds. Results from Russel & Dopita (1992) are indicated with circles. |
| Open with DEXTER | |
In the text